
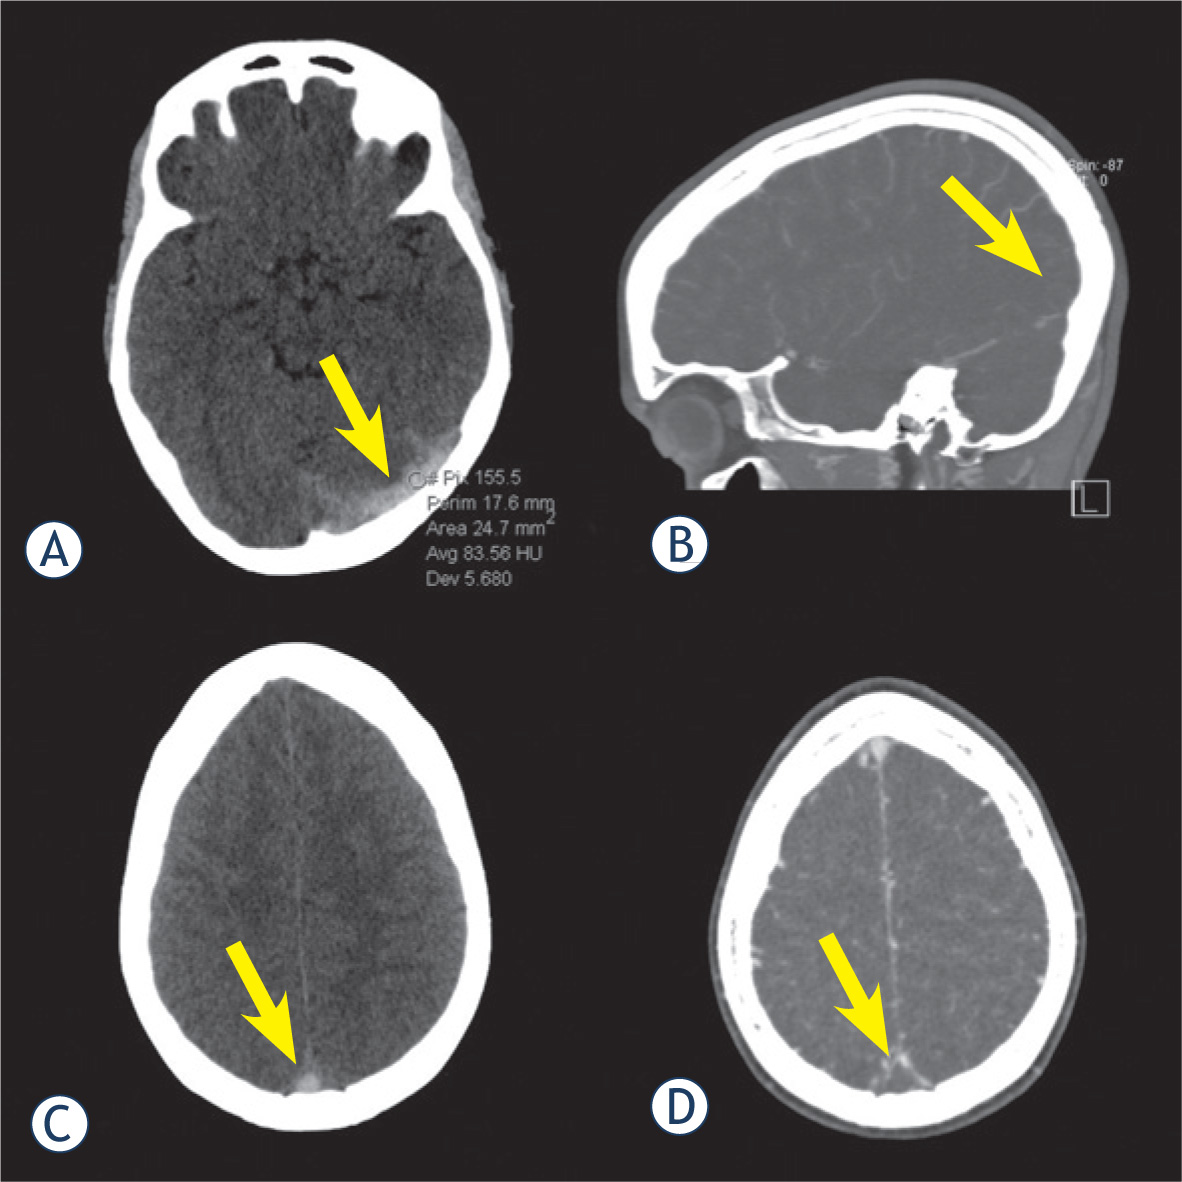
Figure 1
19-year-old female with thrombosis (arrow) of the left transverse sinus (LTS) (A) and superior sagittal sinus (C), confirmed by CT venography in sagittal (B) and axial (D) reconstruction. Average attenuation inside the LTS was 83.6 HU.
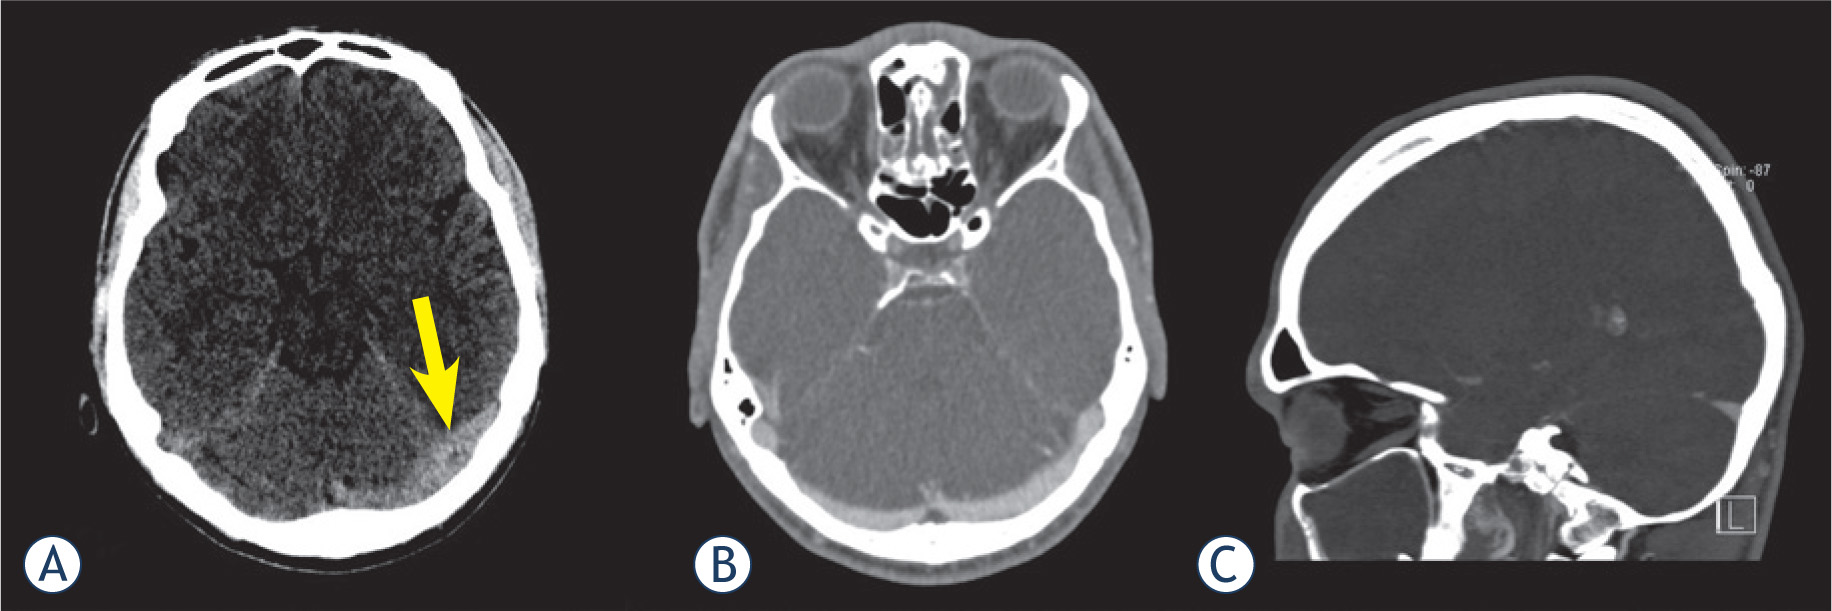
Figure 2
Left transverse sinus (LTS) of a 26-year-old male appeared hyperattenuated on non-contrast computed tomography (arrow) (A) and was interpreted as thrombosed by both readers. However, CT venography in axial (B) and sagittal (C) reconstruction showed patency of the LTS. Average attenuation inside the LTS was 60 HU.
Table 1
Location of thrombus and parenchymal changes in 13 patients with cerebral venous sinus thrombosis (CVST)
| Patient No | Location of thrombus | Parenchymal changes |
|---|---|---|
| 1 | RTS, RSS | None |
| 2 | LTS | Hemorrhage, edema |
| 3 | SSS, RTS, RSS | None |
| 4 | RTS | None |
| 5 | SSS, RTS, RSS | None |
| 6 | SSS, LTS, LSS, right ICV, left ICV, VG | None |
| 7 | RTS, RSS | None |
| 8 | RTS, RSS | None |
| 9 | LTS, LSS | None |
| 10 | SSS, RTS, RSS, cortical veins | None |
| 11 | SSS, LTS, LSS | Hemorrhage, edema |
| 12 | RTS | Hemorrhage, edema |
| 13 | SSS, cortical veins | Hemorrhage, edema |
ICV = internal cerebral vein; LSS = left sigmoid sinus; LTS = left transverse sinus; RSS = right sigmoid sinus; RTS = right transverse sinus; SSS = superior sagittal sinus; VG = vein of Galen
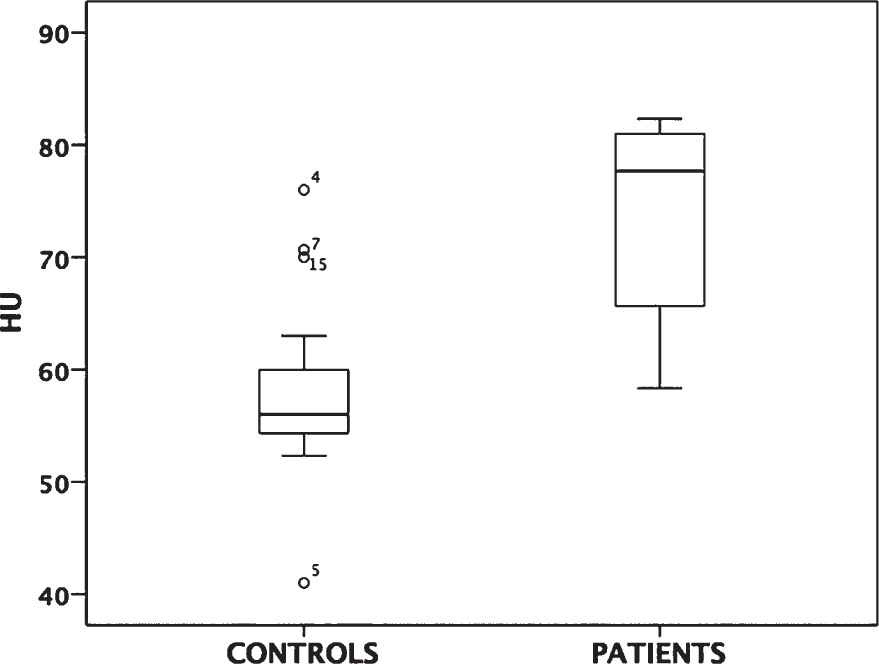
Figure 3
The attenuation values between cerebral venous sinus thrombosis (CVST) patients and control group were significantly different (73.4 ± 14.12 HU vs. 58.1 ± 7.58 HU; p = 0.000). HU, Hounsfield units.