
Table 1
A list of the analyzed commonly used diffusion sensitizing gradients (DSG) configurations in DTI, adopted from12, along with the corresponding values of NDSG, condition number(CN) and P.
| # | Scheme name | NDSG[1] | CN[1] | P[%] |
|---|---|---|---|---|
| 1 | Tetrahedral | 6 | 9.148 | 16.53 |
| 2 | Cond 6 | 6 | 5.984 | 14.19 |
| 3 | Decahedral | 10 | 2.748 | 10.70 |
| 4 | Jones noniso | 7 | 2.560 | 12.13 |
| 5 | Dual-gradient | 6 | 2.000 | 11.44 |
| 6 | Jones 10 | 10 | 1.624 | 9.67 |
| 7 | Jones 20 | 20 | 1.615 | 8.10 |
| 8 | Jones 30 | 30 | 1.594 | 7.16 |
| 9 | Papadakis | 12 | 1.587 | 9.29 |
| 10 | Jones 6 | 6 | 1.583 | 11.04 |
| 11 | Muthupallai | 6 | 1.581 | 11.11 |
| 12 | Tetraortho | 7 | 1.527 | 10.68 |
| 13 | DSM 6 | 6 | 1.323 | 11.41 |
| 14 | DSM 10 | 10 | 1.324 | 10.02 |
| 15 | DSM 20 | 20 | 1.668 | 8.43 |
| 16 | DSM 30 | 30 | 1.430 | 7.45 |
| 17 | DSM 40 | 40 | 1.401 | 6.87 |
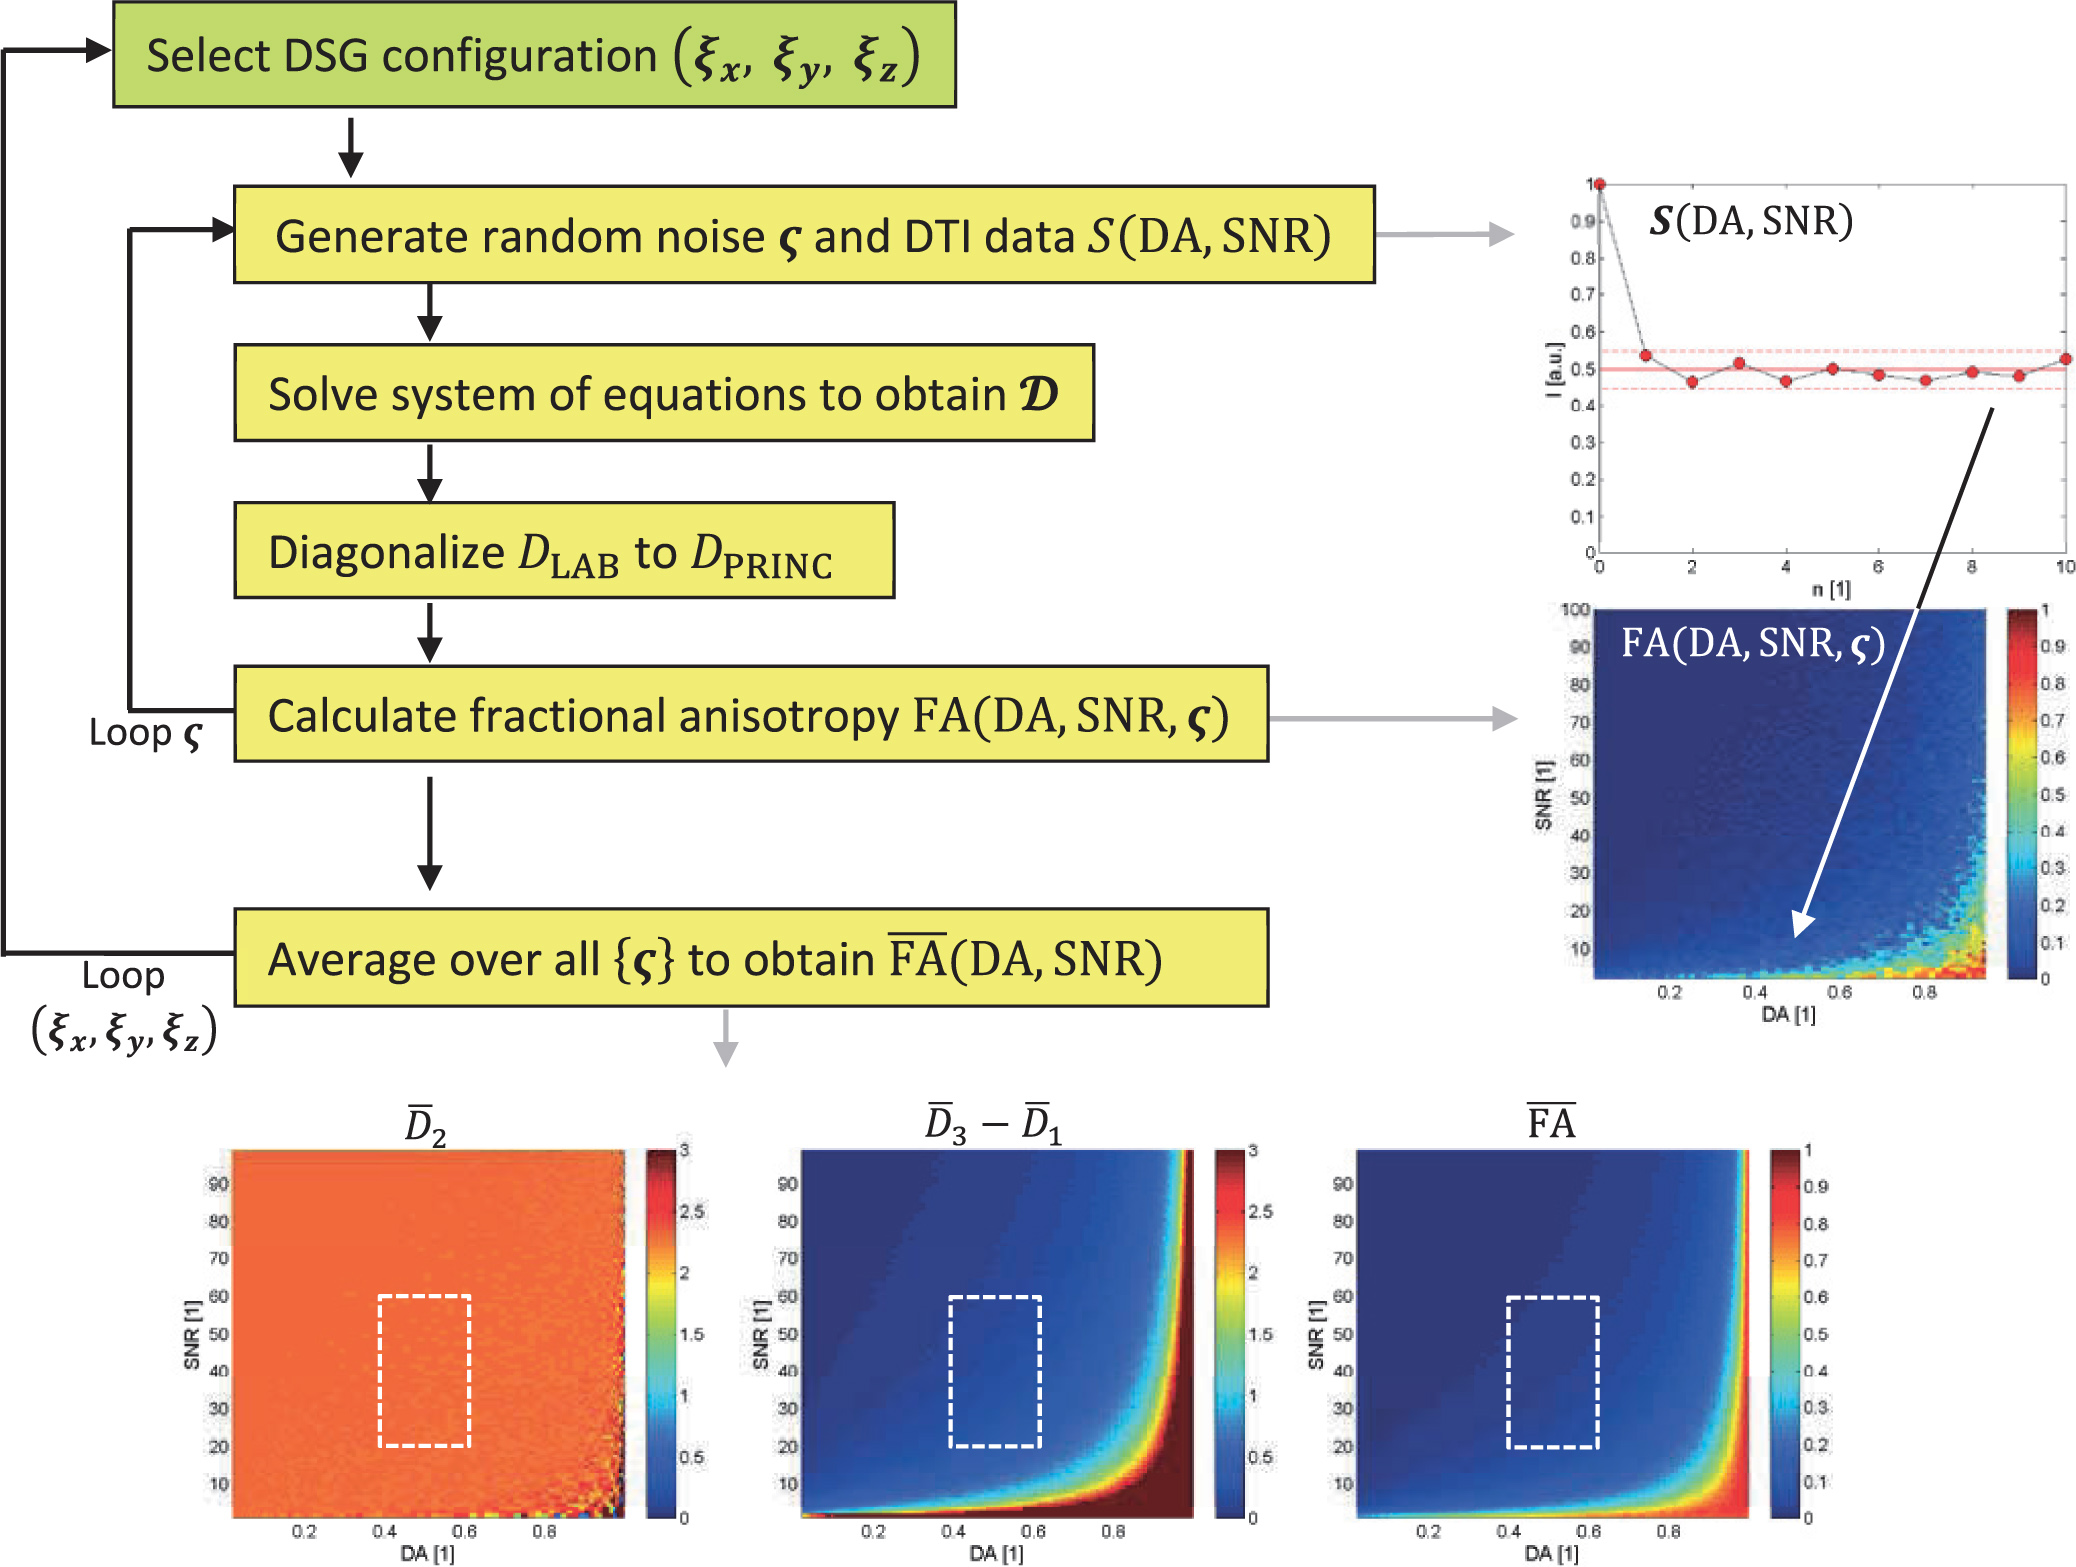
A simulation flowchart for analysis of selected commonly used and random/isotropic diffusion sensitizing gradients (DSG) configurations.
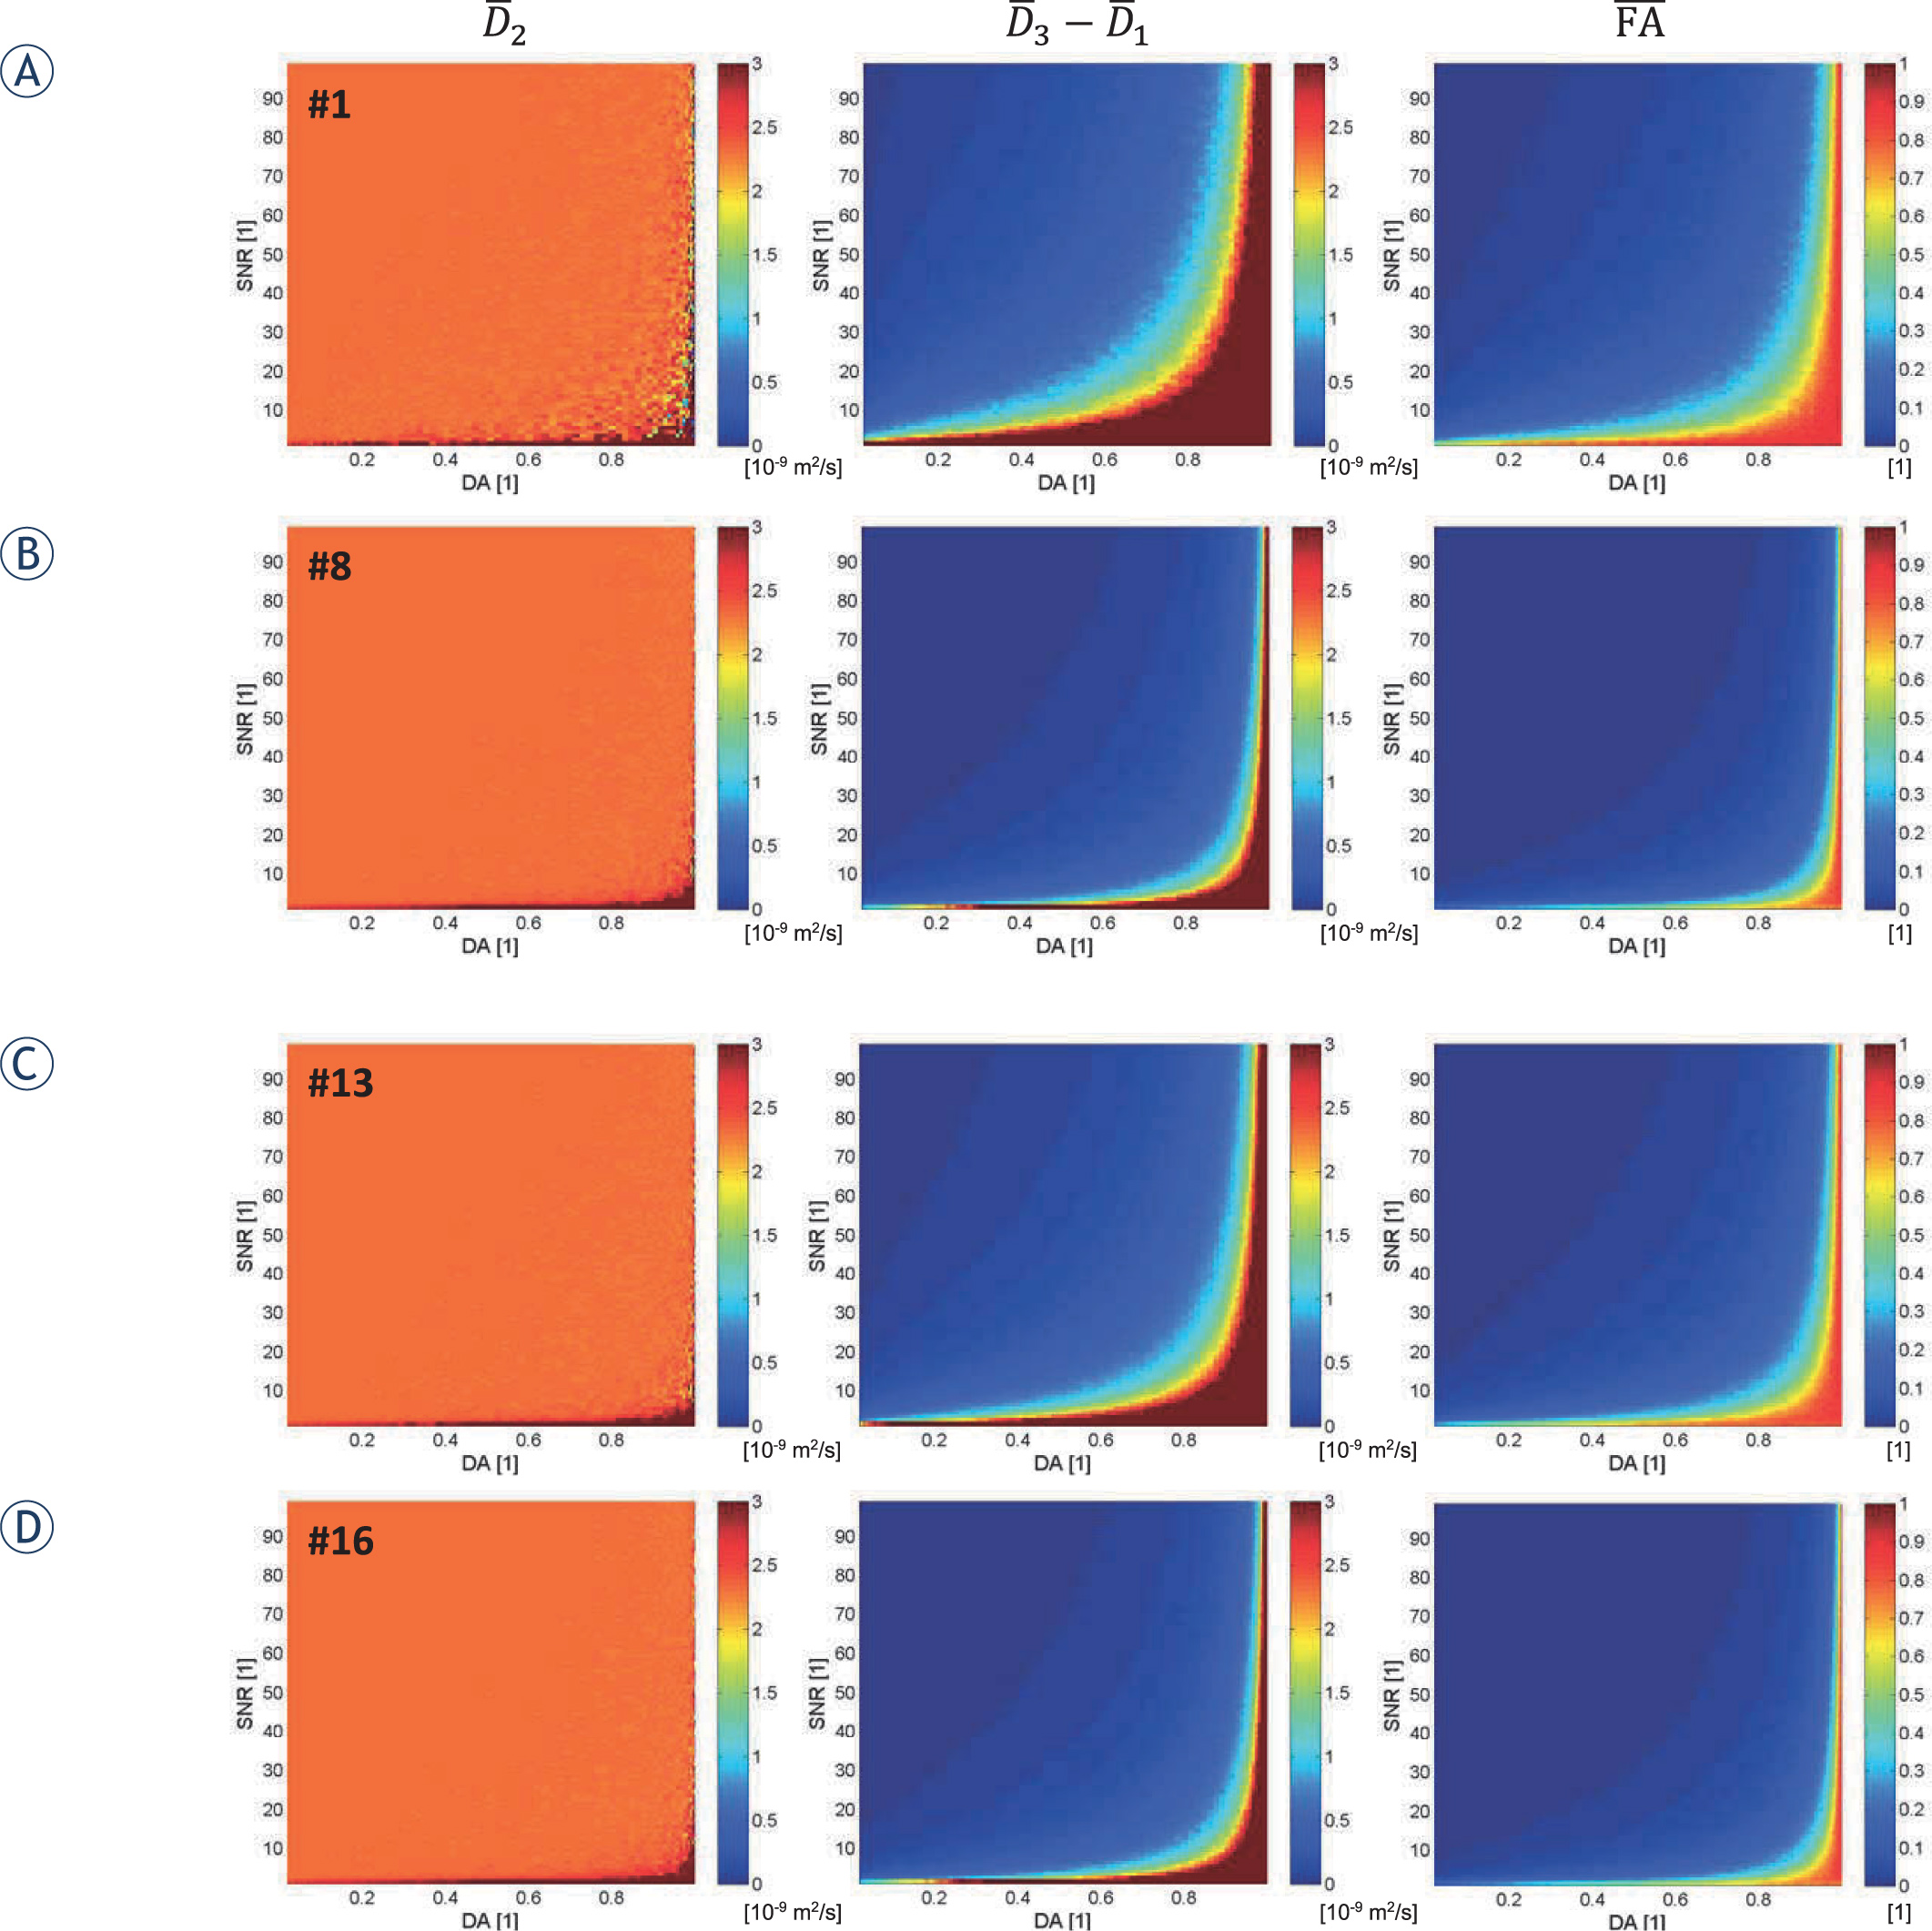
Simulated two dimensional maps of D̅2 (DA signal - to - [SNR]), D̅3 (DA, SNR) - D̅1 (DA, SNR), and fractional anisotropy (FA)(DA, SNR) for four representative, commonly used diffusion sensitizing gradients (DSG) configurations from Table 1 (#1, #8, #13 and #16).
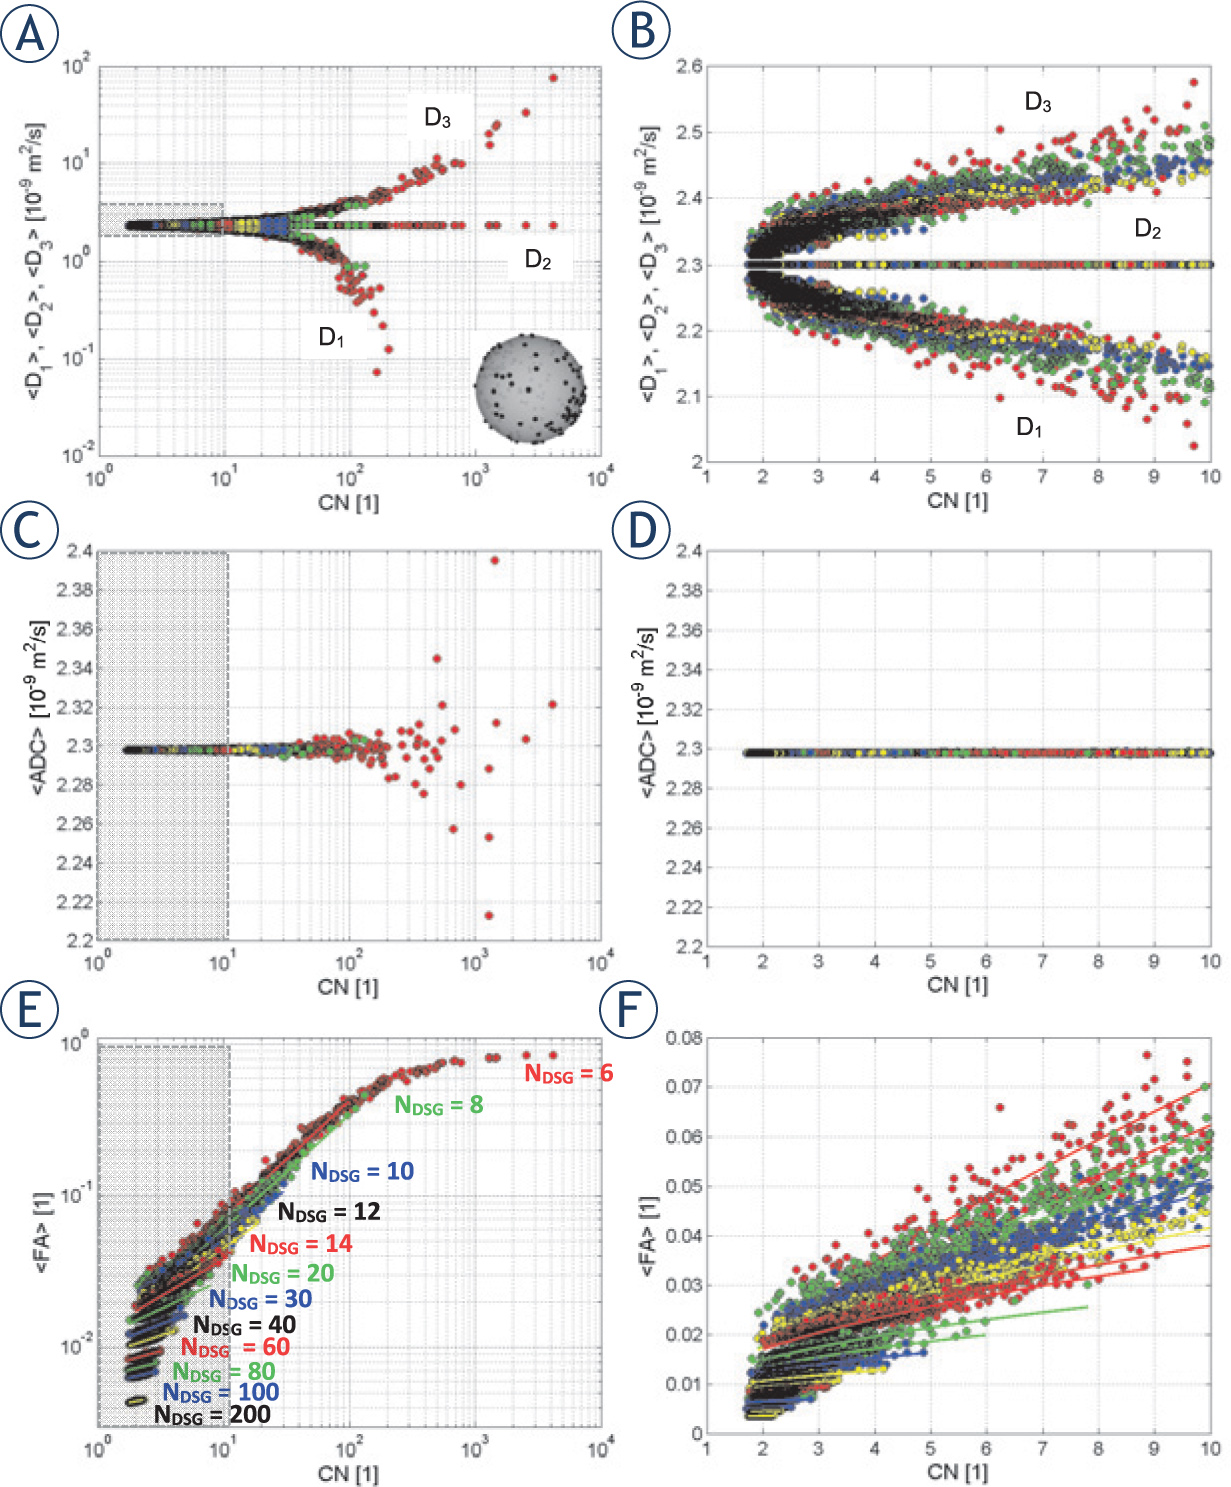
Panels on the left show simulated average values of diffusion tensor eigenvalues D1,D2 and D3 (A), of average diffusion constant ADC(C) and of fractional anisotropy FA(E) as a function of condition number 1<CN<104 for random diffusion sensitizing gradients (DSG) configurations. Panels on the right (B,D,F) display the zoomed left-side panels for condition numbers in the range 1<CN<10. Solid-line curves (E,F) correspond to best fits of the model function [Eq. 12] to the simulated data. The graphical insert in panel (A) illustrates the selected random DSG configuration with NDSG = 220.
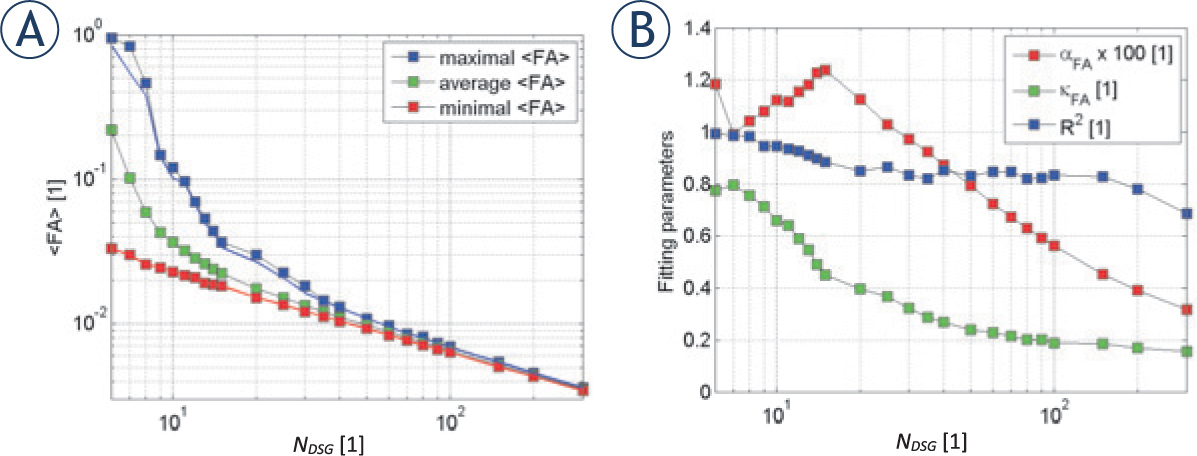
Characteristic values of the simulated correlations between FA and condition number(CN)for random diffusion sensitizing gradients (DSG) configurations as a function of NDSG: maximal, average and minimal values of FA (A), best fit parameters αFA, κFA and fit quality R2(B). The arrow designates a crossover, at which apparent fractional anisotropy drops below fractional anisotropy FA ~0.01. The graphical insert in panel A illustrates the selected random DSG configuration with NDSG = 220.
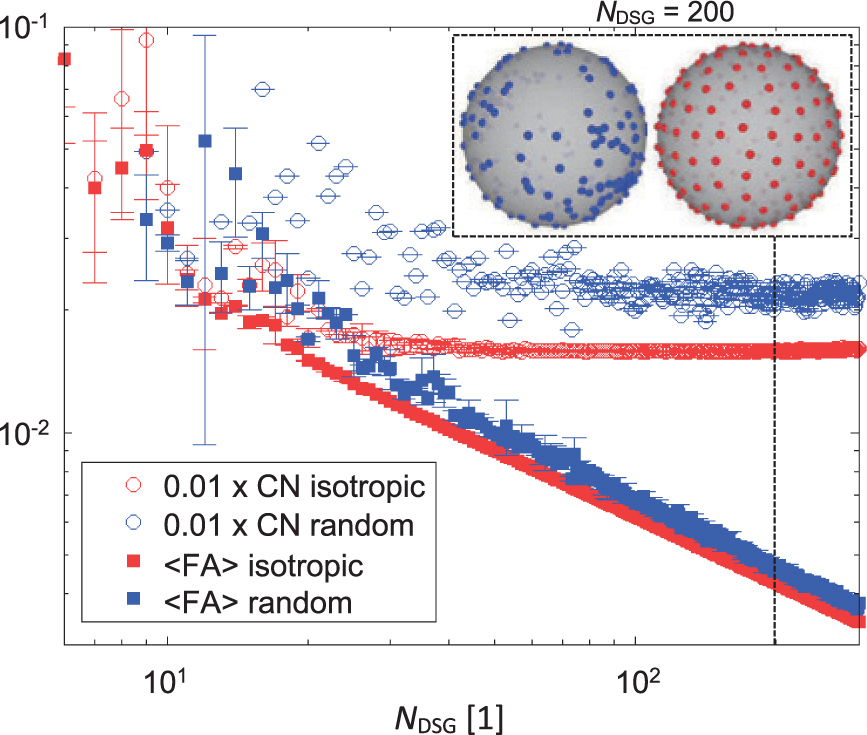
Simulated average fractional anisotropy FA (solid symbols) and the corresponding condition number CN(void symbols) as a function of NDSG for random (blue symbols) and isotropic (red symbols) diffusion sensitizing gradients (DSG) configurations. The graphical insert illustrates a distribution of DSG directions in a random and an isotropic DSG configuration with NDSG = 200.
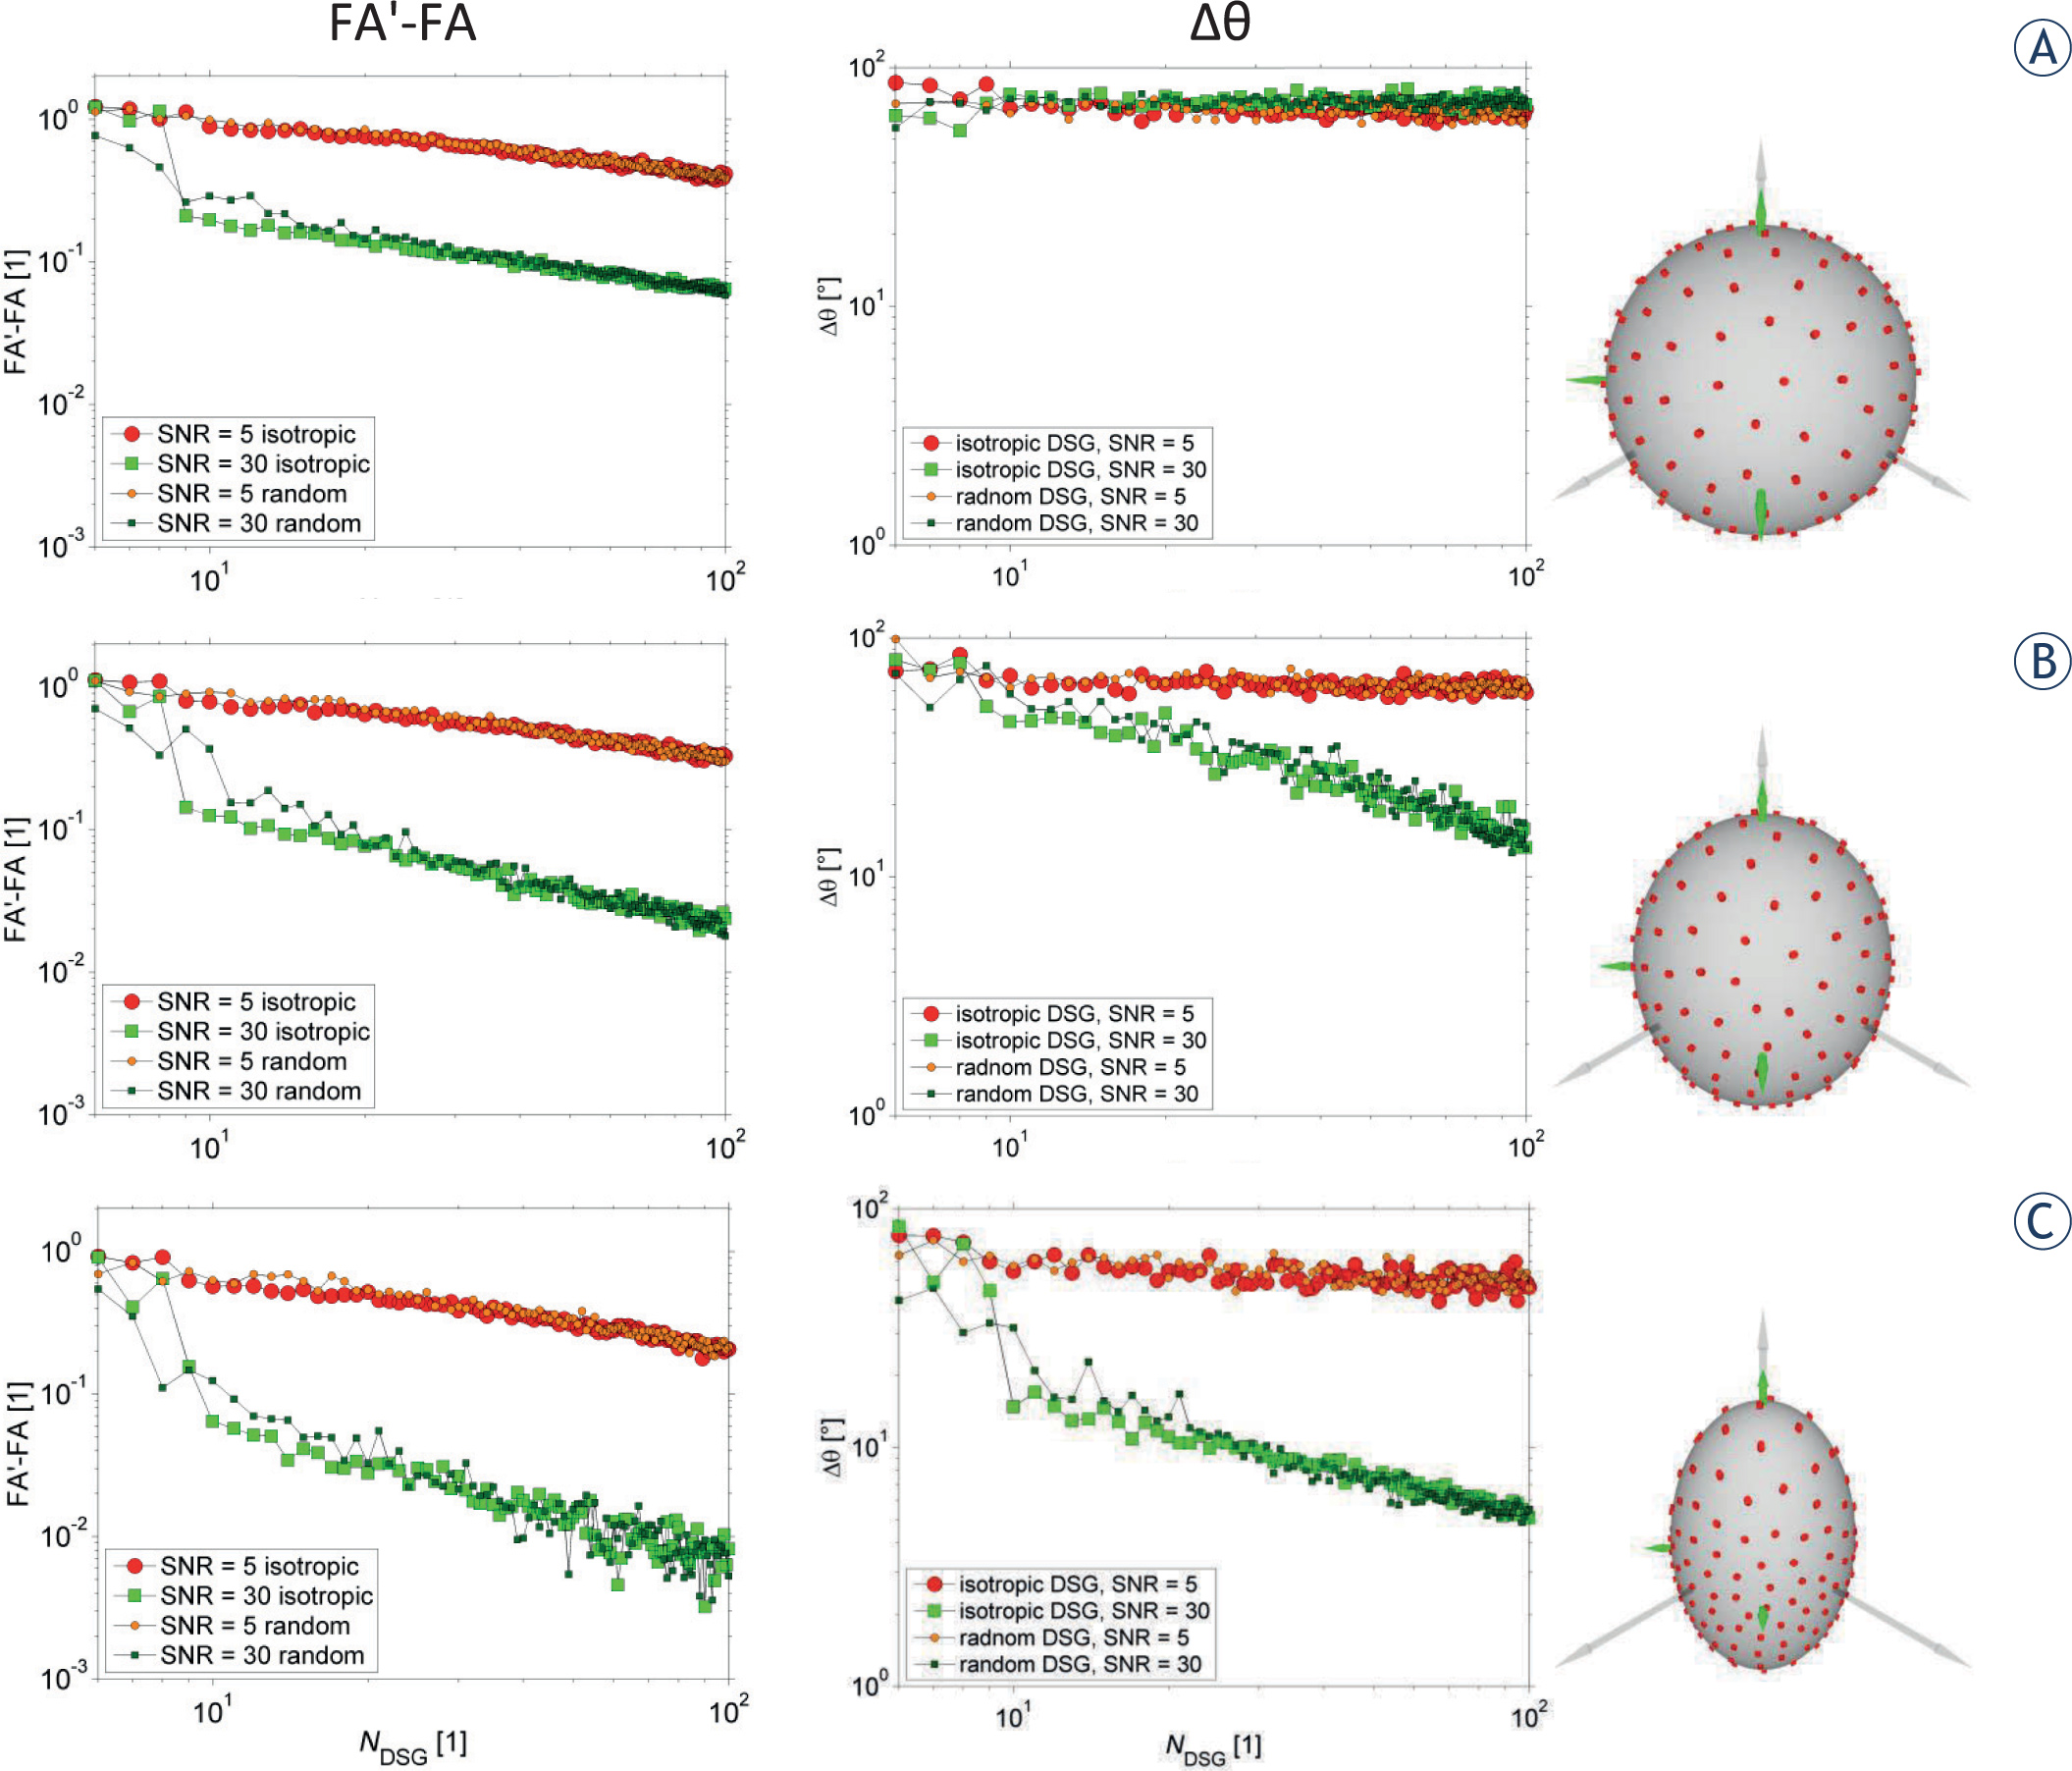
The results of numerical simulations with three different fractional anisotropy (FA) values: 0, 0.1, and 0.3 for isotropic (FA = 0) vs. anisotropic (FA = 0.1, 0.3) case.
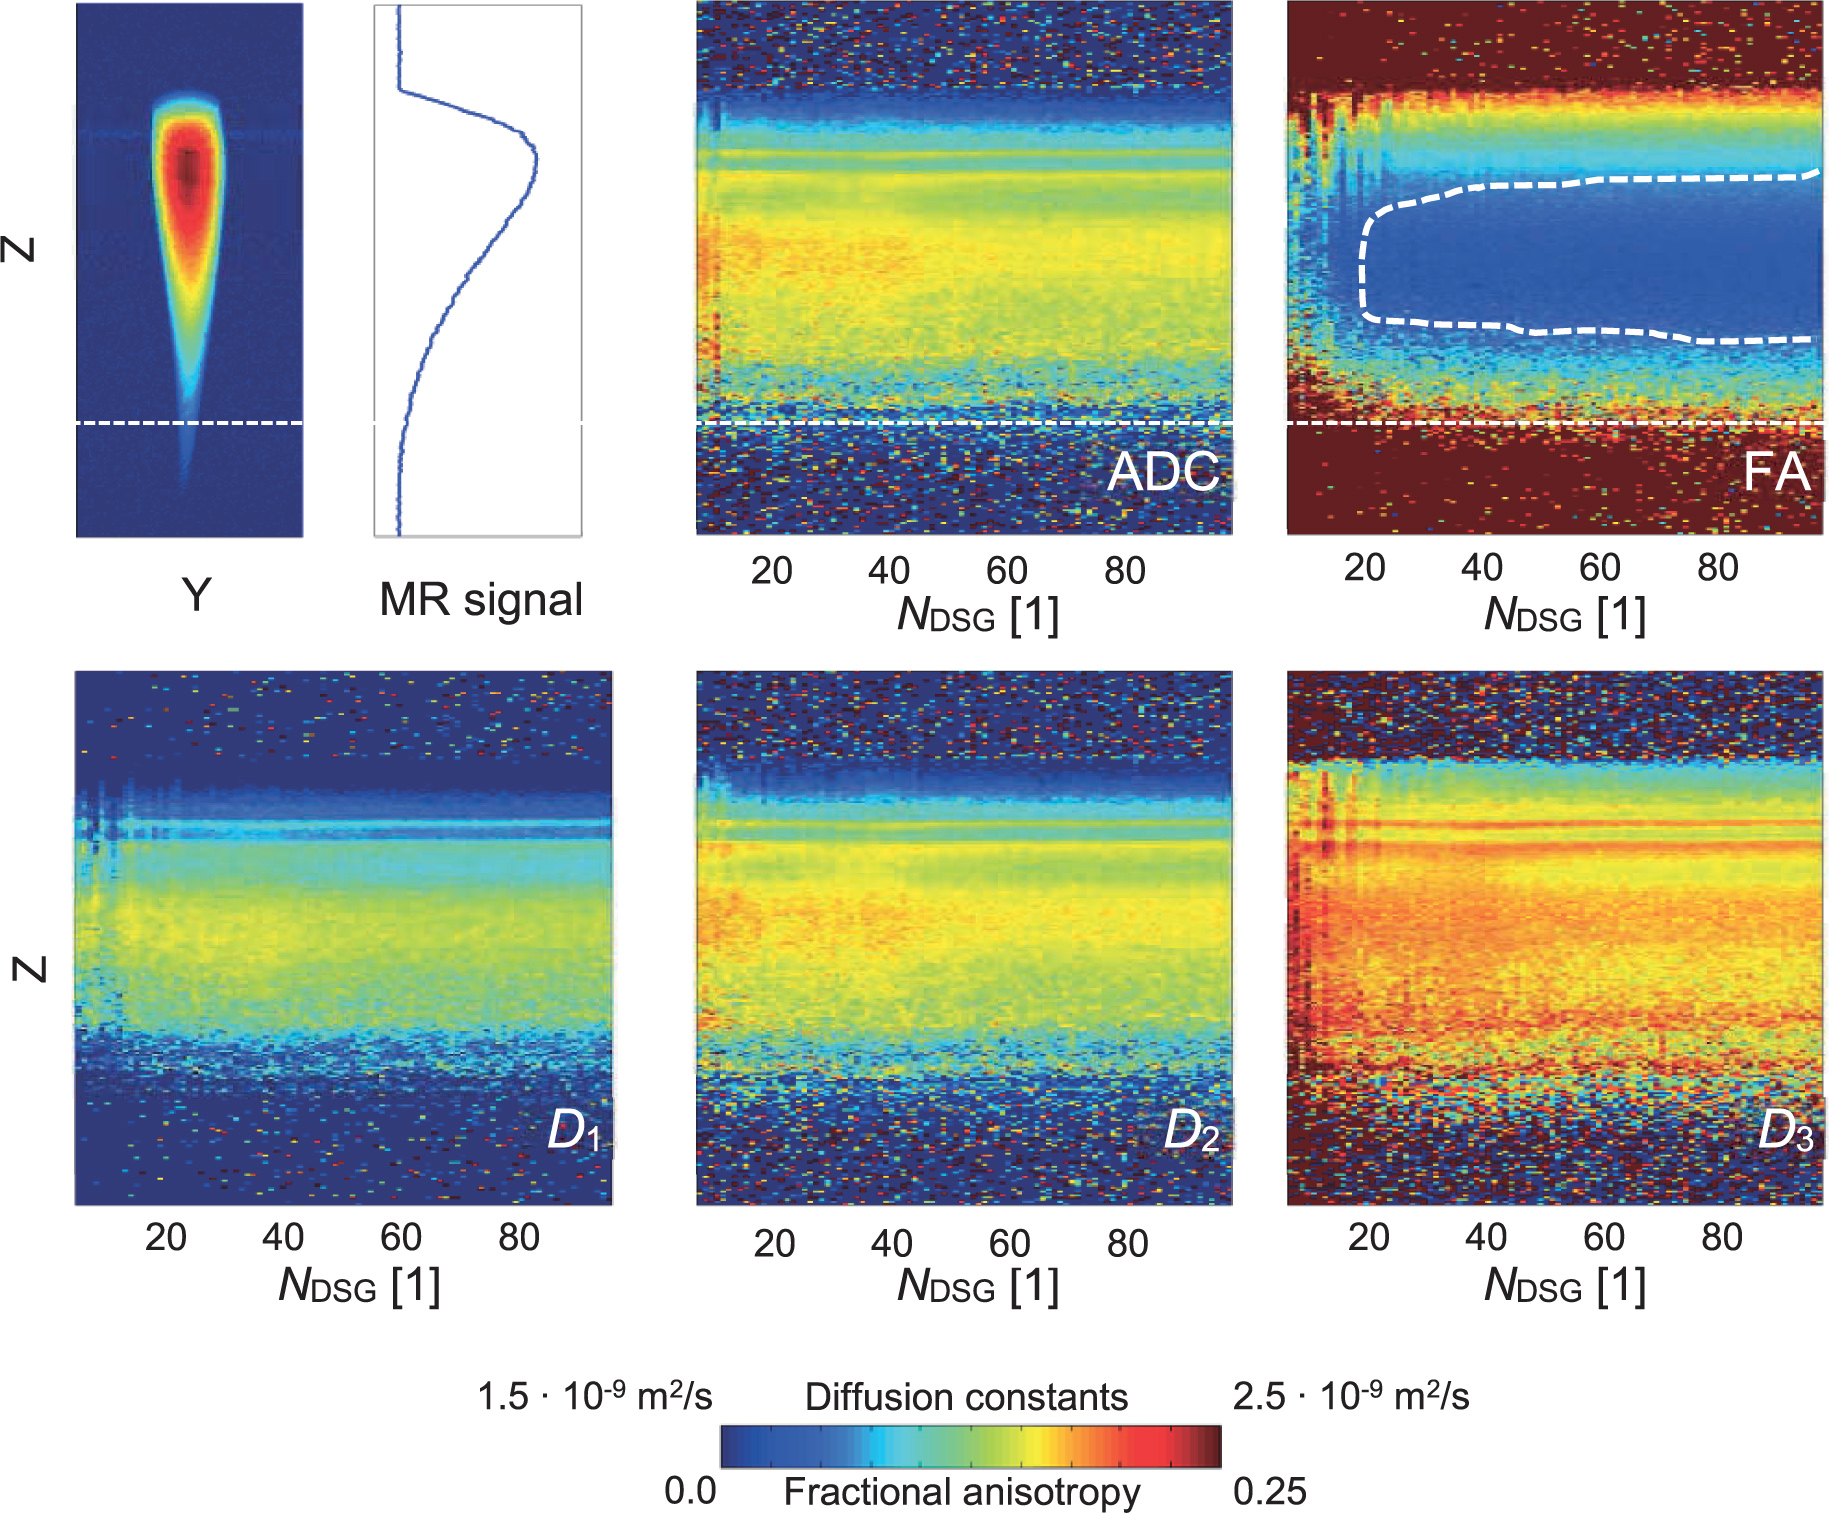
Experimental 1D DT-MRM results of the cone-shaped water phantom: 2D MR image of the phantom with the corresponding signal-to-noise ratio (SNR) 1D profile along the phantom axis (top left) and stack plots of the diffusion tensor quantities (D1, D2, D3, average diffusion coefficient [ADC] and FA) as 1D profiles as a function of NDSG. Isotropic diffusion sensitizing gradients (DSG) configurations were used. The white dotted curve depicts the region with noticeably reduced fractional anisotropy.
Table 2
Average values of average diffusion coefficient (ADC) and fractional anisotropy (FA) in three different regions of an uncompressed and compressed cartilage sample obtained with two different spatial resolutions
| Higher resolution (78 μm) | Lower resolution (156 μm) | |||
|---|---|---|---|---|
| ADC [10−9 m2/s] | FA[1] | ADC [10−9 m2/s] | FA[1] | |
| Uncompressed cartilage | 0.99±0.13 | 0.27±0.13 | 1.12±0.14 | 0.14±0.08 |
| Compression zone | 0.63±0.42 | 0.87±0.27 | 1.01±0.82 | 0.82±0.23 |
| Liquid droplet | 1.35±0.11 | 0.24±0.06 | 1.34±0.19 | 0.11±0.04 |
ADC = average diffusion coefficient; FA = fractional anisotropy
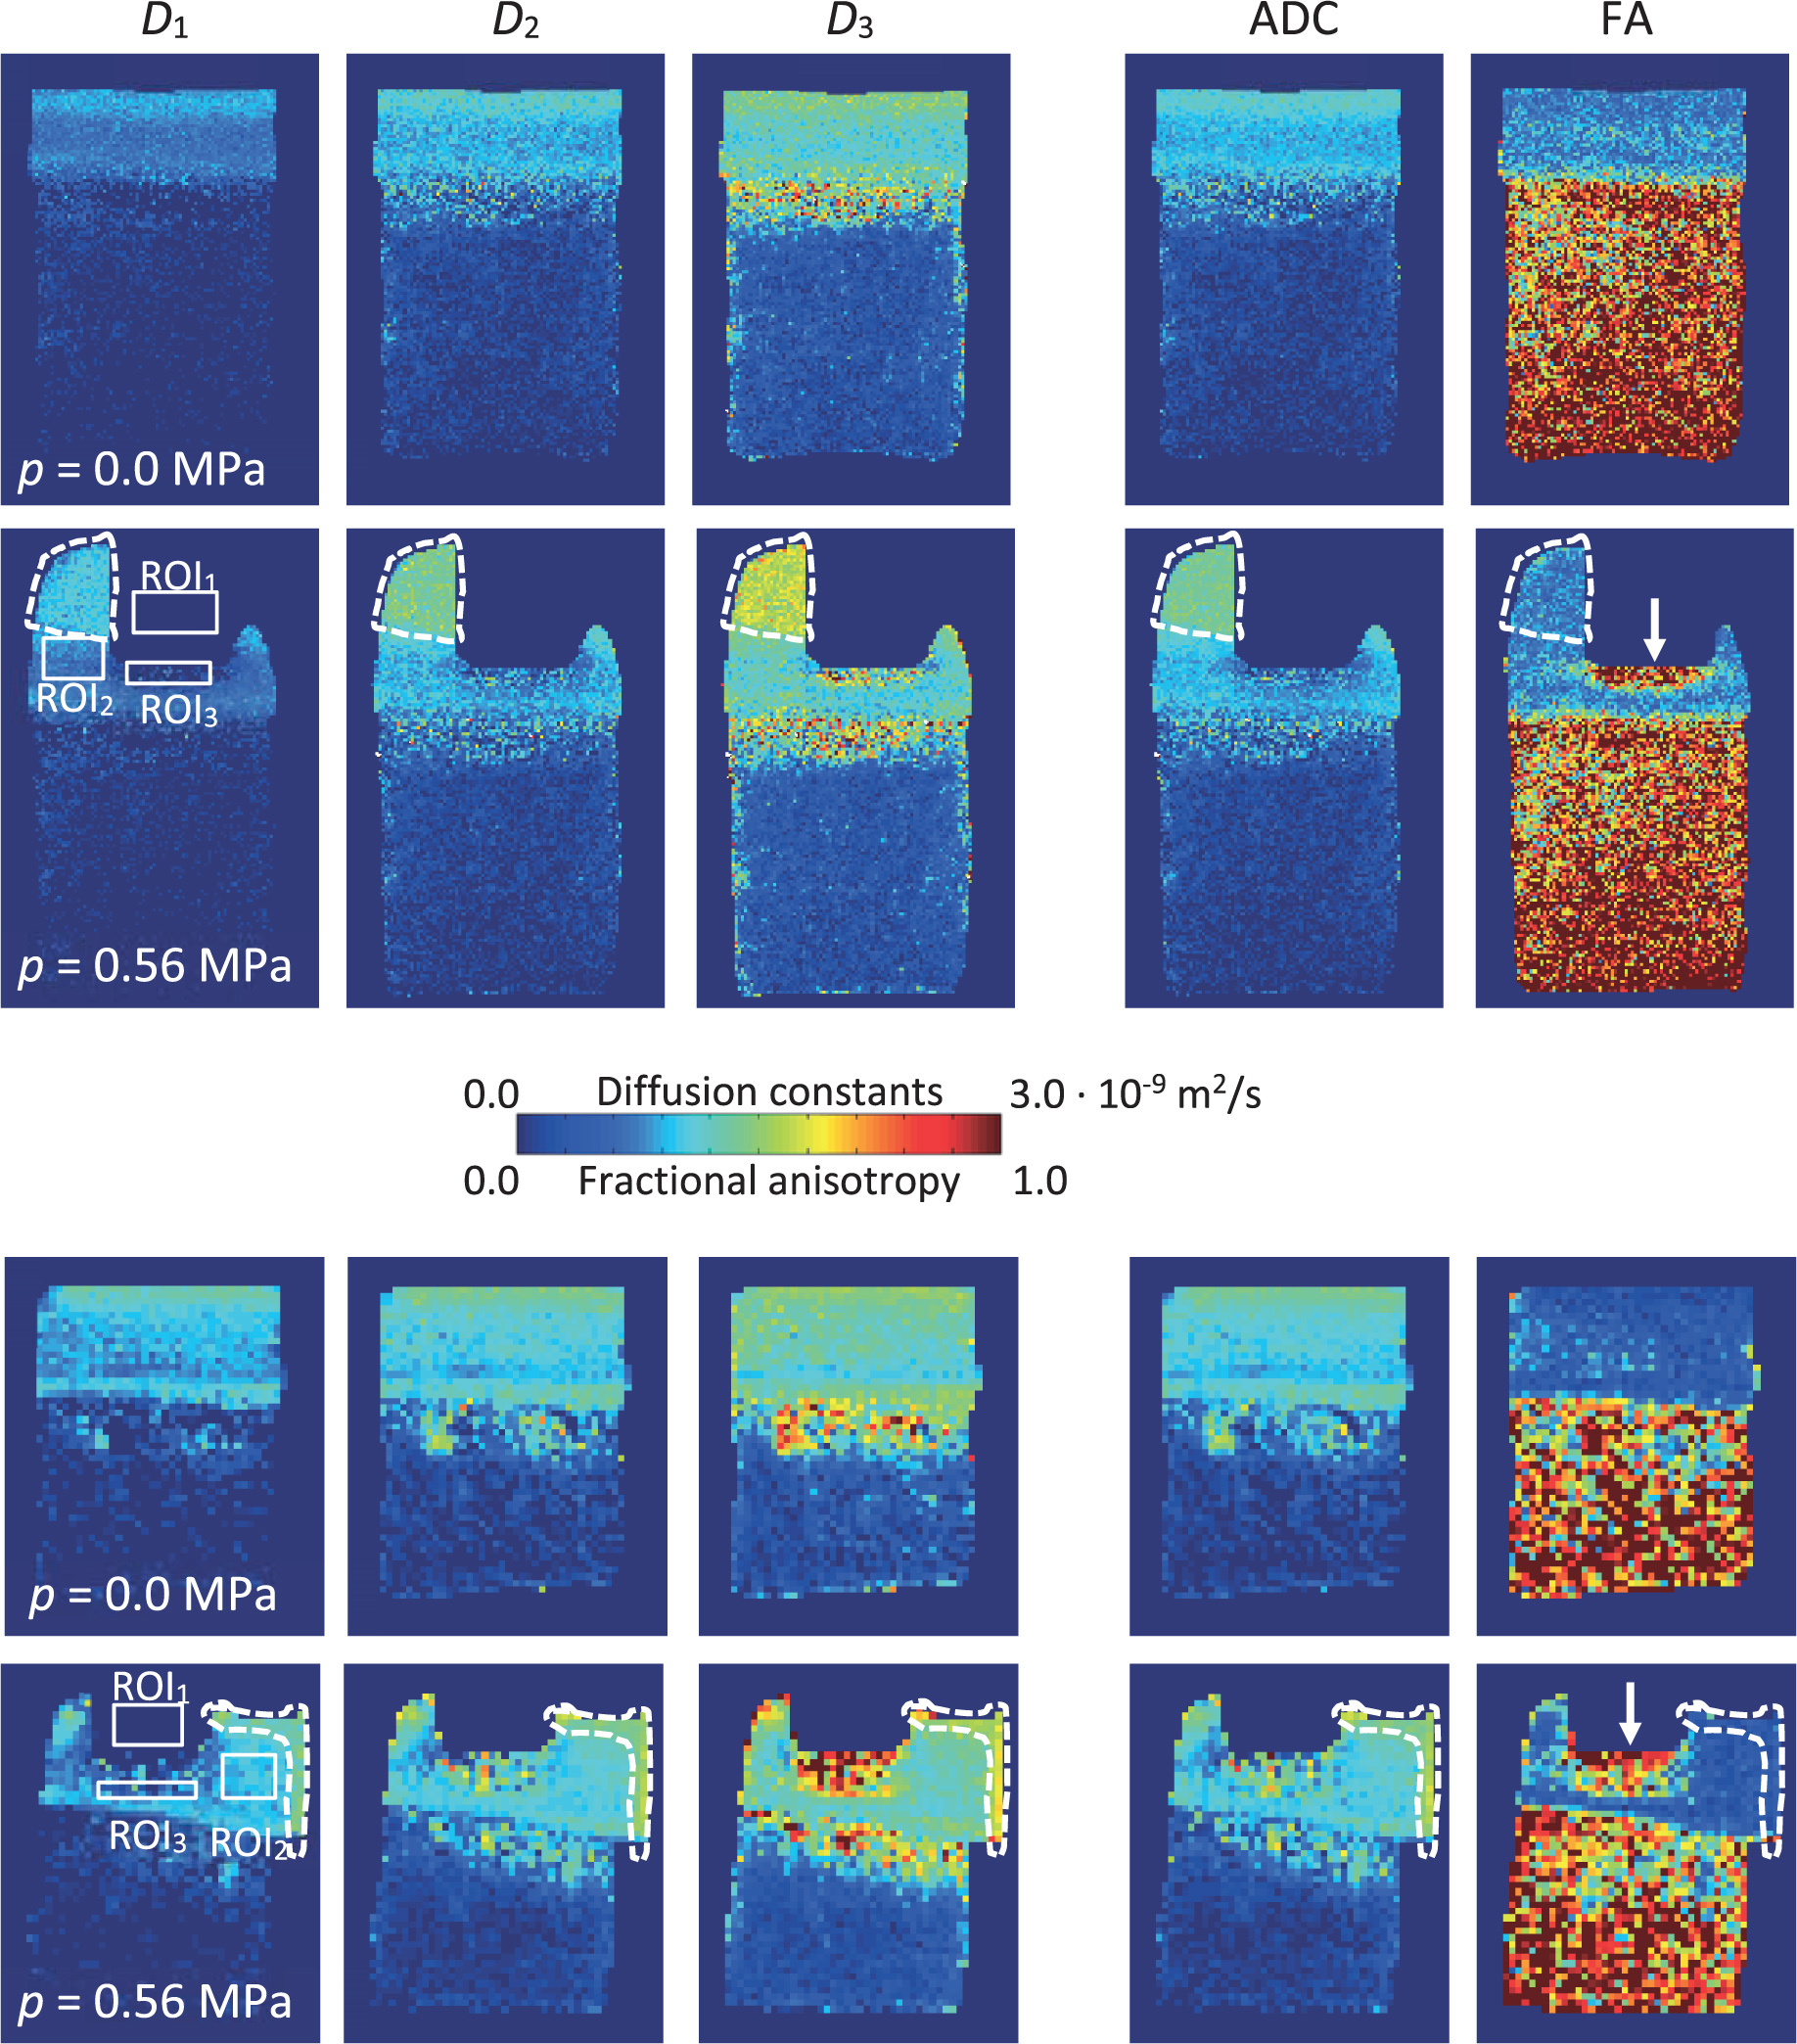
Experimental DT-MRM results of articular cartilage-on-bone samples in a form of 2D maps of D1, D2, D3, average diffusion coefficient (ADC) and fractional anisotropy (FA). The maps were obtained with a spatial resolution of either 78 μm (A) or 156 μm (B). Solid white boxes indicate three different ROI regions for signal-to-noise ratio (SNR) determination, while dashed white lines encircle droplets of liquid expelled from the cartilage tissue. White arrows denote the compression zone.