
Table 1.
Volumetric modulated arc therapy (VMAT) plan parameters (dose, gantry speed, Leaf travel and modulation complexity score [LTMCS] and arcs), ranges of the maximal leaf speed, multi-leaf collimator (MLC) leaf position changes along 178 control points (CPs), and total modified leaves percentage of each VMAT arc
| Caseaa | Dose Prescription (Gy/fx × fx) | Gantry speed (deg/s) | LTMCSbb | Arc | Maximal MLC leaf speed range along 178 CPs (cm/s) | Range of Leaf Position Changes along 178 CPs (mm) | Total Modified MLC leaves % |
|---|---|---|---|---|---|---|---|
| P1 | 2.0 × 33 | 4.8 | 0.164 | 1 | 1.87-1.92 | −1.90-1.88 | 1.5 |
| P2 | 2.0 × 33 | 4.8 | 0.262 | 1 | 1.87-1.90 | −1.90-2.00 | 1.6 |
| 2 | 1.87-1.90 | −1.90-2.00 | 1.6 | ||||
| P3 | 2.0 × 33 | 4.8 | 0.163 | 1 | 1.87-1.90 | −1.90-2.00 | 1.5 |
| 2 | 1.87-1.90 | −1.90-2.00 | 1.6 | ||||
| B1 | 1.8 × 33 | 4.8 | 0.204 | 1 | 1.87-1.92 | −1.88-1.90 | 1.6 |
| B2 | 1.8 × 33 | 4.8 | 0.199 | 1 | 1.87-1.92 | −1.88-1.90 | 1.5 |
| 2 | 1.87-1.92 | −1.88-1.90 | 1.7 | ||||
| B3 | 1.8 × 33 | 4.8 | 0.217 | 1 | 1.85-1.90 | −1.88-2.00 | 1.5 |
| 2 | 1.85-1.90 | −1.88-2.00 | 1.6 | ||||
| A1 | 1.8 × 33 | 4.8 | 0.081 | 1 | 1.90-1.92 | −1.80-1.80 | 1.7 |
| 2 | 1.90-1.92 | −1.80-1.80 | 1.7 | ||||
| 3 | 1.90-1.92 | −1.80-1.80 | 1.7 | ||||
| 4 | 1.90-1.92 | −1.80-1.80 | 1.8 | ||||
| A2 | 1.8 × 33 | 4.8 | 0.083 | 1 | 1.92-1.95 | −1.87-1.87 | 1.5 |
| 2 | 1.92-1.95 | −1.87-1.87 | 1.6 | ||||
| 3 | 1.92-1.95 | −1.87-1.87 | 1.6 | ||||
| 4 | 1.92-1.95 | −1.87-1.87 | 1.5 | ||||
| A3 | 1.8 × 33 | 4.8 | 0.105 | 1 | 1.92-1.95 | −1.87-1.87 | 1.7 |
| 2 | 1.92-1.95 | −1.87-1.87 | 1.7 | ||||
| 3 | 1.92-1.95 | −1.87-1.87 | 1.7 | ||||
| A4 | 1.8 × 33 | 4.8 | 0.076 | 1 | 1.87-1.90 | −1.80-1.93 | 2.2 |
| 2 | 1.87-1.90 | −1.80-1.93 | 2.2 | ||||
| 3 | 1.87-1.90 | −1.80-1.93 | 2.3 | ||||
| 4 | 1.87-1.90 | −1.80-1.93 | 2.3 | ||||
| A5 | 1.8 × 33 | 4.8 | 0.084 | 1 | 1.90-1.92 | −1.80-1.80 | 1.7 |
| 2 | 1.90-1.92 | −1.80-1.80 | 1.7 | ||||
| 3 | 1.90-1.92 | −1.80-1.80 | 1.8 |
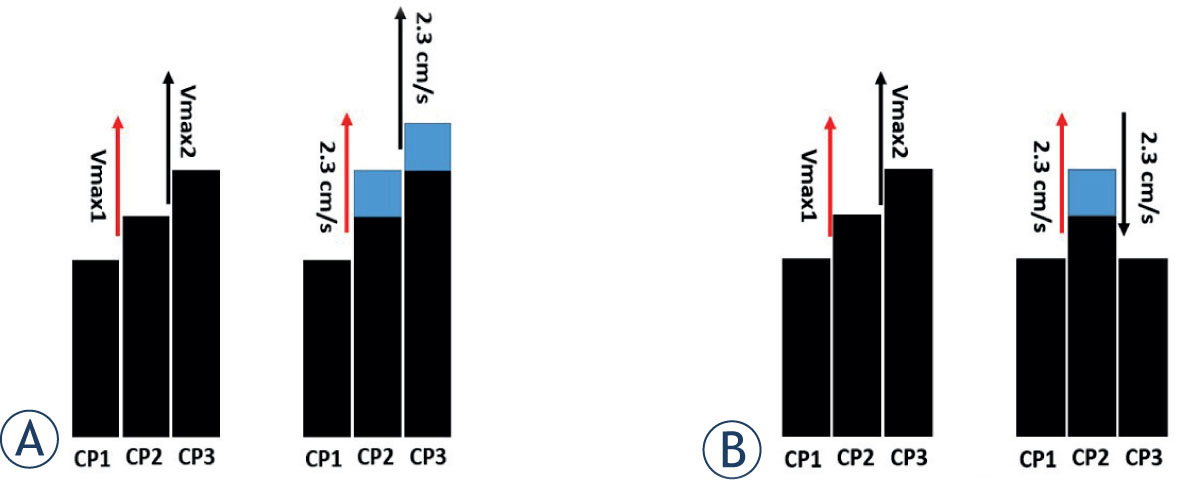
Figure 1.
Illustration of multi-leaf collimator (MLC) leaf position modifications of one leaf when it is moving with the highest speed at two consecutive control points (CPs) (i.e. CP2 and CP3). (A) The leaf is moving in the same direction. (B) The leaf is moving back and forth. Red arrow (Vmaxl or 2.3cm/s) represents leaf speed from CP1 to CP2; Black arrow (Vmax2 or 2.3cm/s) represents leaf speed from CP2 to CP3. Black bars represent original leaf positions. Blue bars represent new leaf positions after modification.
Table 2.
Demonstration of the impact on leaf speed of adjacent control points (CPs) due to leaf modifications
| Scenarioa | LP1 (cm) | LP2 (cm) | LP3 (cm) | LP1-2 Speed (cm/s) | LP 2-3 Speed (cm/s) |
|---|---|---|---|---|---|
| A (ori) | 4.6 | 5.4 | 5.9 | 1.8 | 1.1 |
| A (mod) | 4.6 | 5.6 | 5.9 | 2.3 | 0.7 |
| B (ori) | 4.6 | 5.4 | 4.9 | 1.8 | −1.1 |
| B (mod) | 4.6 | 5.6 | 4.9 | 2.3 | −1.6 |
Scenario B: Leaf moved forward from LP1 to LP2, then moved backward from LP2 to LP3.
In the table, ‘LPn’: leaf position at CP ‘n’ =1,2,3; ‘ori’: original leaf positions; ‘mod’: leaf positions after modification; positive speed: leaf moved forward; negative speed: leaf moved backward. The speed was the distance between LP1,2,3 divided by ∆t =0.435s. For both scenarios A and B, we only modified LP2 from 5.4 to 5.6 to increase LP1-2 speed from 1.8 cm/s to 2.3 cm/s.
Table 3.
Target dose differences between ‘standard’ and ‘slowing multi-leaf collimator (MLC)’ anal volumetric modulated arc therapy (VMAT) plans, total leave states, and average percentages of modified leaves and faster moving leaves of anal cases
| Case | ∆Dmean(Gy)aa | ∆D95(Gy)aa | Total leave states per arc (leaves on both banks/CP)×(CP) | Average modified MLC leaves (%) | Average faster moving leaves (%) |
|---|---|---|---|---|---|
| A1 | −0.8 | −0.2 | 120 × 178 | 1.7 | 56.5 |
| A2 | −0.9 | −0.3 | 120 × 178 | 1.6 | 53.6 |
| A3 | −1.2 | −0.5 | 120 × 178 | 1.7 | 51.3 |
| A4 | −2.2 | −1.0 | 120 × 178 | 2.3 | 69.0 |
| A5 | −1.1 | −0.3 | 120 × 178 | 1.7 | 52.7 |
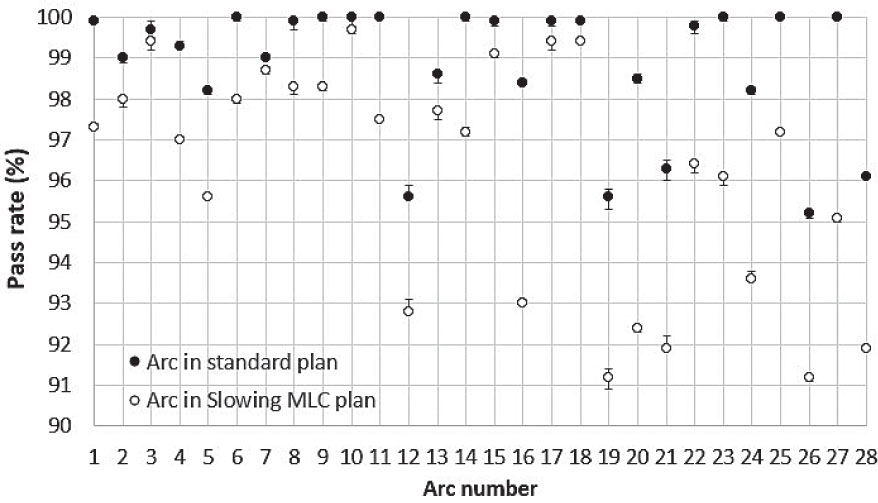
Figure 2.
Variation of pass rates (3%/3mm) of each volumetric modulated arc therapy (VMAT) arc. Solid dots: pass rates of arcs in ‘standard’ plans (PSstandard). Soft dots: pass rates of arcs in ‘slowing multi-leaf collimator (MLC)’ plans (PSslowing MLC). Error bars are pass rates variation based on repeated measurements of each arc on two consecutive days.
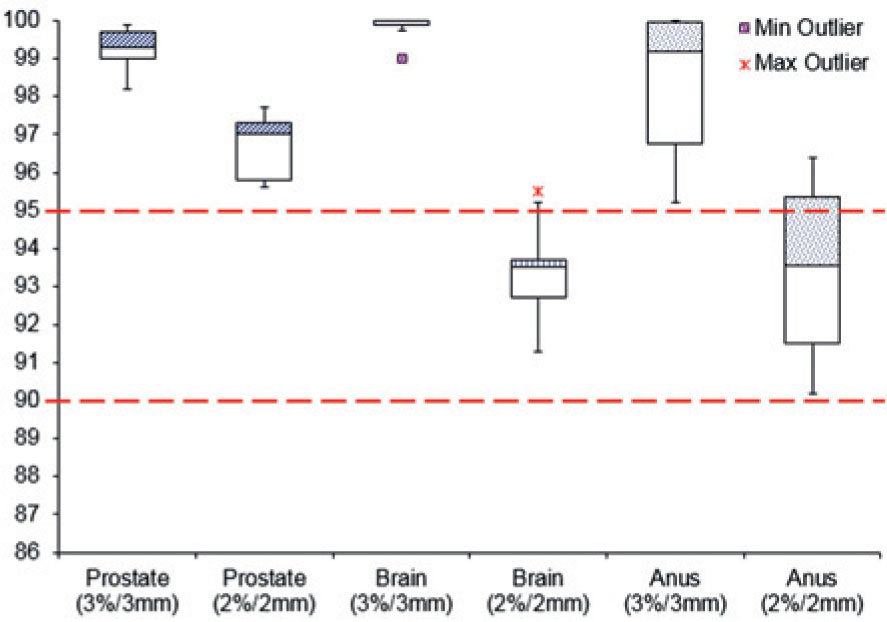
Figure 3.
Pass rates of ‘standard’ volumetric modulated arc therapy (VMAT) plans with respect to absolute dose Van Dyk distance-to-agreement (DTA) comparisons using 3%/ 3 mm and 2%/2 mm criteria.
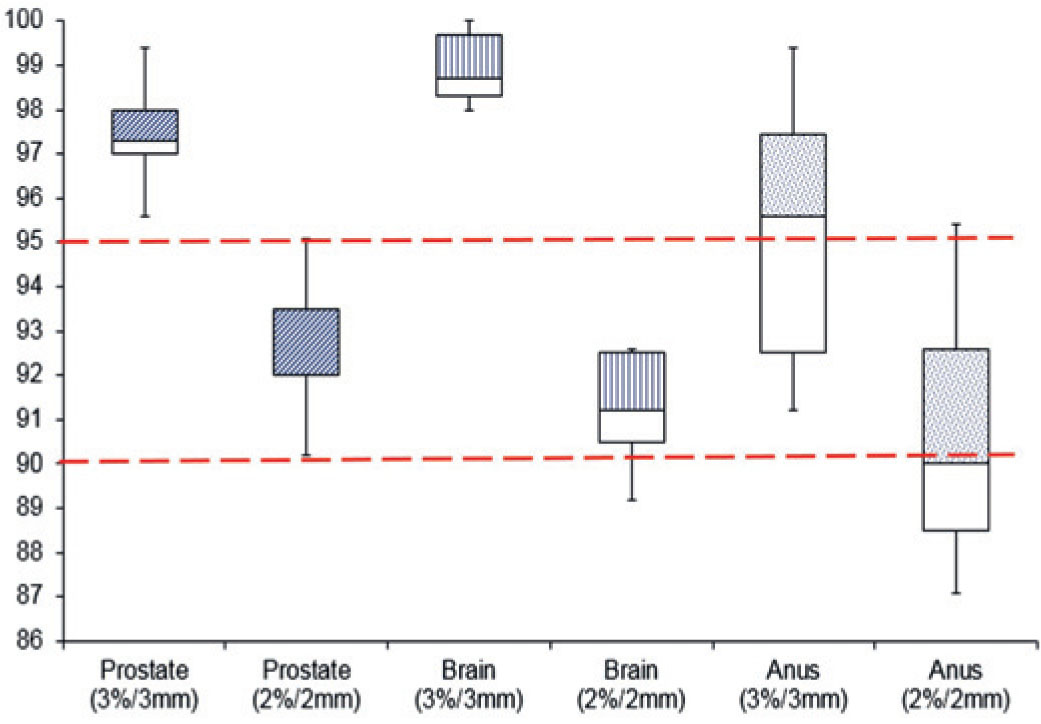
Figure 4.
Pass rates of ‘slowing multi-leaf collimator (MLC)’ volumetric modulated arc therapy (VMAT) plans with respect to absolute dose Van Dyk distance-to-agreement (DTA) comparisons using 3%/ 3 mm and 2%/2 mm criteria.
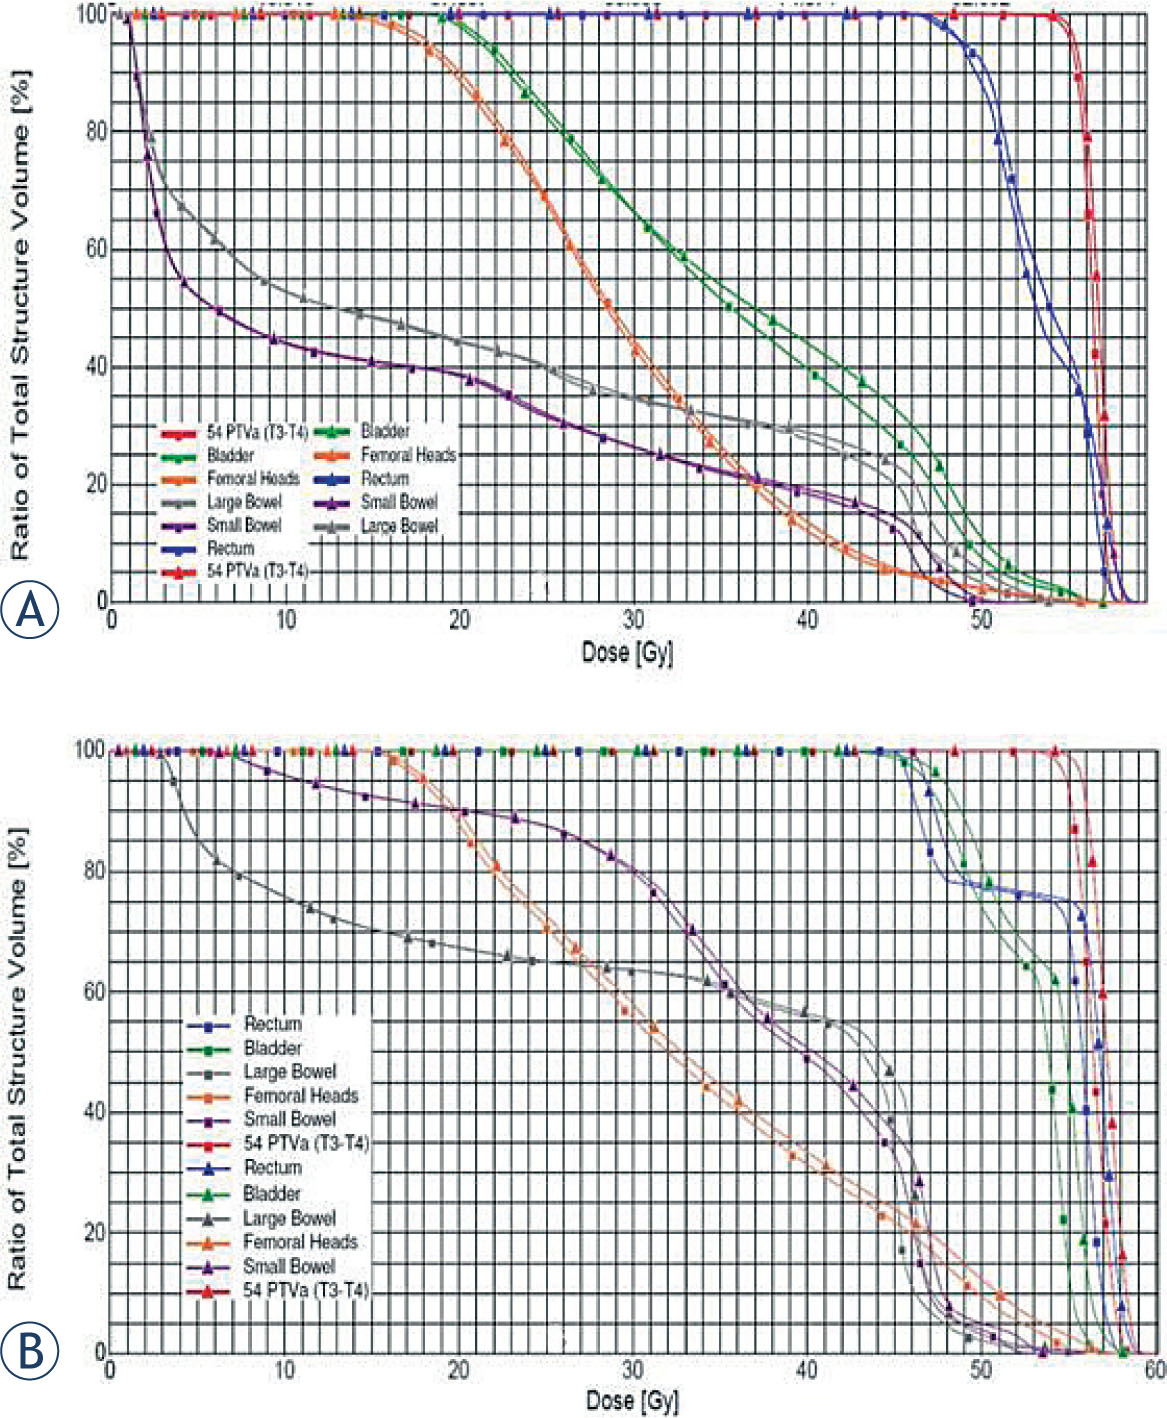
Figure 5 (A)
DVH comparison between ‘standard’ and ‘slowing MLC’ VMAT plans of anal case A3. (B) DVH comparison between ‘standard’ and ‘slowing MLC’ VMAT plans of anal case A4. ▲:’slowing MLC’ plan; ■ :’standard’ plan. Red: PTV; Blue: Rectum; Green: Bladder; Grey: Large bowel; Purple: Small bowel; Orange: Femoral heads
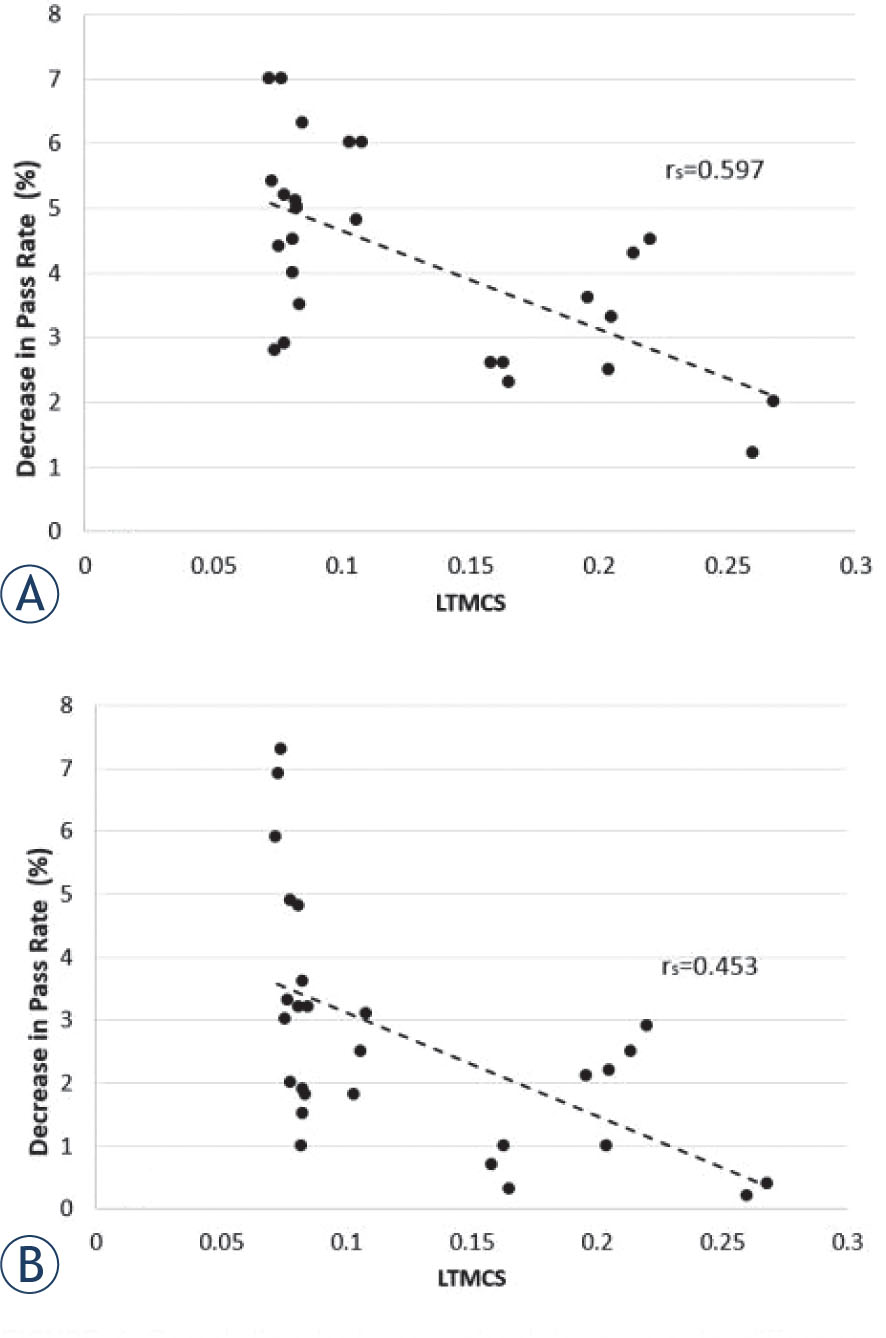
Figure 6
Correlation between absolute pass rate difference (|PSstandard (%) – PSslowng MLC (%)|) of each arc and LTMCS of each arc. (A) LTMCS vs decrease in pass rate (%) using 2%/2mm criteria; (B) LTMCS vs decrease in pass rate (%) using 3%/3mm criteria
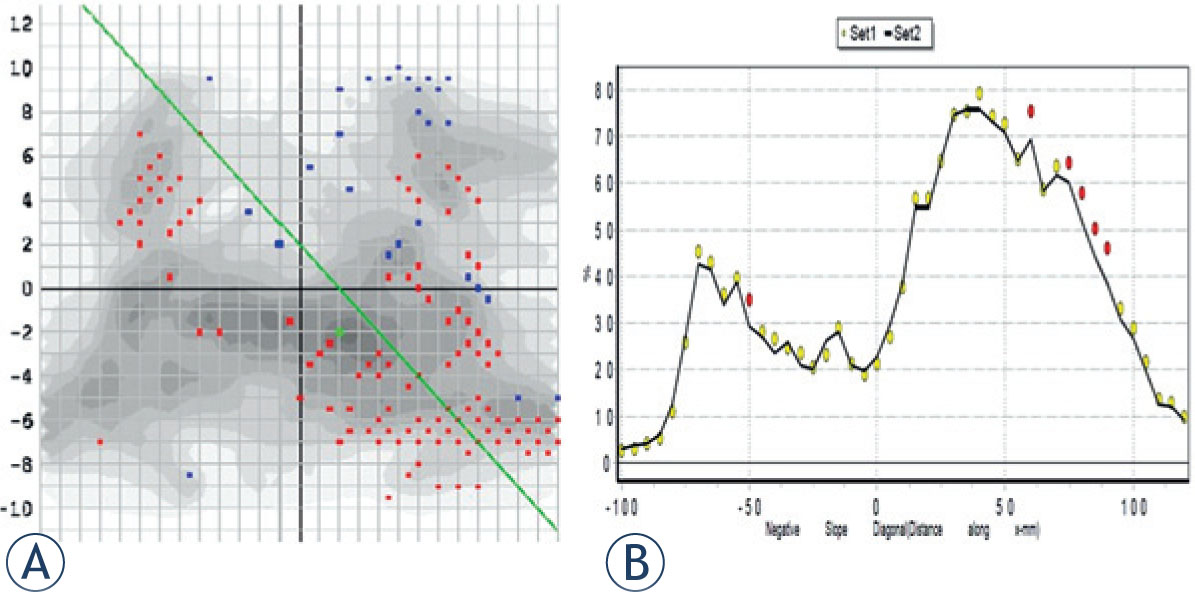
Figure 7
MapCHECK®2 measurements of single arc of case A4. (A) Red dots are MapCHECK®2 measurements of ‘slowing MLC’ plan showing delivered dose is higher than planed dose (‘standard’ plan); (B) Dotted line represents dose profile of ‘slowing MLC’ plan; Black solid line represents dose profile of ‘standard’ plan.