Have a personal or library account? Click to login
Red blood cell transfusion and skeletal muscle tissue oxygenation in anaemic haematologic outpatients Cover

Red blood cell transfusion and skeletal muscle tissue oxygenation in anaemic haematologic outpatients

Open Access
|Nov 2016

Figures & Tables

Schematic presentation of thenar skeletal muscle StO2 before, during and after the vascular occlusion tests. Before the vascular occlusion, the StO2 is measured in the resting period (1, basal StO2). During the vascular occlusion, the StO2 gradually decreases. The rate of this decrease is determined from the curve as the downslope StO2 (2; %/min), as a surrogate of the tissue oxygen consumption. After reaching the predetermined minimum StO2, present here as 40% StO2 (3), the vascular occlusion is released, and the StO2 begins to rise again. The rate of this increase is determined from the curve as the upslope StO2 (4; %/min), as a surrogate marker of the microcirculatory reactivity. After the release of the occlusion, the StO2 increases to higher values compared to the basal StO2 due to post-ischaemic vasodilatation (5, maximum StO2). The StO2 then slowly returns to the basal StO2.
Effects of the age of the RBCs for the transfusions on the basal StO2. (A) Regression/analysis of variance. (B) Roc analysis, interactive dot diagram for optimal effect separation.Prediction line (solid lines); 95% confidence line (dashed lines)
Effects of the age of the RBCs for the transfusions on the upslope StO2. (A) Regression/analysis of variance. (B) ROC analysis, interactive dot diagram for optimal effect separation.Prediction line (solid lines); 95% confidence line (dashed lines
Effects of the age of the RBCs for the transfusions on the maximum StO2. (A) Regression/analysis of variance. (B) ROC analysis, interactive dot diagram for optimal effect separationPrediction line (solid lines); 95% confidence line (dashed lines)

Demographics, laboratory, haemodynamic and skeletal muscle NIRS variables of the patients before the RBC transfusions

CharacteristicAll patients (n = 28)
Demographics
Female [n (%)]13 (46)
Age (years)65 ±12
Laboratory data
Haemoglobin (g/L)77.9 ± 12.4
Haematocrit (%)0.23 ± 0.04
Haemodynamics
Systolic blood pressure (mm Hg)122 ± 19
Diastolic blood pressure (mm Hg)68 ± 10
Heart rate (beats/min)78 ± 17
Thenar skin temperature (°C)35.6 ± 0.6
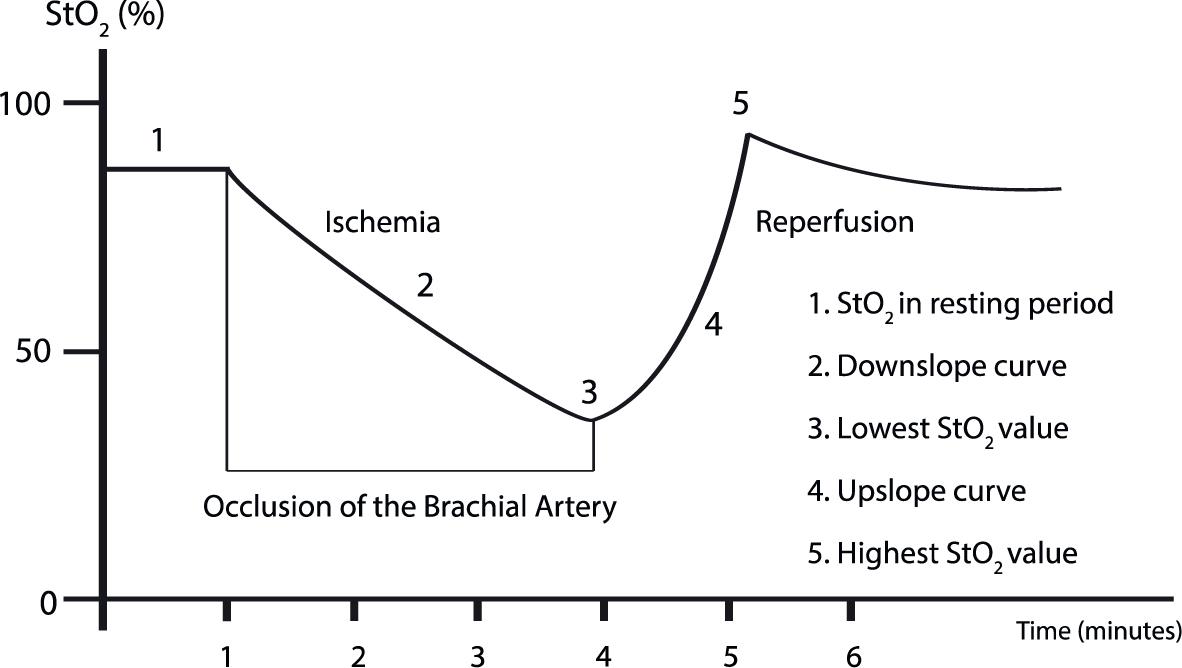
NIRS in resting conditions
Basal StO2, %53 ± 7
Tissue haemoglobin (g/L)1.13 ± 0.14
NIRS: during vascular occlusion test
Downslope StO2 (%/min)-9.4 ± 4.6
Minimum StO2 (%)39 ± 5
Upslope StO2 (%/min)78 ± 51
Maximum StO2 (%)59 ± 10
DOI: https://doi.org/10.1515/raon-2015-0046 | Journal eISSN: 1581-3207 | Journal ISSN: 1318-2099
Language: English
Page range: 449 - 455
Submitted on: Jul 3, 2015
Accepted on: Aug 6, 2015
Published on: Nov 9, 2016
Published by: Association of Radiology and Oncology
In partnership with: Paradigm Publishing Services
Publication frequency: 4 times per year

© 2016 Matej Podbregar, Ana Ursula Gavric, Eva Podbregar, Hugon Mozina, Sebastian Stefanovic, published by Association of Radiology and Oncology
This work is licensed under the Creative Commons Attribution-NonCommercial-NoDerivatives 3.0 License.