
Demographics, standard prognostic factors and treatment for long-term survivor (LTS) group and control group
| Variable | LTS group | Control group | |
|---|---|---|---|
| Mean age (range) | 47,5 (21–74) | 49, 6 (23–74) | |
| Gender | Male | 24 | 31 |
| Female | 16 | 9 | |
| Surgery | Gross total | 22 | 23 |
| Reduction | 15 | 15 | |
| Biopsy | 3 | 2 | |
| WHO PS | 0 | 9 | 5 |
| 1 | 25 | 26 | |
| 2 | 4 | 9 | |
| 3 | 2 | 0 | |
| Mean RT dose (Gy) | 58 | 57,9 | |
| RT technique | 1D | 1 | 0 |
| 2D | 3 | 3 | |
| 3D | 36 | 37 | |
| No. of fractions | 25–33 | 25–33 | |
| Chemotherapy | Yes | 37 | 39 |
| Adjuvant only | 3 | 1 |
Molecular and genetic markers
| LTS group | Control group | P value | |
|---|---|---|---|
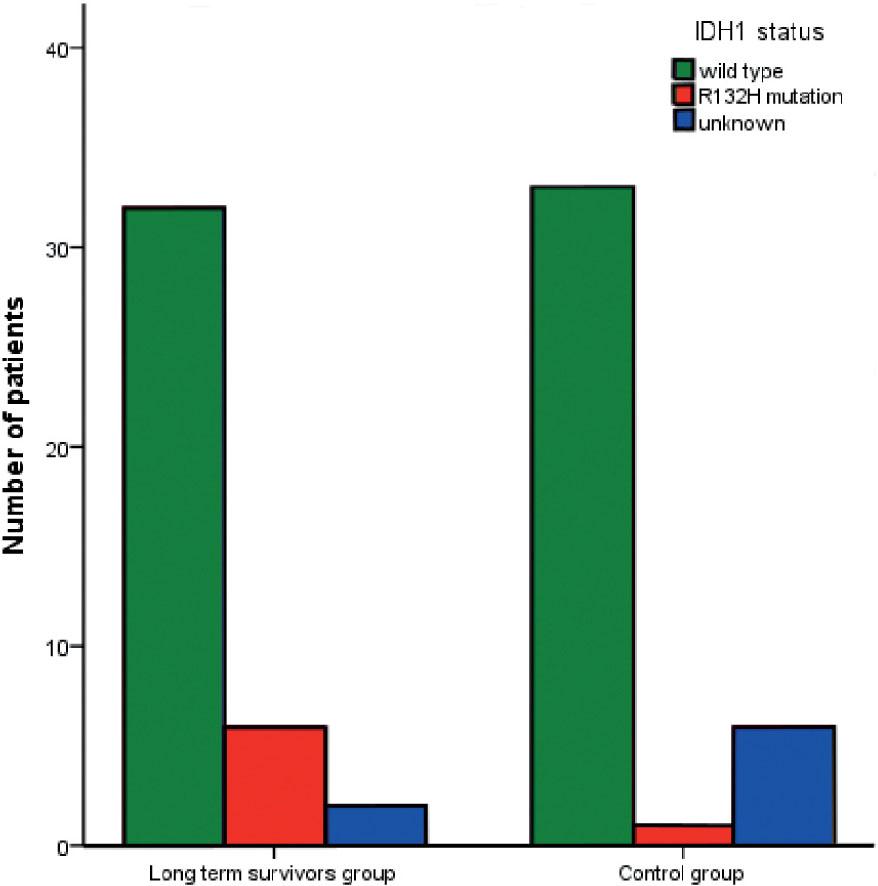
| IDH1 | 6/40 | 1/34 | 0.043 |
| IDH1 (genetic) | 6/38 | 1/33 | 0.043 |
| IDH2 (genetic) | 0/38 | 0/33 | n.s. |
| 1p/19q | 0/38 | 1/34 | n.s. |
| 1p | 3/38 | 1/34 | n.s. |
| 19q | 10/38 | 6/34 | n.s. |
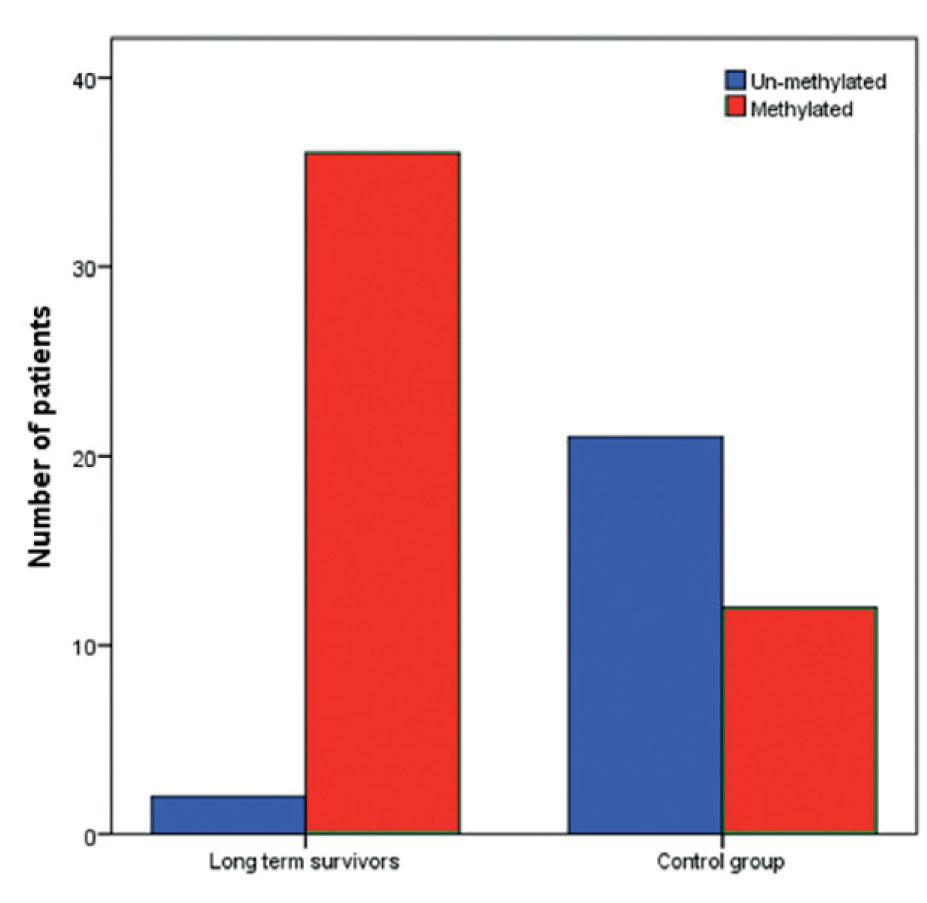
| MGMT methylation | 36/38 | 12/33 | < 0.001 |
| CDKN2A (deletion) | 29/39 | 25/34 | n.s. |
| CDKN2B (deletion) | 27/39 | 24/34 | n.s. |
Response to primary treatment
| LTS group | Control group | P value | |
|---|---|---|---|
| Complete response * Includes patients reported by surgeon as gross total resection; LTS = long term survivor | 24 | 4 | < 0.001 |
| Partial response | 5 | 2 | n.s. |
| Stable disease | 4 | 13 | 0.013 |
| Progression | 7 | 20 | 0.002 |
| Overall response | 31/40 | 19/40 | < 0.001 |
| Non evaluable | 0 | 1 |