
Table 1
Selected clinical characteristics and preoperative data in patients undergoing pancreaticoduodenectomy with or without vein resection (VR). There is no statistically important differences between both groups
| Variable | Without VR (n = 111) | With VR (n = 22) | P-value test |
|---|---|---|---|
| Demographics | |||
| Age (average years) | 65.6 ± 7.7 | 63.95 ± 9.5 | P = 0.45; t test |
| Sex (male:female) | 53:58 | 9:13 | P = 0.64; Chi square |
| ASA score | |||
| 1 | 34 | 7 | |
| 2 | 61 | 12 | |
| 3 | 16 | 2 | |
| 4 | 0 | 0 | P = 0.83; Chi square |
| Bilirubin level | |||
| Below 100mmol/l | 77 | 18 | |
| Above 100mmol/l | 34 | 4 | P = 0.306; Chi square |
| CEA (ng/l) | |||
| Increased (> 5ng/l) | 30 | 5 | P = 0.795; Chi square |
| CA 19-9 (IU/l) | |||
| Increased (> 30IU/l) | 78 | 16 | P = 1.0; Chi square |
ASA = American Society of Anesthesiologists; CA 19-9 = carbohydrate antigen 19-9 ; CEA = carcinoembryonic antigen
Table 2
TNM stage in 111 patients who underwent pancreaticoduodenectomy without vein resection in comparison with vein resection (VR) group. There is no statistically important difference in N0 and N1 stage between both groups (P = 0.432, Fischer’s exact test, no statistical significance).
| TNM stage | Without VR (n = 111) | With VR (n = 22) |
|---|---|---|
| T0 | 0 | 0 |
| T1 | 10 | 0 |
| T2 | 26 | 0 |
| T3 | 75 | 22 |
| T4 | 0 | 0 |
| N0 | 32 | 4 |
| N1 | 79 | 18 |
Table 3
List of surgical complications developed after pancreatoduodenectomy. Comparison between group without vein resection (PD [pacreaticoduodenectomy] - VR [vein resection]) and group with vein resection (PD + VR)
| Type of surgical complication | Without VR (n = 111) | With VR (n = 22) |
|---|---|---|
| Pancreatic fistula | 5 (4.5%) | 1 (4.5%) |
| Bile leak | 3 (2.7%) | 1 (4.5%) |
| Intraperitoneal bleeding | 6 (5.4%) | 0 |
| Abdominal abscess | 5 (4.5%) | 0 |
| Gastric emptying syndrome | 1 (0.9%) | 1 (4.5%) |
| Rupture of the laparatomy | 4 (3.6%) | 0 |
| Necrosing pancreatitis | 1 (0.9%) | 0 |
| Ileus of Roux-Y | 1 (0.9%) | 0 |
| Critical ischemia of the colon | 1 (0.9%) | 0 |
| Poral vein thrombosis | 0 | 1 (4.5%) |
| 60 day mortality | 5 (4.5%) | 1 (4.5%) |
Table 4
Resection margins of extirpated tumors. There is no statistically important difference bewteen both groups (with or without venous resection [VR]) (Chi-square 2.79, p = 0.247)
| Resection margin | Without VR (n = 111) | With VR (n = 22) |
|---|---|---|
| R0 | 102 | 18 |
| R0,1 | 5 | 3 |
| R1 | 4 | 1 |
Table 5
Cause of intrahospital deaths between both groups. (P = 1.0, Fischer’s exact test, no statistical significance in death rate)
| Cause of death | Without VR | With VR |
|---|---|---|
| Massive pulmonary embolia | 1 | 0 |
| Cerebrovascular insult | 1 | 0 |
| Myocardial infarction | 2 | 1 |
| Bronchopneumonia | 1 | 0 |
VR = vein resection
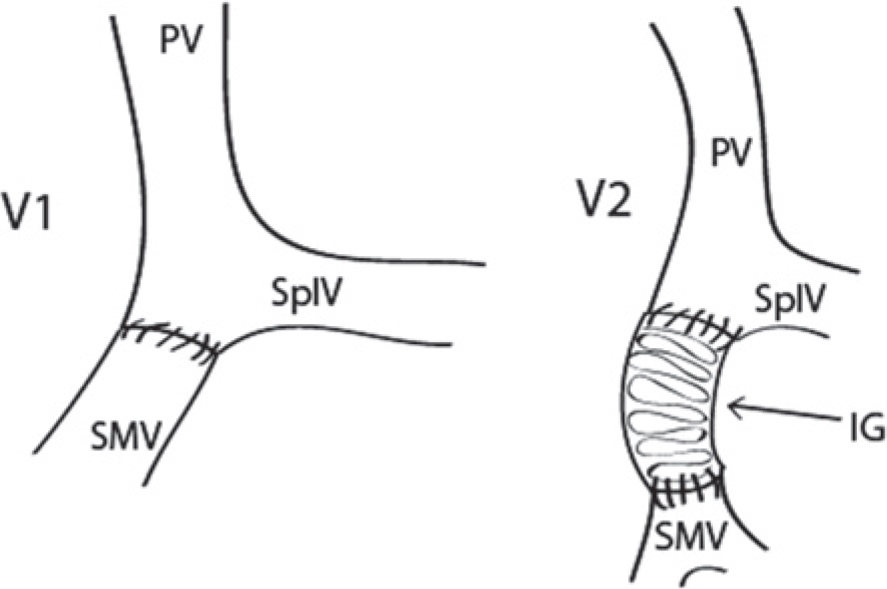
Figure 1
In presented series basically two types of venous reconstruction were performed. When tumour involvement was limited to the superior mesenteric vein (SMV) or portal vein (PV) such that the splenic vein (SplV) could be preserved, and vessels could be approximated without tension a primary end-to-end anastomosis was performed (V1). In the remaining cases interposition graft (IG) was needed (V2).
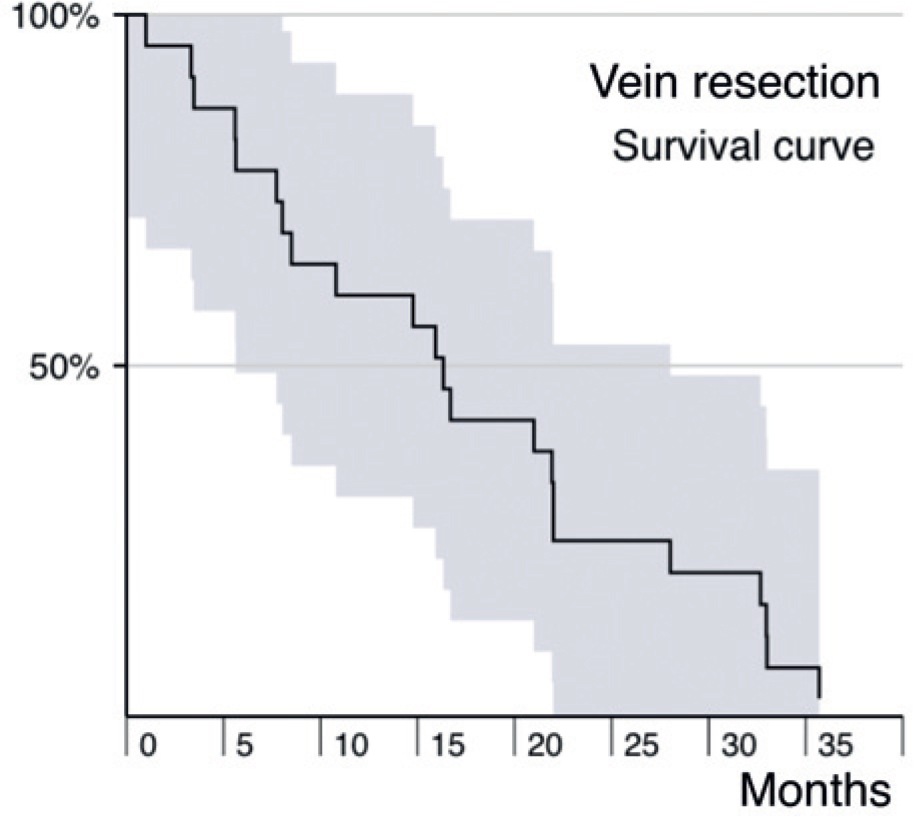
Figure 2
Kaplan-Meier survival plot for patients with vein reconstruction (pacreaticoduodenectomy [PD]+ vein resection [VR]). Median survival time in months was in this group 16.1 months.
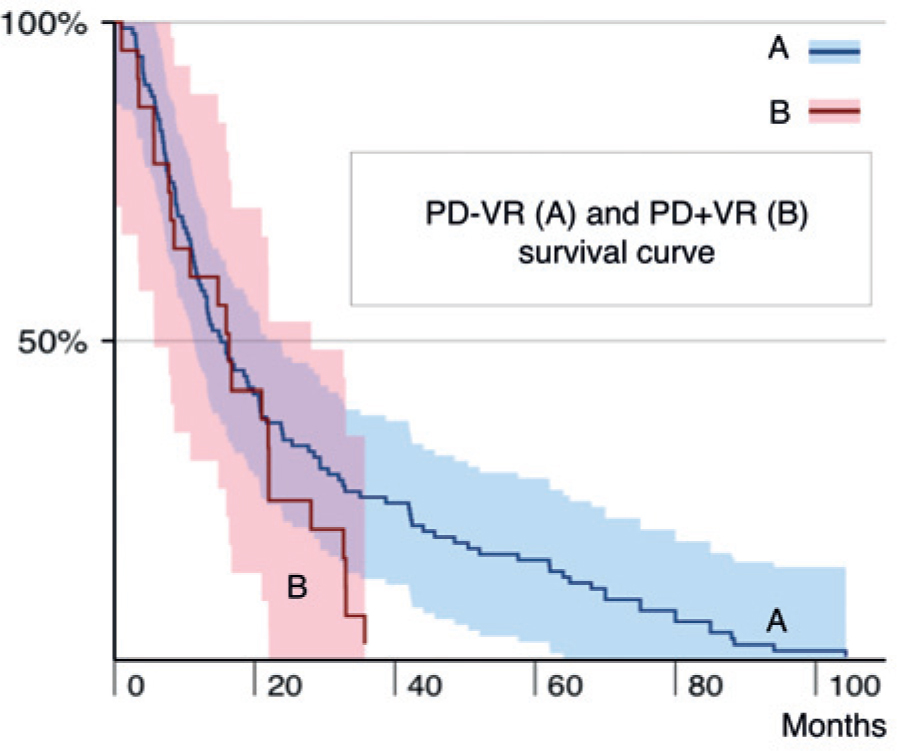
Figure 3
Comparison of Kaplan-Meier survival plots for both groups. Median survival time in months was in group with vein resection (pacreaticoduodenectomy [PD]+ vein resection [VR]) 16.1 months (line B) and in group without vein resection (PD - VR) 15.2 months (line A). Five year survival in group without vein resection (line B) was 19.5%. Comparison of survival curves showed equal hazard rates with log-rank p = 0.090 (z = 1.659 at 5% C; C = 1.96).