
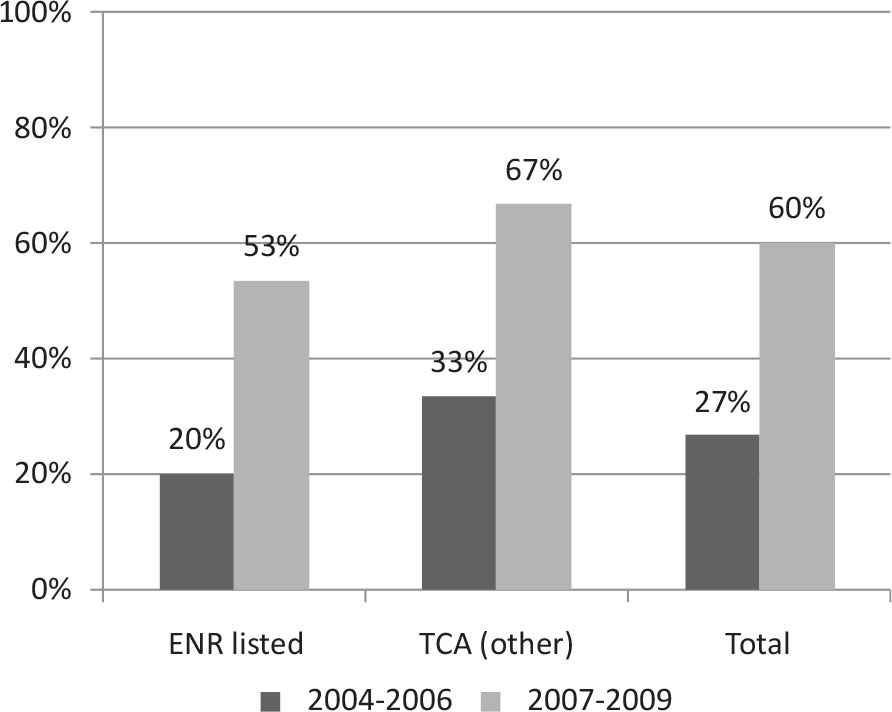
Fig. 1
Collaboration with other institutions in the periods 2004–2006 and 2007–2009 for ENR-listed and TCA-member non-ENR-listed contractors.
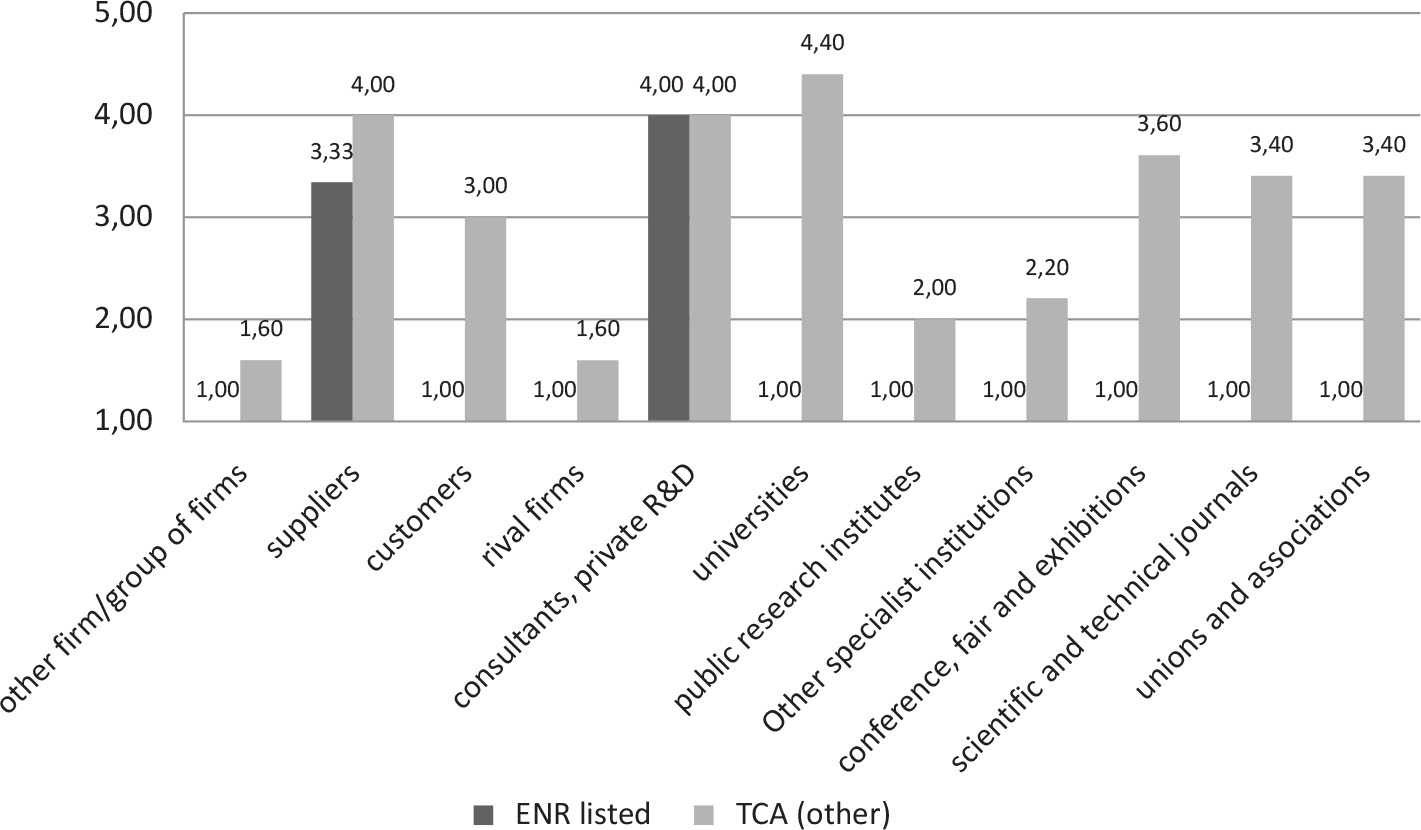
Fig. 2
Level of importance indicated for the types of collaboration and sources of information for the period 2004–2006.
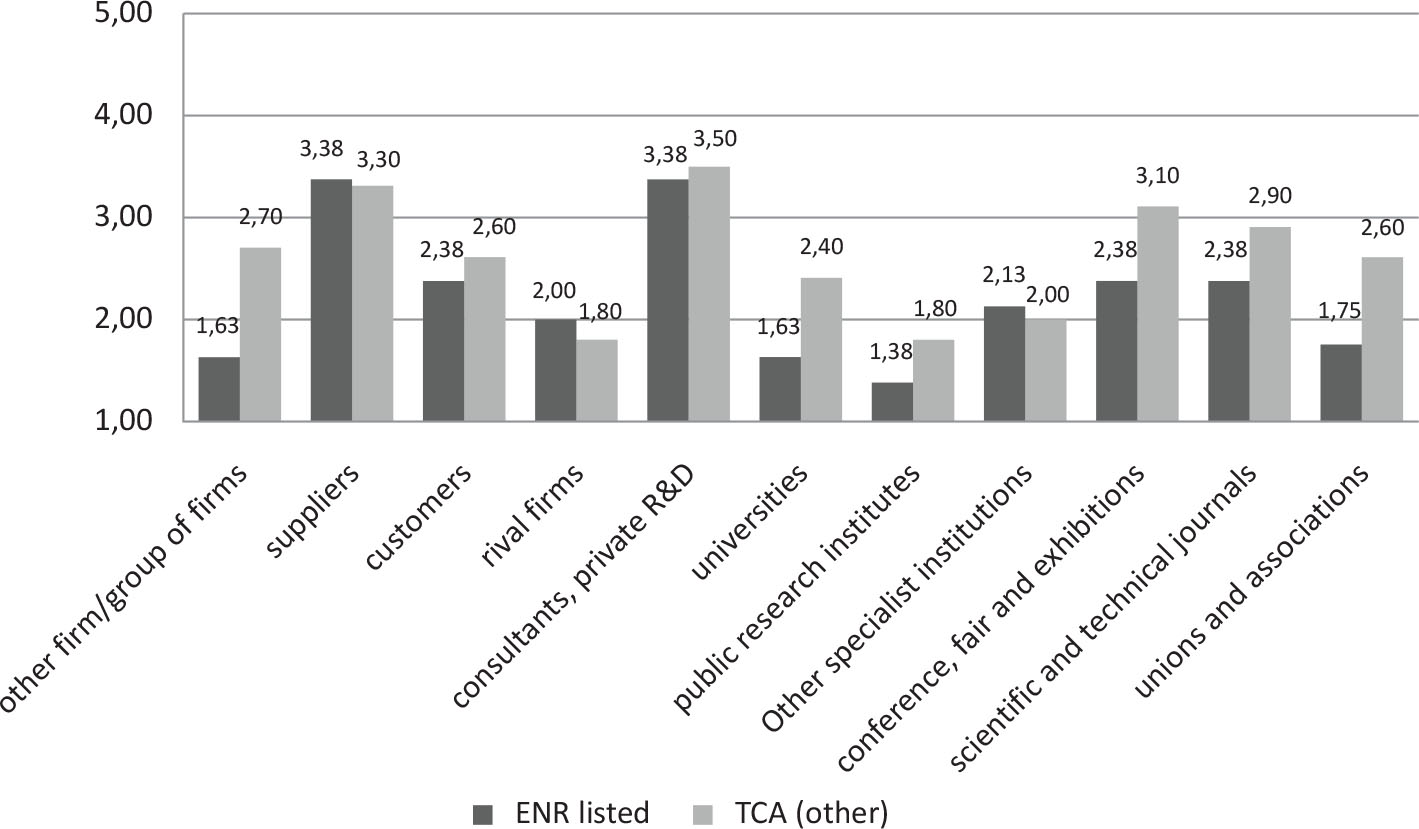
Fig. 3
Level of importance indicated for the types of collaborations and sources of information for the period 2007–2009.
Tab. 1
Contractor group × importance level for sources of information and collaborative activities (2004–2006).
| Other firm/group of firms | Suppliers | Customers | Rival firms | Consultants, private R&D institutions | Universities | |
| Mann–Whitney U | 24,500 | 36,500 | 38,000 | 37,000 | 38,500 | 29,000 |
| Wilcoxon W | 60,500 | 91,500 | 74,000 | 92,000 | 93,500 | 65,000 |
| Z | –1,525 | –,329 | –,198 | –,320 | –,138 | –1,114 |
| Asymp. Sig. (two-tailed) | ,127 | ,742 | ,843 | ,749 | ,890 | ,265 |
| Public research institutes | Other specialist institutes | Conferences, fairs and exhibitions | Scientific and technical journals | Unions and associations, etc. | ||
| Mann–Whitney U | 30,500 | 39,000 | 28,000 | 33,500 | 29,000 | |
| Wilcoxon W | 66,500 | 94,000 | 64,000 | 69,500 | 65,000 | |
| Z | –1,070 | –,102 | –1,109 | –,605 | –1,116 | |
| Asymp. Sig. (two-tailed) | ,285 | ,919 | ,268 | ,545 | ,264 | |
[i] Valid for all the collaborations and sources of innovation, at the significance level α=0.05, P-value >0.05 and at α=0.1, P<0.1; thus, the H0 hypothesis is accepted. As a result, for the period 2004–2006, ENR-listed firms and non-ENR-listed TCA-member contractors do not show a statistically significant difference according to the level of importance indicated for sources of information and collaborative activities.
Tab. 2
Contractor group × importance level for sources of information and collaborative activities (2007–2009).
| Other firm/group of firms | Suppliers | Customers | Rival firms | Consultants, private R&D institutions | Universities | |
| Mann–Whitney U | 6,000 | 7,500 | 3,000 | 6,000 | 7,500 | ,000 |
| Wilcoxon W | 12,000 | 13,500 | 9,000 | 12,000 | 13,500 | 6,000 |
| Z | –,775 | ,000 | –1,549 | –,775 | ,000 | –2,366 |
| Asymp. Sig. (two-tailed) | ,439 | 1,000 | ,121 | ,439 | 1,000 | ,018 |
| Public research institutes | Other specialist institutes | Conferences, fairs and exhibitions | Scientific and technical journals | Unions and associations, etc. | ||
| Mann-Whitney U | 4,500 | 4,500 | 1,500 | 1,500 | 3,000 | |
| Wilcoxon W | 10,500 | 10,500 | 7,500 | 7,500 | 9,000 | |
| Z | –1,171 | –1,183 | –1,960 | –1,932 | –1,587 | |
| Asymp. Sig. (2-tailed) | ,242 | ,237 | ,050 | ,053 | ,112 | |
[i] There is a significant difference between the ENR-listed firms and TCA-member non-listed contractors in terms of the level of importance given to collaborations and sources of innovation. As a result, TCA member contractors indicate statistically significant level of importance to collaborations with “universities” and sources of innovation “conferences, fairs and exhibitions” and “scientific and technical journals” in the period 2007–2009.