Figure 1
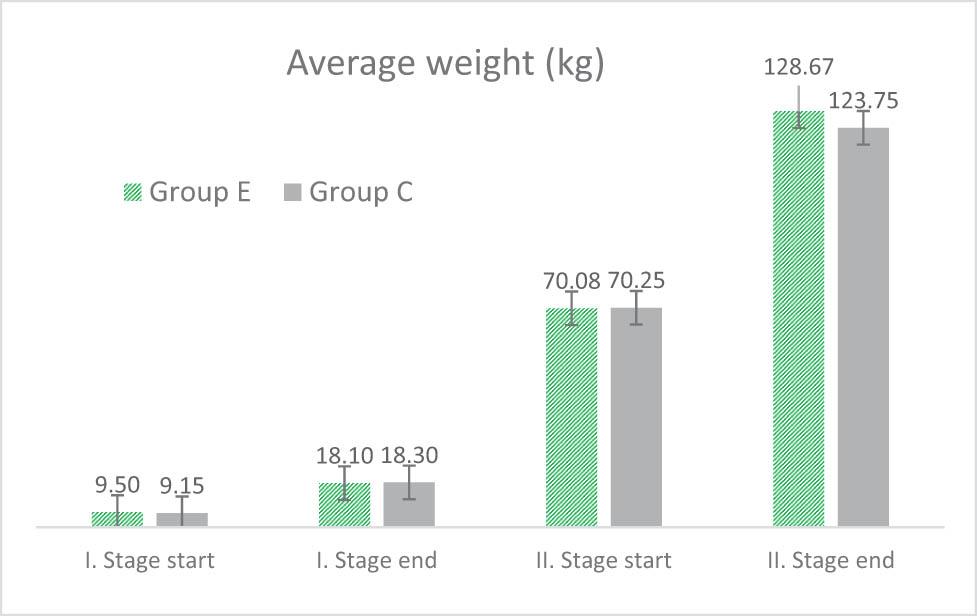
Performance parameters
| Item | Group C | Group E | Significance | ||
|---|---|---|---|---|---|
| Mean | SD | Mean | SD | ||
| Average daily gain (kg/day) | |||||
| Stage I | 0.436 | 0.077 | 0.405 | 0.062 | ns |
| Stage II | 0.713 | 0.104 | 0.781 | 0.073 | ns |
| Average feed intake (kg/day) | |||||
| Stage I | 0.827 | 0.789 | |||
| Stage II | 3.050 | 2.730 | |||
| FCR (kg/kg) | |||||
| Stage I | 1,90 | 1,95 | |||
| Stage II | 4.30 | 3.50 | |||
Average nutrient content (%) in feed mixes
| Item | Stage I | Stage II | ||
|---|---|---|---|---|
| Basic mixture | +0.5% hops | Basic mixture | +0.8% hops | |
| Dry matter | 90.06 | 89.61 | 88.10 | 87.78 |
| Crude protein | 15.79 | 16.23 | 12.33 | 12.52 |
| Ether extract | 4.21 | 4.54 | 3.67 | 3.86 |
| Crude fibre | 3.79 | 4.19 | 5.66 | 6.27 |
| Ash | 4.53 | 4.34 | 5.82 | 5.59 |
Average nutrient content (%) in faecal samples for Experimental (E) and Control (C) groups
| Item | Group C | Group E | Significance | ||
|---|---|---|---|---|---|
| Mean | SD | Mean | SD | ||
| Dry matter | 25.49 | 1.530 | 23.61 | 1.579 | ns |
| Crude protein | 25.67 | 3.054 | 27.98 | 0.928 | ns |
| Ether extract | 8.25 | 0.633 | 9.63 | 0.776 | * |
| Crude fibre | 12.64 | 1.625 | 12.22 | 1.063 | ns |
| Ash | 9.06 | 0.731 | 8.22 | 0.566 | ns |
TBARS content (measured as malondialdehyde) in meat samples (mg/kg) for Experimental (E) and Control (C) groups
| Day 1 | Day 3 | Day 6 | ||||
|---|---|---|---|---|---|---|
| Mean | SD | Mean | SD | Mean | SD | |
| Group C | 0.234 | 0.060 | 0.726 | 0.171 | 1.303 | 0.493 |
| Group E | 0.157 | 0.071 | 0.585 | 0.223 | 1.187 | 0.590 |
Fatty acid profile (% of total) in muscle (musculus longissimus lumborum et thoracis) for Experimental (E) and Control (C) groups
| Fatty acid | Group C | Group E | Significance | ||
|---|---|---|---|---|---|
| (%) | Mean | SD | Mean | SD | |
| C14:0 | 1.24 | 0.10 | 1.06 | 0.04 | * |
| C15:1n-5 | 0.35 | 0.13 | 0.47 | 0.21 | ** |
| C16:0 | 21.45 | 1.01 | 21.04 | 0.18 | ns |
| C16:1n-7 | 2.28 | 0.19 | 2.49 | 0.31 | ns |
| C17:0 | 0.31 | 0.04 | 0.28 | 0.02 | ns |
| C18:0 | 12.36 | 0.92 | 12.17 | 0.96 | ns |
| C18:1n-9 | 40.85 | 2.54 | 42.79 | 0.25 | ns |
| C18:2n-6 | 9.48 | 0.80 | 10.06 | 0.36 | ns |
| C18:3n-3 | 1.02 | 0.60 | 0.97 | 0.05 | ns |
| C20:0 | 0.23 | 0.02 | 0.26 | 0.01 | ns |
| C20:1n-9 | 0.96 | 0.06 | 0.89 | 0.06 | ns |
| C20:2n-6 | 0.41 | 0.07 | 0.47 | 0.02 | ns |
| C20:3n-6 | 0.18 | 0.07 | 0.20 | 0.01 | ns |
| C20:4n-6 | 0.99 | 0.10 | 1.06 | 0.10 | ns |
| C20:3n-3 | 0.21 | 0.04 | 0.21 | 0.01 | ns |
| C24:0 | 0.31 | 0.05 | 0.30 | 0.02 | ns |
| C24:1n9 | 0.15 | 0.04 | 0.28 | 0.03 | * |
| ∑ SFAs | 36.36 | 1.28 | 35.33 | 2.33 | ns |
| ∑ MUFAs | 44.86 | 2.86 | 47.46 | 2.10 | ns |
| ∑ PUFAs | 12.76 | 1.03 | 13.50 | 0.55 | ns |
| ∑PUFA n-3 | 1.53 | 0.19 | 1.45 | 0.48 | ns |
| ∑PUFA n-6 | 11.22 | 0.96 | 11.84 | 0.36 | ns |
| PUFA n-6/PUFA n-3 ratio | 7.41 | 8.19 | |||
| AI | 0.46 | 0.42 | |||
| TI | 1.07 | 1.01 | |||
Basic chemical composition (%) of meat samples for Experimental (E) and Control (C) groups
| Group C | Group E | ||||
|---|---|---|---|---|---|
| Item | Mean | SD | Mean | SD | Significance |
| Dry matter | 27.43 | 0.85 | 29.05 | 0.53 | * |
| Crude protein | 21.44 | 0.71 | 21.59 | 0.48 | ns |
| Ether extract | 4.43 | 1.36 | 5.03 | 0.33 | ns |
| Ash | 0.97 | 0.05 | 1.05 | 0.16 | ns |
Nutrient composition of dried hops
| Item | Unit | Value |
|---|---|---|
| Dry matter | % | 90.77 |
| Crude protein | % | 15.42 |
| Ash | % | 7.65 |
| Ether extract | % | 1.47 |
| Fibre | % | 39.42 |
| Copper | mg/kg | 30.20 |
Amino acid profile (g/100 g) of muscle (musculus longissimus lumborum et thoracis) for Experimental (E) and Control (C) groups
| Amino acid | Group C | Group E | |||
|---|---|---|---|---|---|
| g/100 g | Mean | SD | Mean | SD | Significance |
| ASP | 7.64 | 0.17 | 6.91 | 0.25 | ** |
| THR | 3.76 | 0.10 | 3.57 | 0.08 | ns |
| SER | 3.26 | 0.07 | 3.16 | 0.08 | ns |
| GLU | 12.75 | 0.16 | 11.95 | 0.55 | ns |
| PRO | 4.22 | 0.42 | 3.95 | 0.05 | ns |
| GLY | 3.40 | 0.14 | 3.27 | 0.10 | ns |
| ALA | 4.30 | 0.12 | 4.23 | 0.09 | ns |
| CYS | 0.44 | 0.06 | 0.47 | 0.03 | ns |
| VAL | 3.87 | 0.15 | 3.61 | 0.09 | ns |
| MET | 2.41 | 0.43 | 3.05 | 0.07 | ns |
| ILE | 3.56 | 0.12 | 3.35 | 0.07 | ns |
| LEU | 6.13 | 0.08 | 5.83 | 0.15 | * |
| TYR | 2.77 | 0.07 | 2.55 | 0.07 | * |
| PHE | 3.03 | 0.08 | 2.97 | 0.12 | ns |
| HIS | 3.52 | 0.20 | 2.90 | 0.19 | * |
| LYS | 5.41 | 0.22 | 6.45 | 0.11 | *** |
| ARG | 4.70 | 0.76 | 4.55 | 0.21 | ns |