
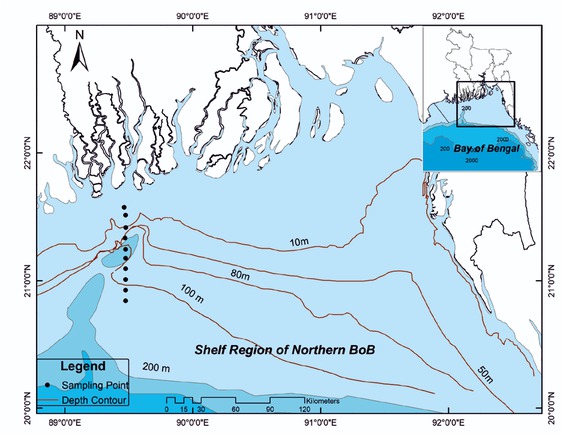
Figure 1
Shelf region of the northern BoB including 10 sampling locations
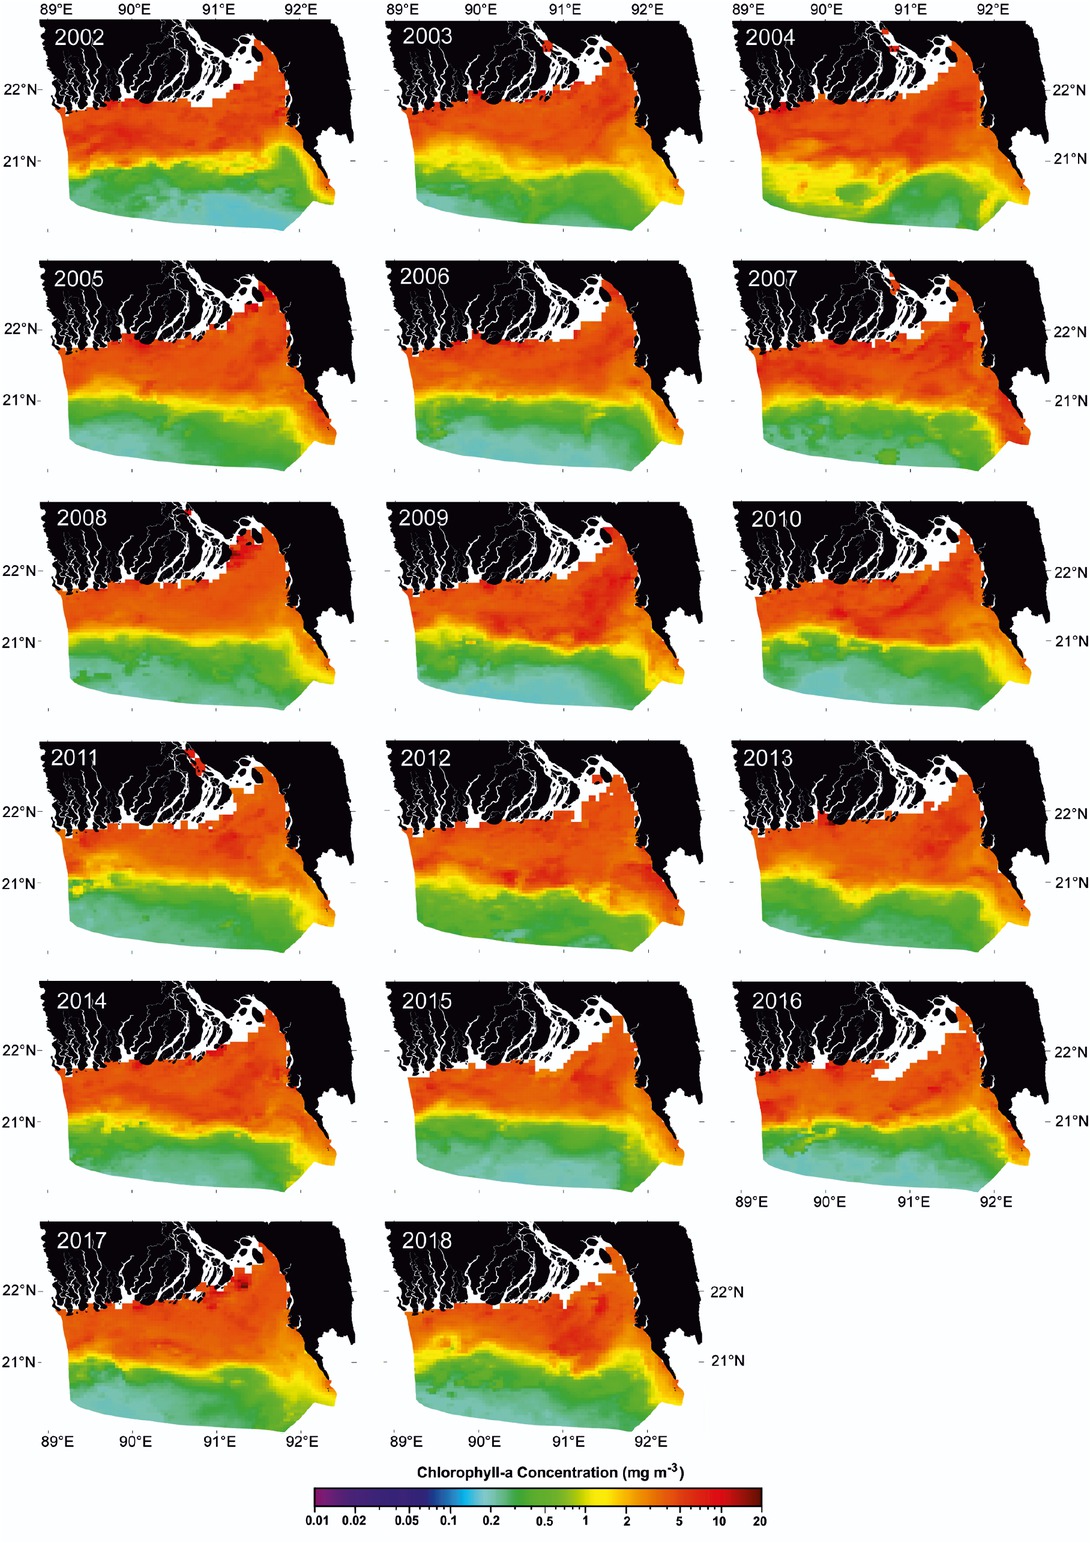
Figure 2
MODIS-Aqua satellite-derived annual composite Chl-a concentration images from 2002 to 2018
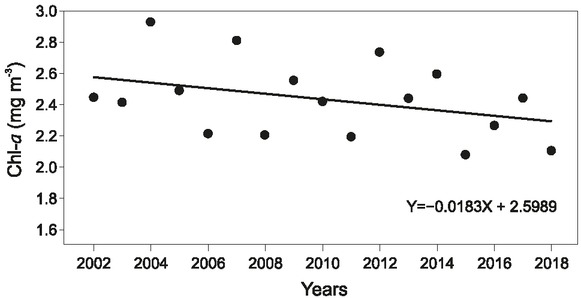
Figure 3
Annual trend in Chl-a concentration from 2002 to 2018
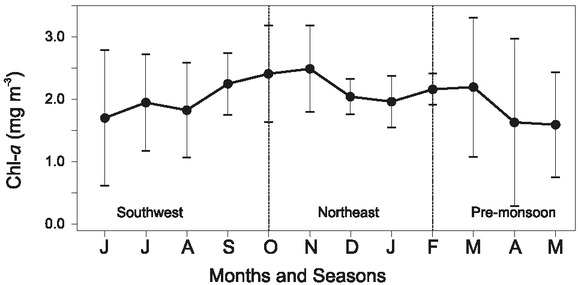
Figure 4
Seasonal trend in Chl-a concentration (July 2002 to June 2018)
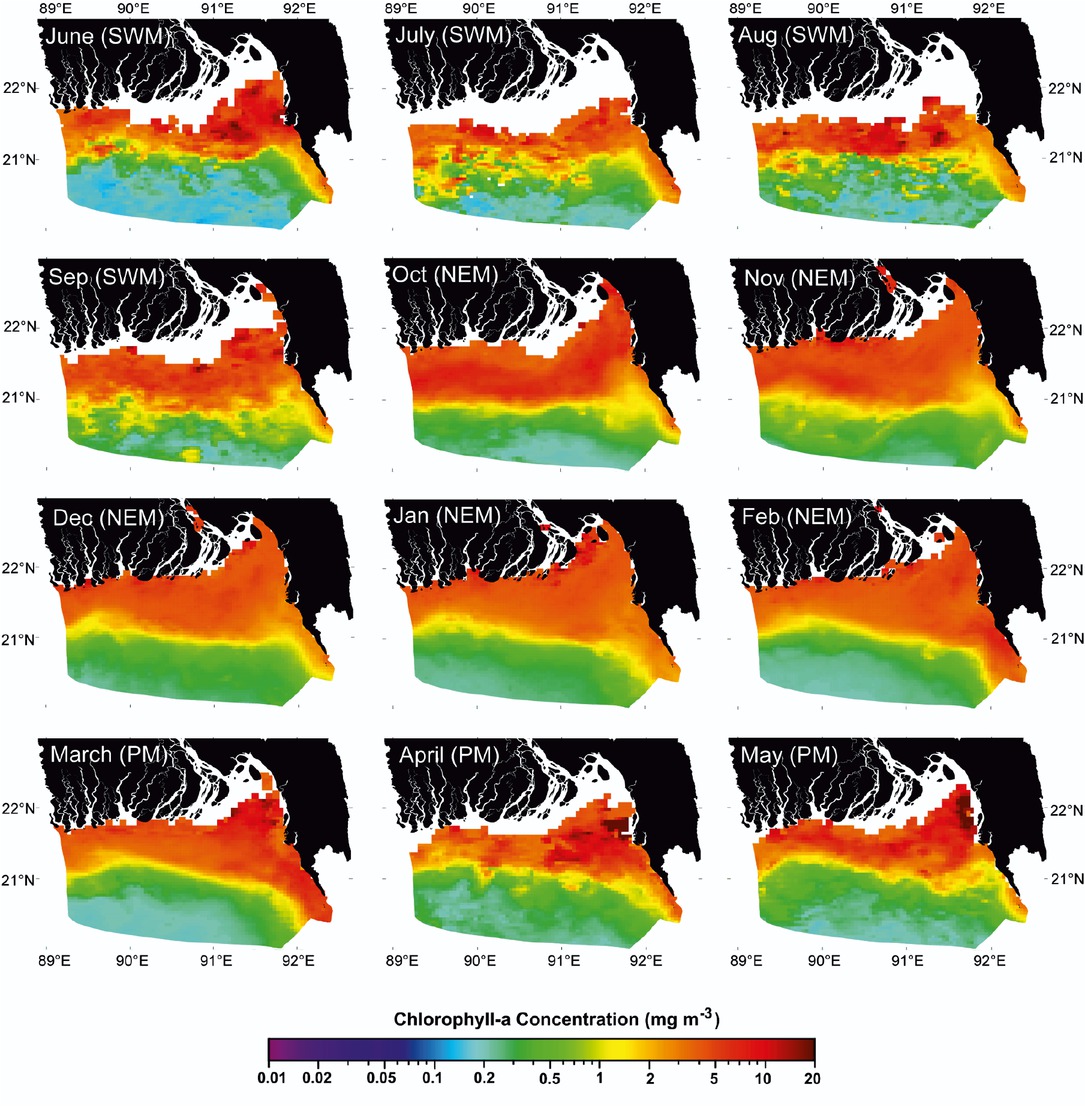
Figure 5
MODIS-Aqua-derived monthly climatological Chl-a concentration images from July 2002 to June 2018 (SWM – southwest monsoon, NEM – northeast monsoon, PM – pre-monsoon)
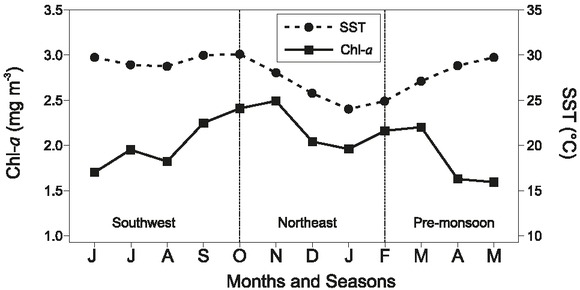
Figure 6
Seasonal trend in Chl-a concentration and SST
Table 1
Statistical analysis of Chl-a concentration and SST
| Time Series | a | b | r | R2 | n |
|---|---|---|---|---|---|
| Southwest (June–September) | −5.505 | 0.254 | 0.224 | 0.050 | 61 |
| Northeast (October–February) | 0.345 | 0.070 | 0.283 | 0.080 | 80 |
| Pre-monsoon (March–May) | 6.604 | −0.168 | −0.186 | 0.035 | 47 |
| Annual data (2002–2018) | 8.951 | −0.237 | −0.326 | 0.160 | 17 |
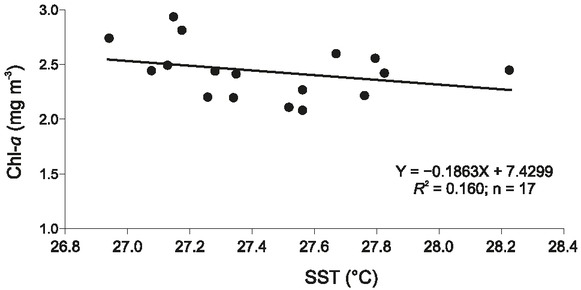
Figure 7
Annual relationship between Chl-a concentration and SST
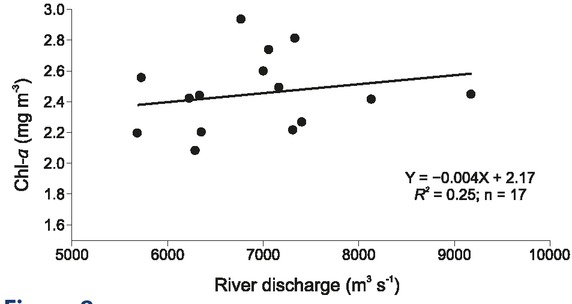
Figure 8
Relationship between Chl-a concentration and river discharge
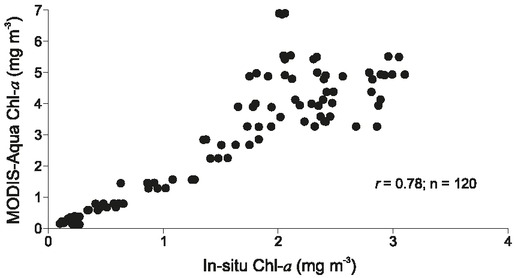
Figure 9
Correlation between in-situ and MODIS Aqua satellite