
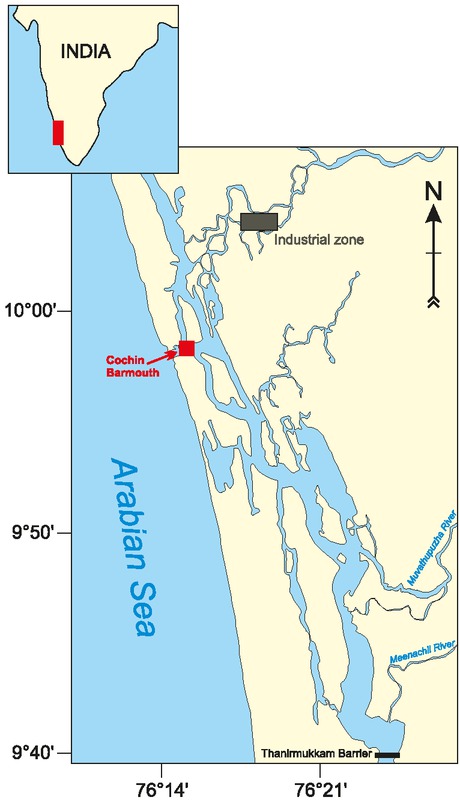
Figure 1
Study area with the sampling location in the Cochin estuary (southwest coast of India)
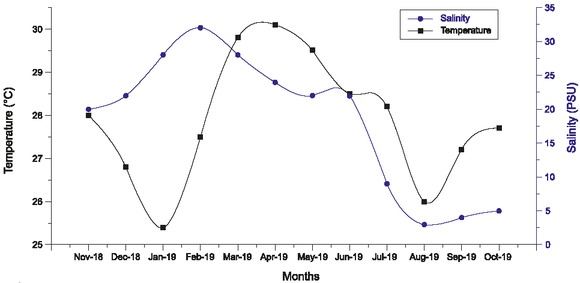
Figure 2
Distribution of surface water temperature and salinity in different months
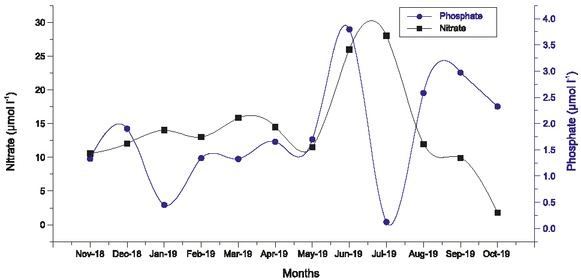
Figure 3
Distribution of nitrate and phosphate concentrations in different months
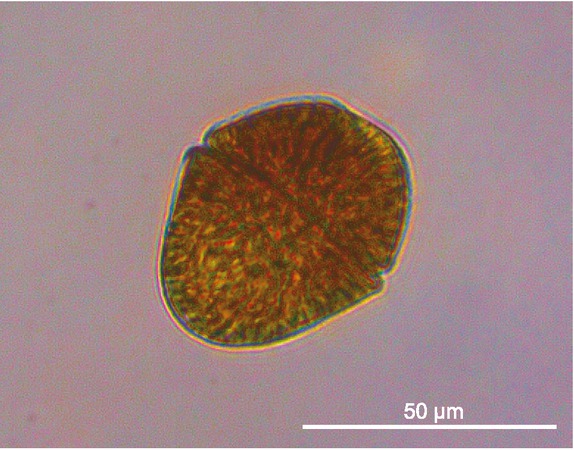
Figure 4
LM of Akashiwo sanguinea
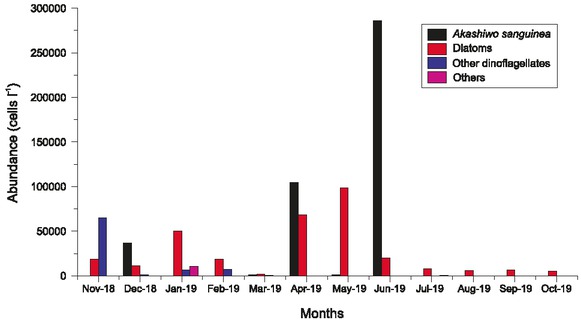
Figure 5
Monthly abundance of four groups of phytoplankton, i.e. Akashiwo sanguinea, diatoms, other dinoflagellates and other taxa (Others)
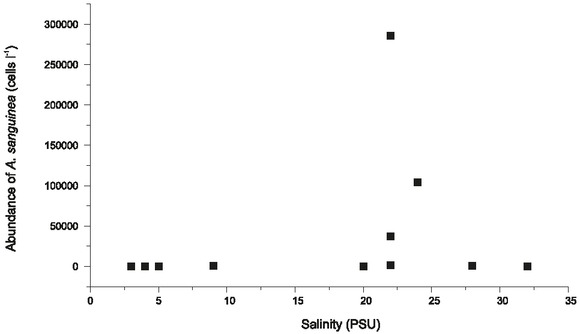
Figure 6
Distribution of Akashiwo sanguinea in relation to salinity
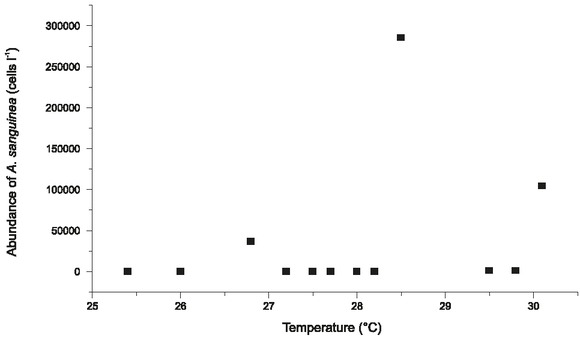
Figure 7
Distribution of Akashiwo sanguinea in relation to surface water temperature