
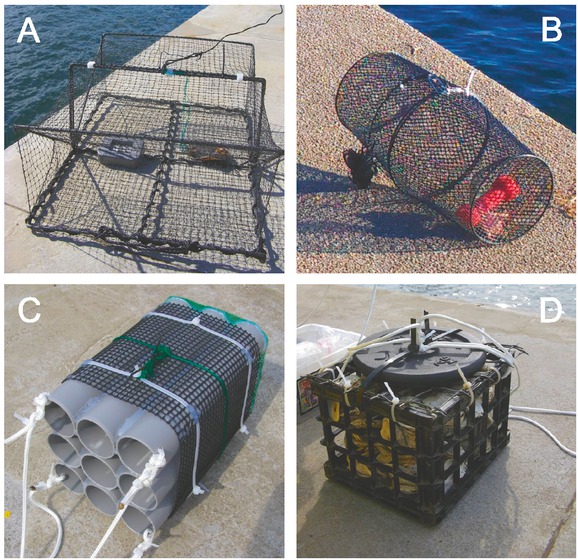
Figure 1
Types of traps used for mobile epifauna sampling from May to October 2014 in the Port of Gdynia: A – Chinese box trap (BT1), B – Gee’s Minnow trap (BT2), C – crab condo (HC1) and D – habitat crate (HC2)
Table 1
Mobile epifauna species collected in the Port of Gdynia by different types of traps (symbols are explained in the text), from May to October 2014. “+” – present, n – the number of deployments, non-indigenous species are marked in bold
| Species | Baited trap | Habitat collector | ||
|---|---|---|---|---|
| BT1 n = 7 | BT2 n = 7 | HC1 n = 2 | HC2 n = 2 | |
| Crustacea | ||||
| Neomysis integer (Leach, 1814) | + | |||
| Praunus fl exuosus (Müller, 1776) | + | |||
| Heterotanais oerstedii (Krøyer, 1842) | + | |||
| Sinelobus vanhaareni Bamber, 2014 | + | |||
| Idotea chelipes (Pallas, 1766) | + | + | + | + |
| Jaera albifrons Leach, 1814 | + | + | ||
| Lekanesphaera rugicauda (Leach, 1814) | + | |||
| Apocorophium lacustre (Vanhöffen, 1911) | + | + | ||
| Leptocheirus pilosus Zaddach, 1844 | + | + | ||
| Melita niti da Smith, 1873 | + | + | ||
| Gammarus zaddachi Sexton, 1912 | + | + | ||
| Gammarus salinus Spooner, 1947 | + | |||
| Gammarus ti grinus Sexton, 1939 | + | + | ||
| Palaemon adspersus Rathke, 1837 | + | + | + | |
| Palaemon elegans Rathke, 1837 | + | + | ||
| Rhithropanopeus harrisii (Gould, 1841) | + | + | + | |
| Gastropoda | ||||
| Tenellia adspersa (Nordmann, 1845) | + | |||
| Acti nopterygii | ||||
| Neogobius melanostomus (Pallas, 1814) | + | + | + | + |
| Nerophis ophidion (Linnaeus, 1758) | + | + | + | |
| Number of all species | 5 | 6 | 12 | 15 |
| Number of NIS | 2 | 3 | 4 | 5 |
Table 2
The number of species and total observed abundance of mobile epifauna collected in the inner part of the Port of Gdynia by different types of traps (symbols are explained in the text), from May to July 2014. Non-indigenous species are marked in bold, n – number of deployments.
| Species number/abundance | June–July | May–July | ||||
|---|---|---|---|---|---|---|
| BT1 n = 2 | BT2 n = 2 | HC1 n = 1 | BT1 n = 3 | BT2 n = 3 | HC2 n = 1 | |
| Number of all species | 3 | 5 | 9 | 3 | 5 | 10 |
| Number of NIS | 1 | 1 | 2 | 1 | 1 | 4 |
| Abundance of all species | 16 | 8 | 35 | 18 | 8 | 87 |
| Abundance of NIS | 1 | 2 | 9 | 1 | 2 | 20 |
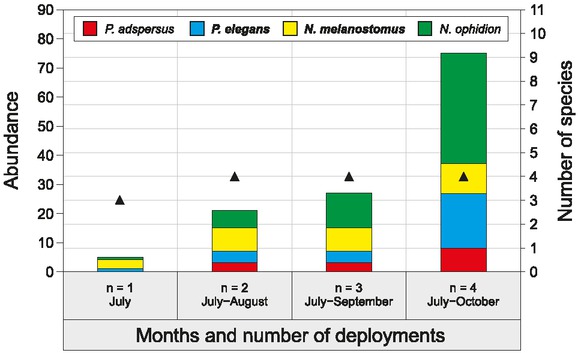
Figure 2
Abundance (bar) and the number (triangle) of mobile epifauna species collected in the outer part of the Port of Gdynia in 2014 by multiple deployment (n) of baited traps (BT1 + BT2) from July to October 2014. Non-indigenous species are marked in bold.