
Figure 1
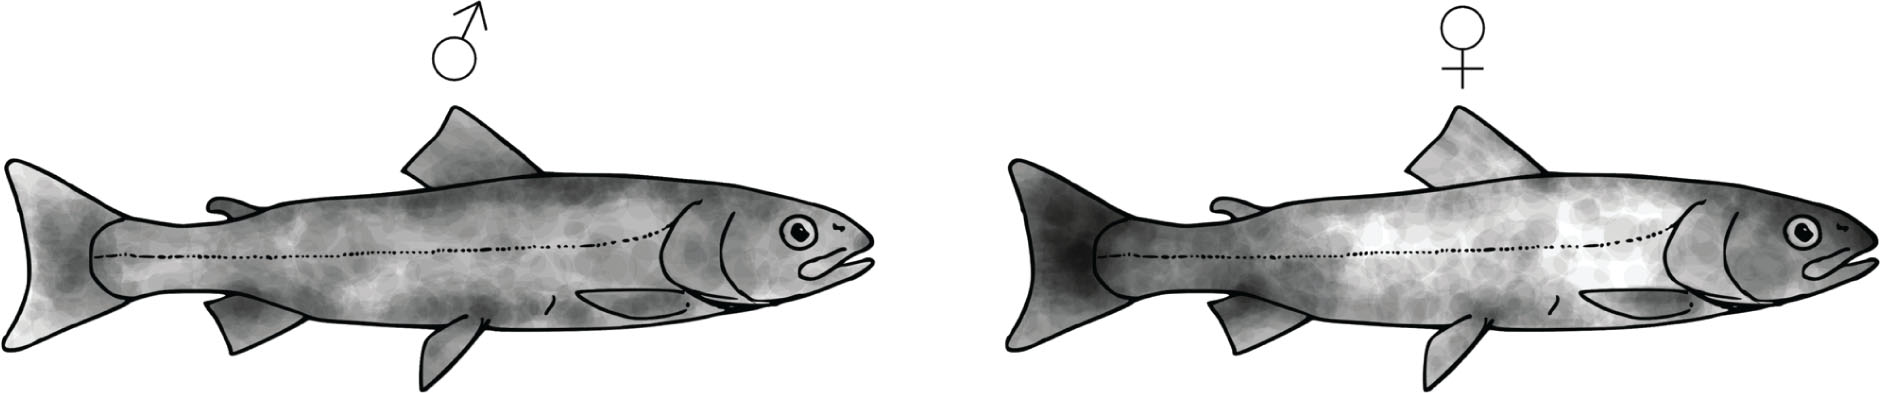
Comparison of composite schemes of Saprolegnia spp. infected males and females of UDN-affected sea trout. The darker the area, the higher the frequency of secondary infection.
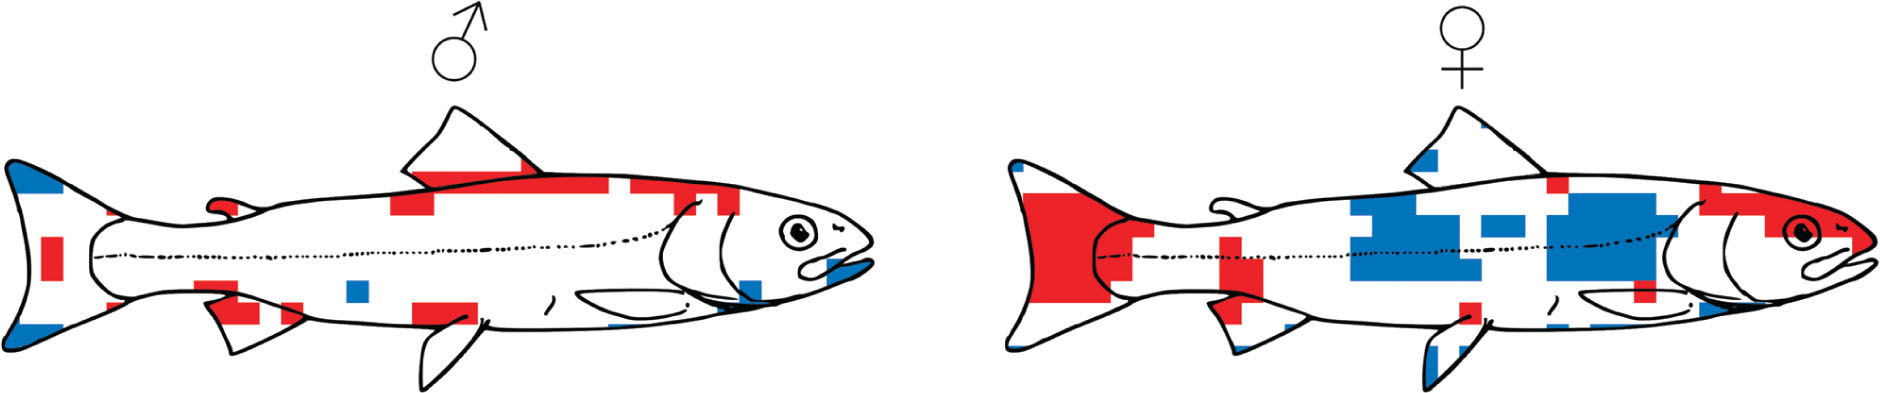
Figure 2
Patterns of Saprolegnia spp. infected and uninfected areas of the fish body, plotted for males and females of UDN-affected sea trout. Areas marked red are significantly more frequently infected (χ2 > 3.841; p < 0.05). Areas marked blue are significantly less frequently infected (χ2 > 3.841; p < 0.05).
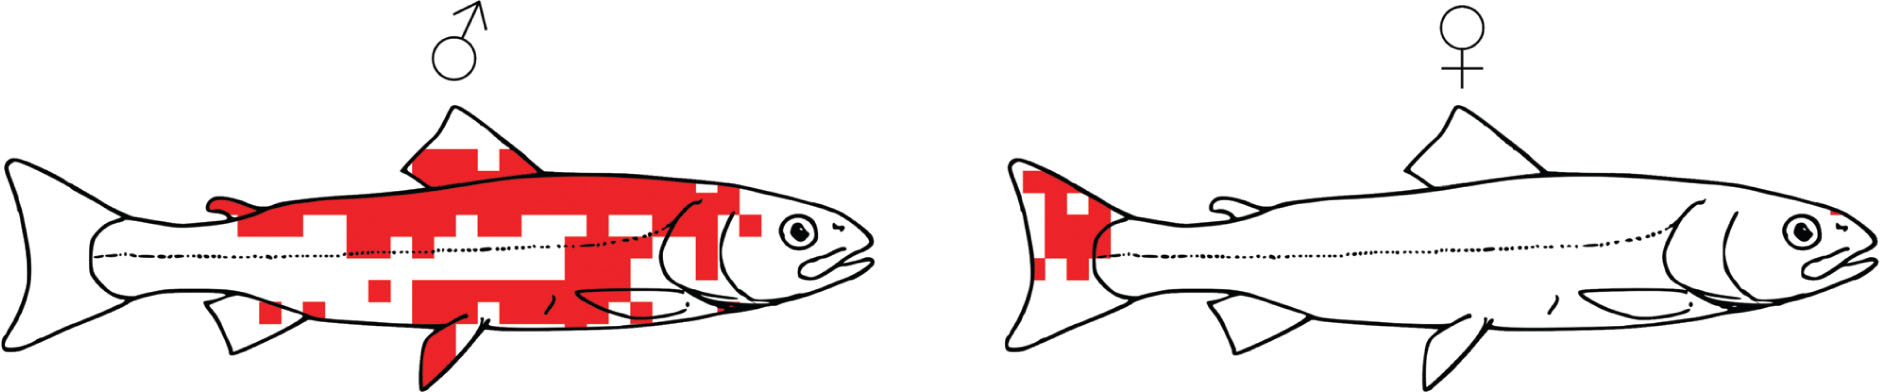
Figure 3
Comparison of infection patterns between males and females of UDN-affected sea trout with the 2 × 2 Contingency Chi-square test. Marked areas are significantly (p < 0.05) more often infected secondarily with Saprolegnia spp.