
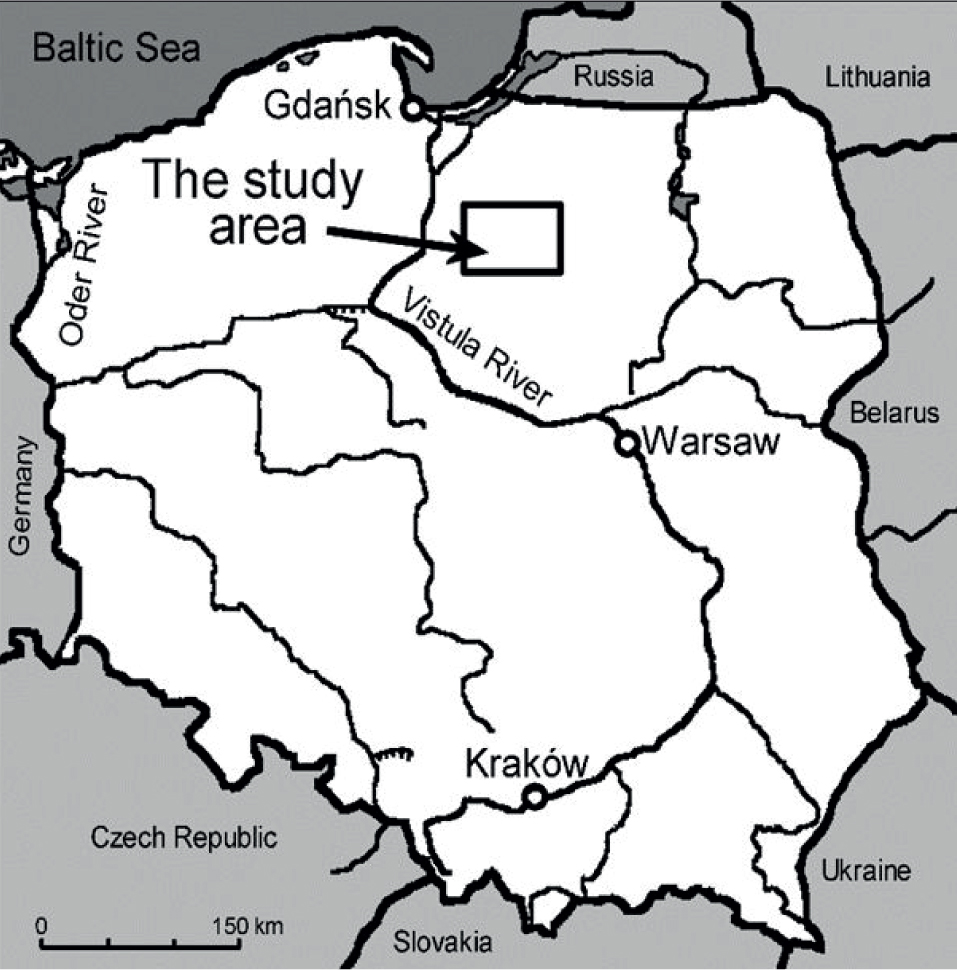
Figure 1
Location of the studied lakes in Poland
Table 1
Basic characteristics of the studied lakes
| Parameter | Macrophyte-dominated lakes | Phytoplankton-dominated lakes | |||||||
|---|---|---|---|---|---|---|---|---|---|
| shallower | deeper | ||||||||
| Zielone | Karaś | Piotrkowskie | Głuchowskie | Ząbrowo | Jeziorak∗ | Stęgwica | Kolmowo | Silm | |
| Surface (ha) | 20.2 | 423.3 | 54.4 | 24.1 | 12.7 | 80.0 | 39.7 | 43.4 | 58.8 |
| Maximum length (m) | 1375 | 4100 | 1450 | 740 | 960 | 2800 | 1880 | 1050 | 1625 |
| Maximum width (m) | 240 | 2250 | 850 | 475 | 215 | 1000 | 290 | 550 | 800 |
| Maximum depth (m) | 2.4 | 2.8 | 2.5 | 4.5 | 1.6 | 2.0 | 1.4 | 5.7 | 3.8 |
| Mean depth (m) | 1.3 | 0.6 | 1.7 | 2.2 | 1.1 | 1.3 | 1.0 | 3.1 | 2.0 |
| Number of sampling locations | 6 | 2 | 2 | 2 | 2 | 7 | 7 | 4 | 3 |
| Depth at sampling locations (m) | 1.5–2.2 | 1.6 ; 2.0 | 1.5 ; 2.0 | 3.0 ; 4.0 | 1.2 ; 1.5 | 1.0–1.5 | 1.2–1.4 | 2.0–3.0 | 3.5 |
| Catchment1 | F | A/M | F | A | F/A | F/T | F | A | F |
| Wind exposure | low | high | medium | high | low | medium | medium | high | medium |
| Dominating elodeid species2 | E.c. | Ch.sp. | Ch.sp. | C.d. | C.d. | ||||
| Elodeid abundance 3 | 5 | 7 | 8 | 8 | 9 | 1 | 1 | 1 | 1 |
∗ – Lake Jeziorak is the longest lake in Poland (length: 27.4 km, surface: 3230 ha). The study in this lake was carried out in a shallow bay part (its morphometry is provided in Table 1) located in the oldest southern part of the lake.
| class | width of the 8th segment (mm) |
|---|---|
| I | < 0.20 |
| II | 0.21–0.30 |
| III | 0.31–0.40 |
| IV | 0.41–0.50 |
| V | 0.51–0.60 |
| VI | 0.61–0.70 |
| VII | 0.71–0.80 |
| VIII | 0.81–0.90 |
| IX | 0.91–1.00 |
| X | 1.01–1.10 |
| XI | 1.11–1.20 |
| XII | 1.21–1.30 |
Table 2
Number of examined individuals of Potamothrix hammoniensis – the sum of all sampling sites and dates
| Lakes | Macrophyte-dominated | Ph-D | Ph-S | Sum | sum | ||||||||
|---|---|---|---|---|---|---|---|---|---|---|---|---|---|
| Class | Zielone | Ząbrowo | Karaś | Piotrkowskie | Głuchowskie | Kolmowo | Silm | Stęgwica | Jeziorak | M | Ph-D | Ph-S | |
| V | 163 | 18 | 31 | 33 | 5 | 68 | 11 | 270 | 95 | 694 | 250 | 79 | 365 |
| VI | 204 | 22 | 15 | 20 | 12 | 100 | 54 | 327 | 91 | 845 | 273 | 154 | 418 |
| VII | 161 | 17 | 15 | 19 | 18 | 57 | 34 | 230 | 69 | 620 | 230 | 91 | 299 |
| VIII | 109 | 20 | 13 | 1 | 6 | 37 | 18 | 92 | 37 | 333 | 149 | 55 | 129 |
| IX | 26 | 13 | 12 | 4 | 2 | 16 | 12 | 43 | 22 | 150 | 57 | 28 | 65 |
| X | 13 | 10 | 9 | 1 | 5 | 8 | 9 | 6 | 61 | 33 | 13 | 15 | |
| XI | 2 | 2 | 1 | 2 | 5 | 2 | 1 | 15 | 5 | 7 | 3 | ||
| XII | 1 | 1 | 1 | ||||||||||
| Sum | 678 | 102 | 96 | 78 | 43 | 286 | 142 | 973 | 321 | 2719 | 997 | 428 | 1294 |
[i] M – macrophyte-dominated, Ph-D – deeper phytoplankton-dominated, Ph-S – shallower phytoplankton-dominated
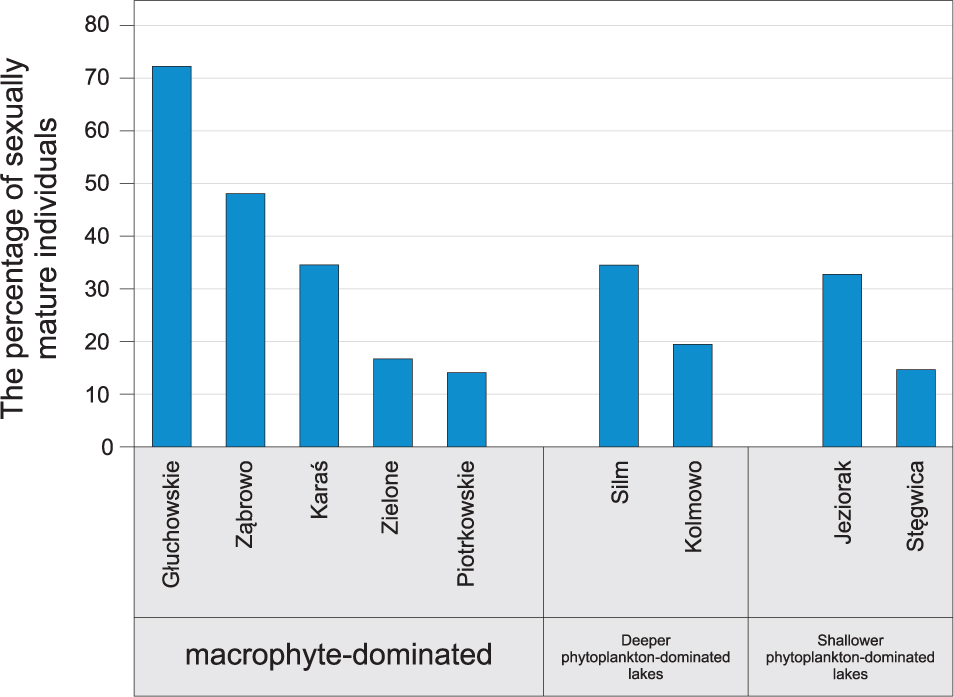
Figure 2
Percentage of sexually mature individuals of Potamothrix hammoniensis in the studied lakes
Table 3
Percentage of sexually mature individuals of Potamothrix hammoniensis in the distinguished size classes
| Lakes | Macrophyte-dominated | Ph-D | Ph-S | Average | Average | ||||||||
|---|---|---|---|---|---|---|---|---|---|---|---|---|---|
| Class | Zielone | Ząbrowo | Karaś | Piotrkowskie | Głuchowskie | Kolmowo | Silm | Stęgwica | Jeziorak | M | Ph-D | Ph-S | |
| V | 0 | 0 | 0 | 0 | 20 | 1 | 0 | 1 | 12 | 2 | < 1 | 1 | 4 |
| VI | 3 | 18 | 0 | 0 | 67 | 10 | 24 | 7 | 19 | 10 | 7 | 15 | 10 |
| VII | 20 | 47 | 40 | 26 | 78 | 25 | 15 | 17 | 35 | 24 | 28 | 21 | 21 |
| VIII | 42 | 70 | 54 | 100 | 100 | 32 | 44 | 36 | 73 | 46 | 50 | 36 | 47 |
| IX | 62 | 85 | 83 | 100 | 100 | 75 | 92 | 84 | 82 | 80 | 75 | 82 | 83 |
| X | 85 | 100 | 100 | 100 | 80 | 100 | 67 | 100 | 90 | 94 | 92 | 80 | |
| XI | 100 | 100 | 100 | 50 | 80 | 100 | 100 | 87 | 100 | 71 | 100 | ||
| XII | 100 | 100 | 100 | ||||||||||
[i] M – macrophyte-dominated, Ph-D – deeper phytoplankton-dominated, Ph-S – shallower phytoplankton-dominated
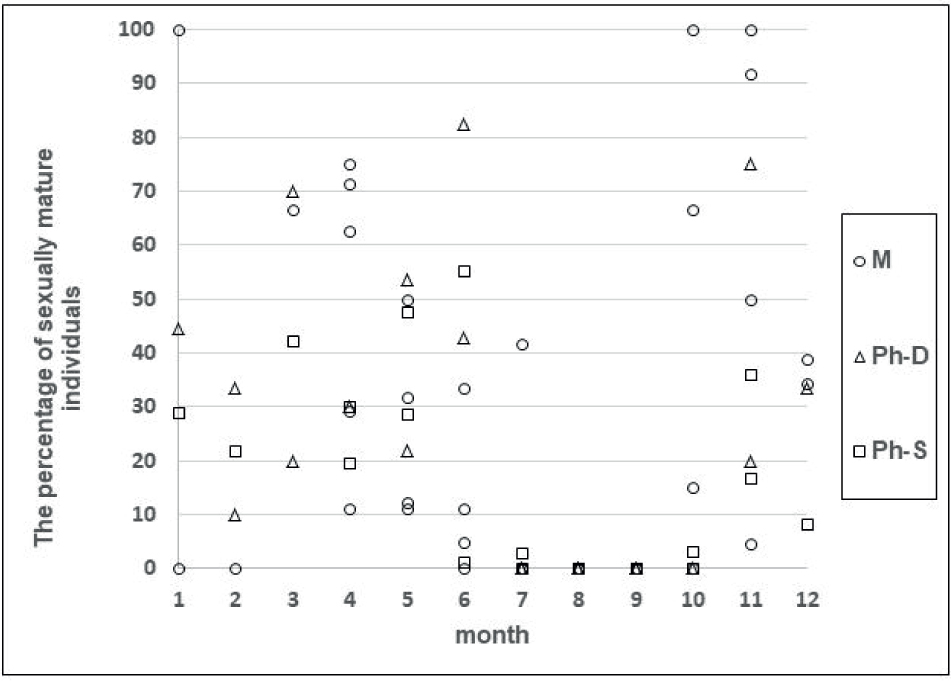
Figure 3
Percentage of sexually mature individuals of Potamothrix hammoniensis in each month
M – macrophyte-dominated lakes; Ph-D – deeper phytoplankton-dominated lakes; Ph-S – shallower phytoplankton-dominated lakes
Table 4
Mean values of abiotic parameters of water and bottom sediments of the studied lakes
| Parameter | Macrophyte-dominated lakes | Phytoplankton-dominated lake | |||||||
|---|---|---|---|---|---|---|---|---|---|
| shallower | deeper | ||||||||
| Zielone | Karaś | Piotrkowskie | Głuchowskie | Ząbrowo | Jeziorak∗ | Stęgwica | Kolmowo | Silm | |
| Secchi depth (m) | 2.2 | 2.1 | 2.1 | 2.0 | 1.7 | 0.8 | 0.7 | 1.0 | 1.4 |
| Water above the bottom | |||||||||
| Temperature (oC) | 13.5 | 13.4 | 14.0 | 12.6 | 12.3 | 12.1 | 11.2 | 12.3 | 13.4 |
| Oxygen concentration (mg dm-3) | 8.0 | 7.8 | 9.3 | 6.4 | 10.0 | 10.8 | 6.9 | 7.2 | 7.2 |
| pH | 7.5 | 7.9 | 8.0 | 8.6 | 8.3 | 8.7 | 7.2 | 8.5 | 8.0 |
| Conductivity (μS cm-1) | 100 | 496 | 253 | 577 | 428 | 309 | 199 | 428 | 425 |
| Bottom sediments | |||||||||
| E × D | 2.4 | 2.7 | 2.2 | 5.5 | 2.7 | 4.4 | 2.9 | 8.3 | 7.6 |
| Water content (%) | 97.3 | 94.6 | 96.6 | 93.3 | 95.8 | 96.1 | 95.5 | 94.7 | 97.4 |
| Organic matter (%) 1 | 78.4 | 39.2 | 64.9 | 32.6 | 49.8 | 51.7 | 54.8 | 34.6 | 58.6 |
| Organic matter (mg) 2 | 170 | 217 | 226 | 242 | 215 | 136 | 252 | 189 | 159 |
| SOD 3 | 2.6 | 3.3 | 3.2 | 6.2 | 5.1 | 4.7 | 4.3 | 8.2 | 3.4 |
Table 5
Values of Pearson’s linear correlation coefficient (r) and the significance level (p) between the percentage of sexually mature individuals of Potamothrix hammoniensis and the environmental variables under study. Statistically significant values are boldfaced
| Statistics | Near-bottom water | E × D | Bottom sediments | ||||||
|---|---|---|---|---|---|---|---|---|---|
| Temperature | Oxygen concentration | pH | Conductivity | WC | OC (%) | OC (mg) | SOD | ||
| r | −0.22 | 0.08 | 0.51 | 0.69 | 0.30 | −0.21 | −0.42 | −0.10 | 0.22 |
| p | 0.204 | 0.648 | 0.002 | < 0.000 | 0.080 | 0.226 | 0.012 | 0.568 | 0.204 |
[i] E × D – index related to the light conditions at the lake bottom; WC – water content; OC (%) – organic matter content expressed as a percentage of dry mass of sediments; OC (mg) – organic matter content in milligrams of dry mass per unit of fresh sediment volume (10 cm3); SOD – sediment oxygen demand
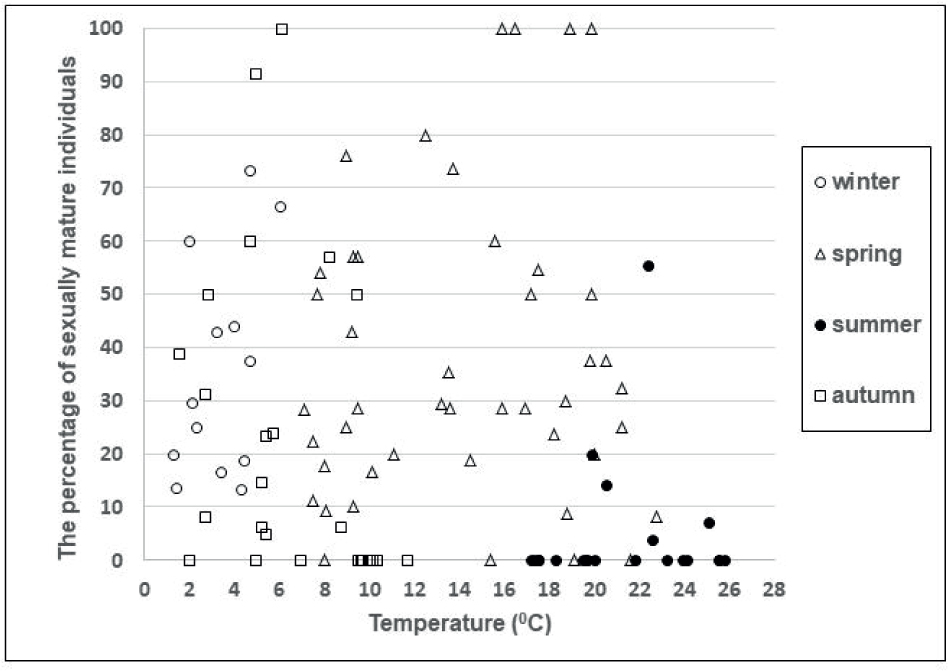
Figure 4
Relationship between the percentage of sexually mature individuals of Potamothrix hammoniensis and the water temperature near bottom
M – macrophyte-dominated lakes; Ph-D – deeper phytoplankton-dominated lakes; Ph-S – shallower phytoplankton-dominated lakes
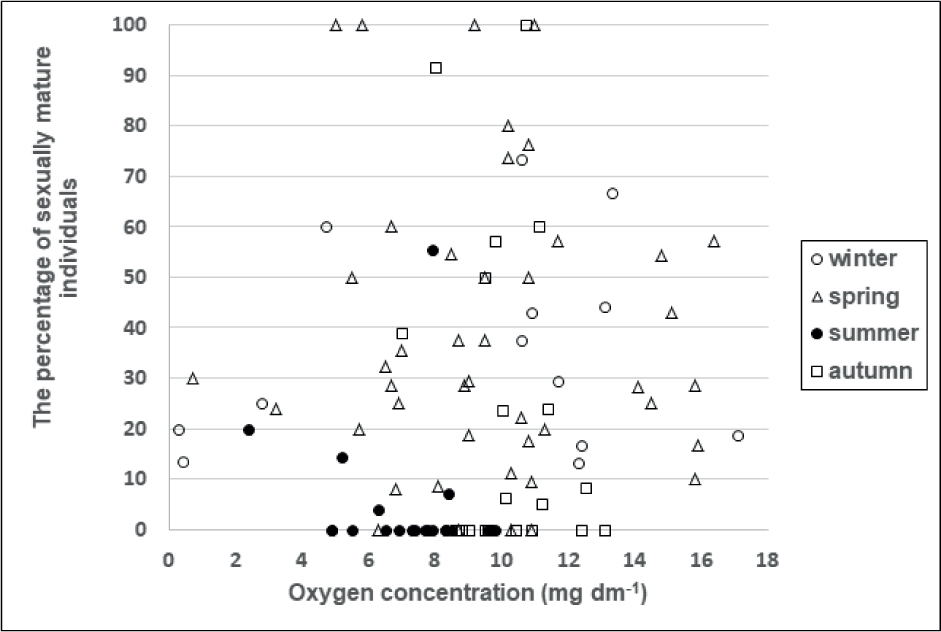
Figure 5
Relationship between the percentage of sexually mature individuals of Potamothrix hammoniensis and the oxygen concentration in the water near the bottom