
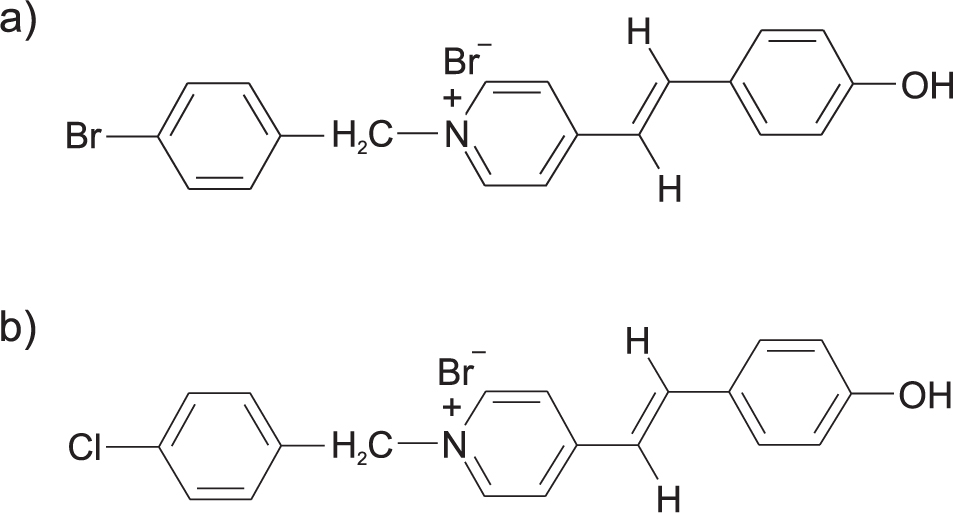
Figure 1
Structures of the analysed compounds: a) bromide of (E)-N-(o-bromobenzyl)-4′-hydroxystilbazole-4 (A1), and b) chloride of (E)-N-(p-chlorobenzyl)-4′-hydroxystilbazole-4 (A2)
Table 1
Chemical and physical data of the analysed compounds
| Compound | M.p. °C | IR (KBr) (cm−1) δCH=CH | 1H-NMR δ(ppm) -ch2-+N |
|---|---|---|---|
| (A1) | 217–220 | 981 | 5.91 |
| (A2) | 240–243 | 986 | 5.82 |
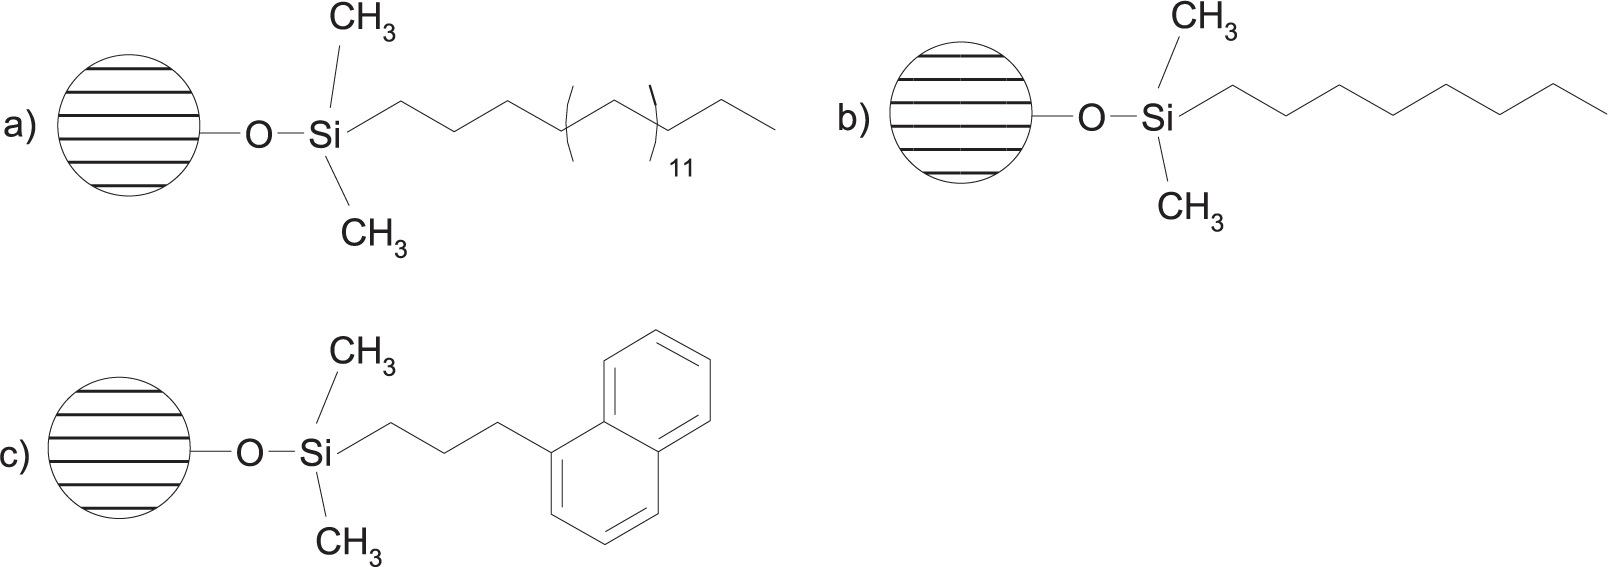
Figure 2
Chemical structures of bonded stationary phases used in the study: a) octadecyl, b) octyl, c) naphthylpropyl stationary phases
Table 2
Concentration range of analytical compounds at which calibration curves are linear, and sensitivity of the HPLC method
| Compound | Concentration range (μg ml−1) | Linear regression equation | R2 | LOD (μg ml−1) | LOQ (μg ml−1) |
|---|---|---|---|---|---|
| (Al) | 5–300 | y = 0.5060x + 0.0499 | 0.9999 | 0.152 | 0.457 |
| (A2) | 5–300 | y = 0.4998x + 0.0421 | 0.9999 | 0.149 | 0.473 |
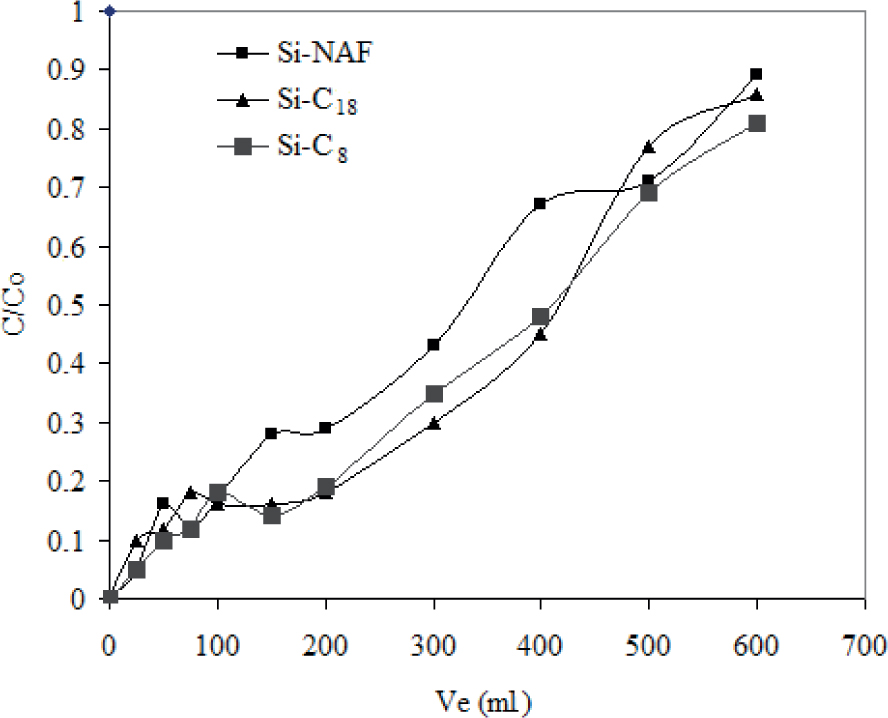
Figure 3
Breakthrough curves for bromide of (E)-N-(o-bromobenzyl)-4′-hydroxystilbazole-4, obtained in the column packings used in the study
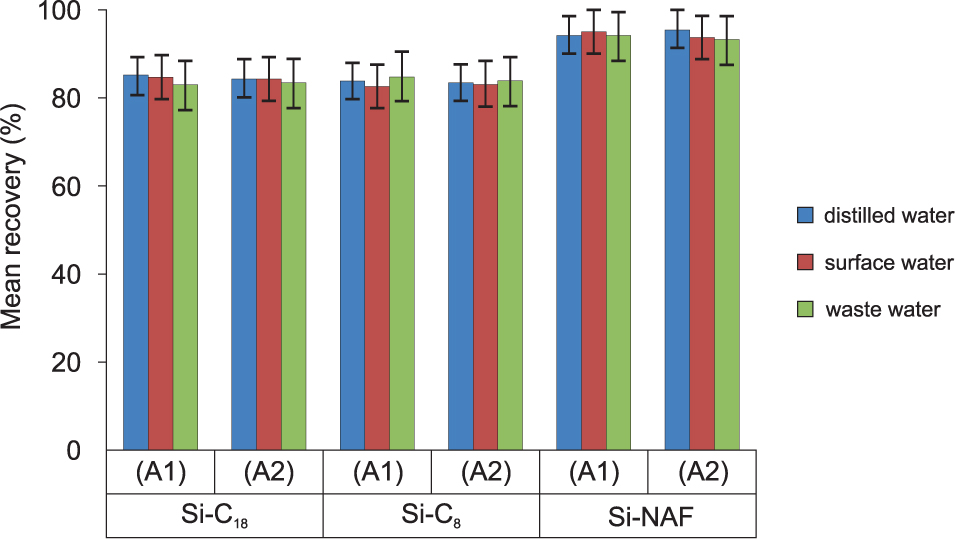
Figure 4
Mean recovery values (1 hour after sample preparation) for bromide of (E)-N-(o-bromobenzyl)-4′-hydroxystilbazole-4 (A1) and chloride of (E)-N-(p-chlorobenzyl)-4′-hydroxystilbazole-4 (A2), obtained from different matrices in the columns used in the study (n = 5)
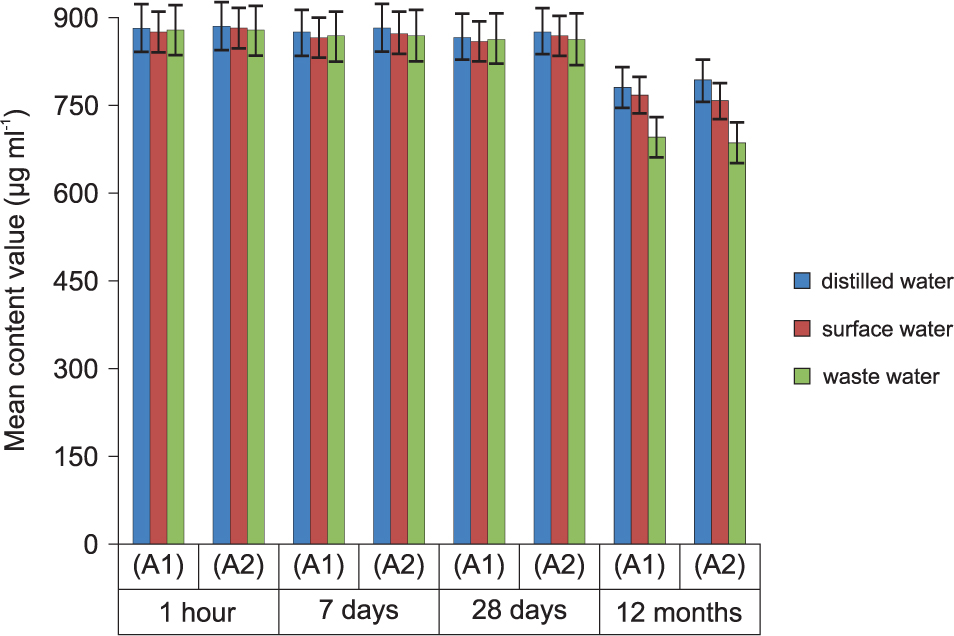
Figure 5
Mean content values for bromide of (E)-N-(o-bromobenzyl)-4′-hydroxystilbazole-4 (A1) and chloride of (E)-N-(p-chlorobenzyl)-4′-hydroxystilbazole-4 (A2) in the distilled, surface and waste water samples after 1 hour, 7 days, 28 days and 12 months, obtained in the naphthylpropyl column