
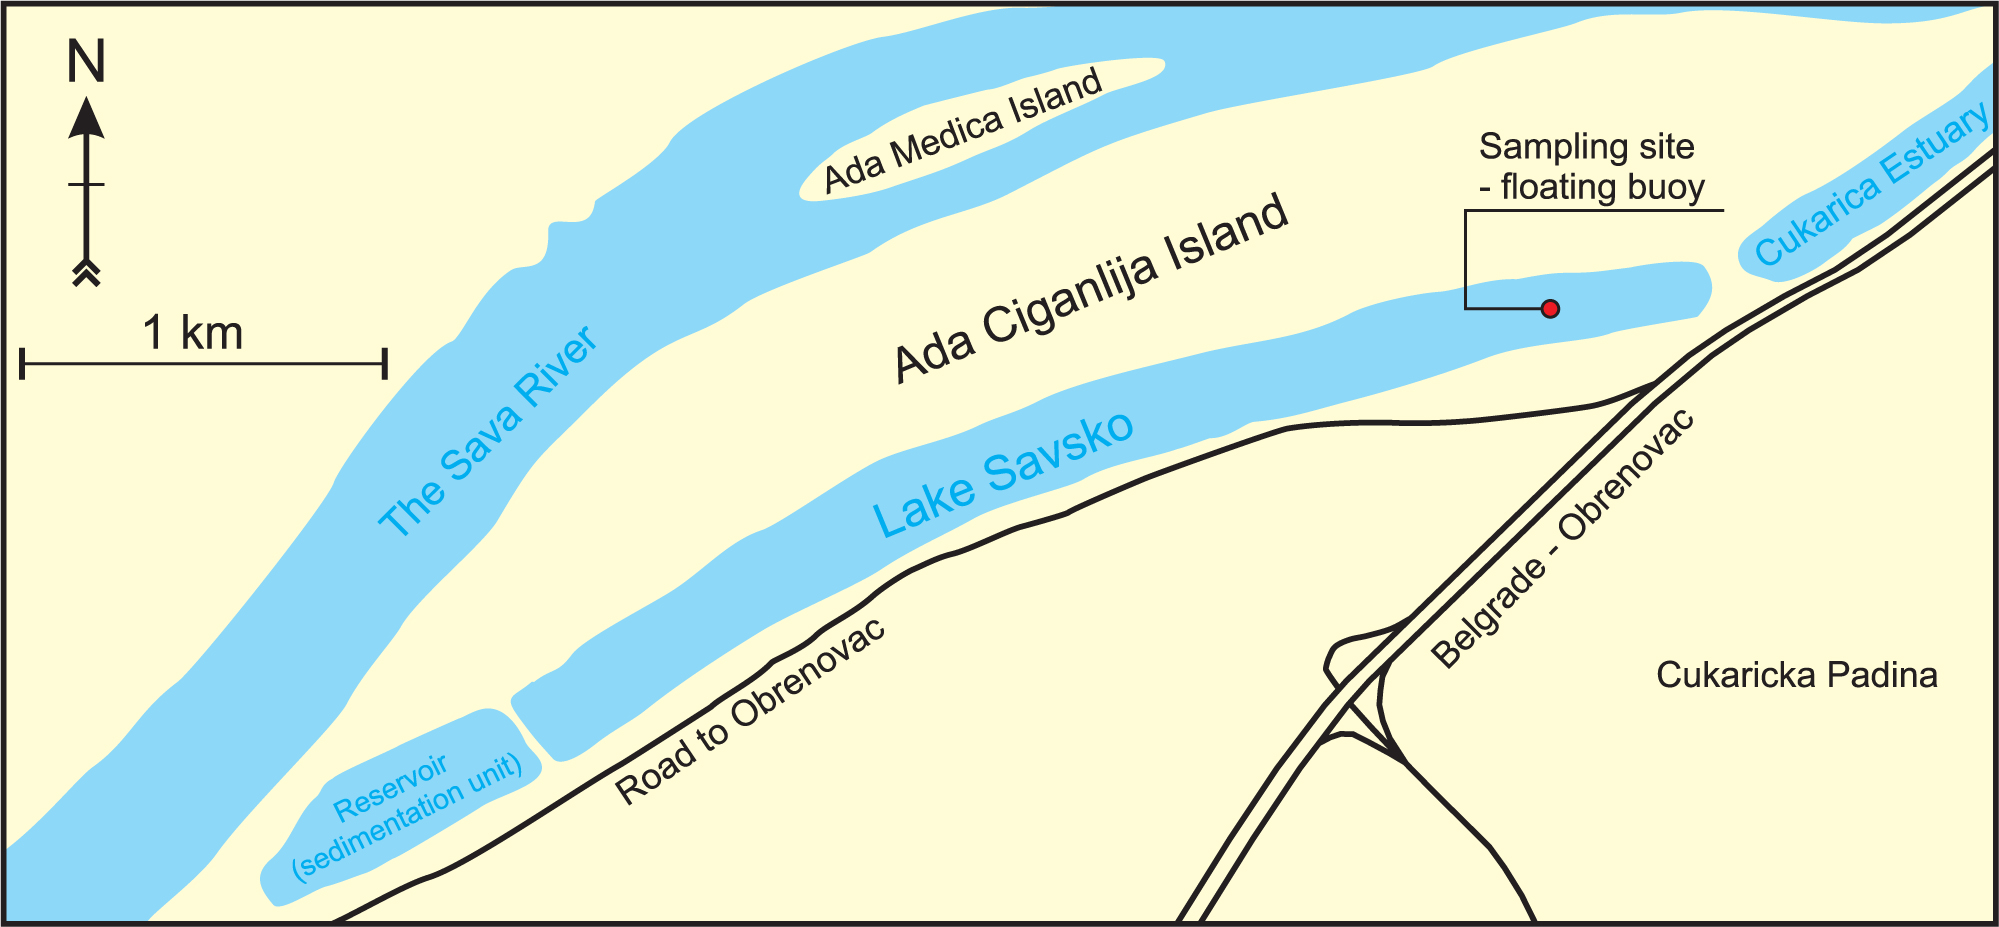
Figure 1
Location of Lake Savsko and the sampling site
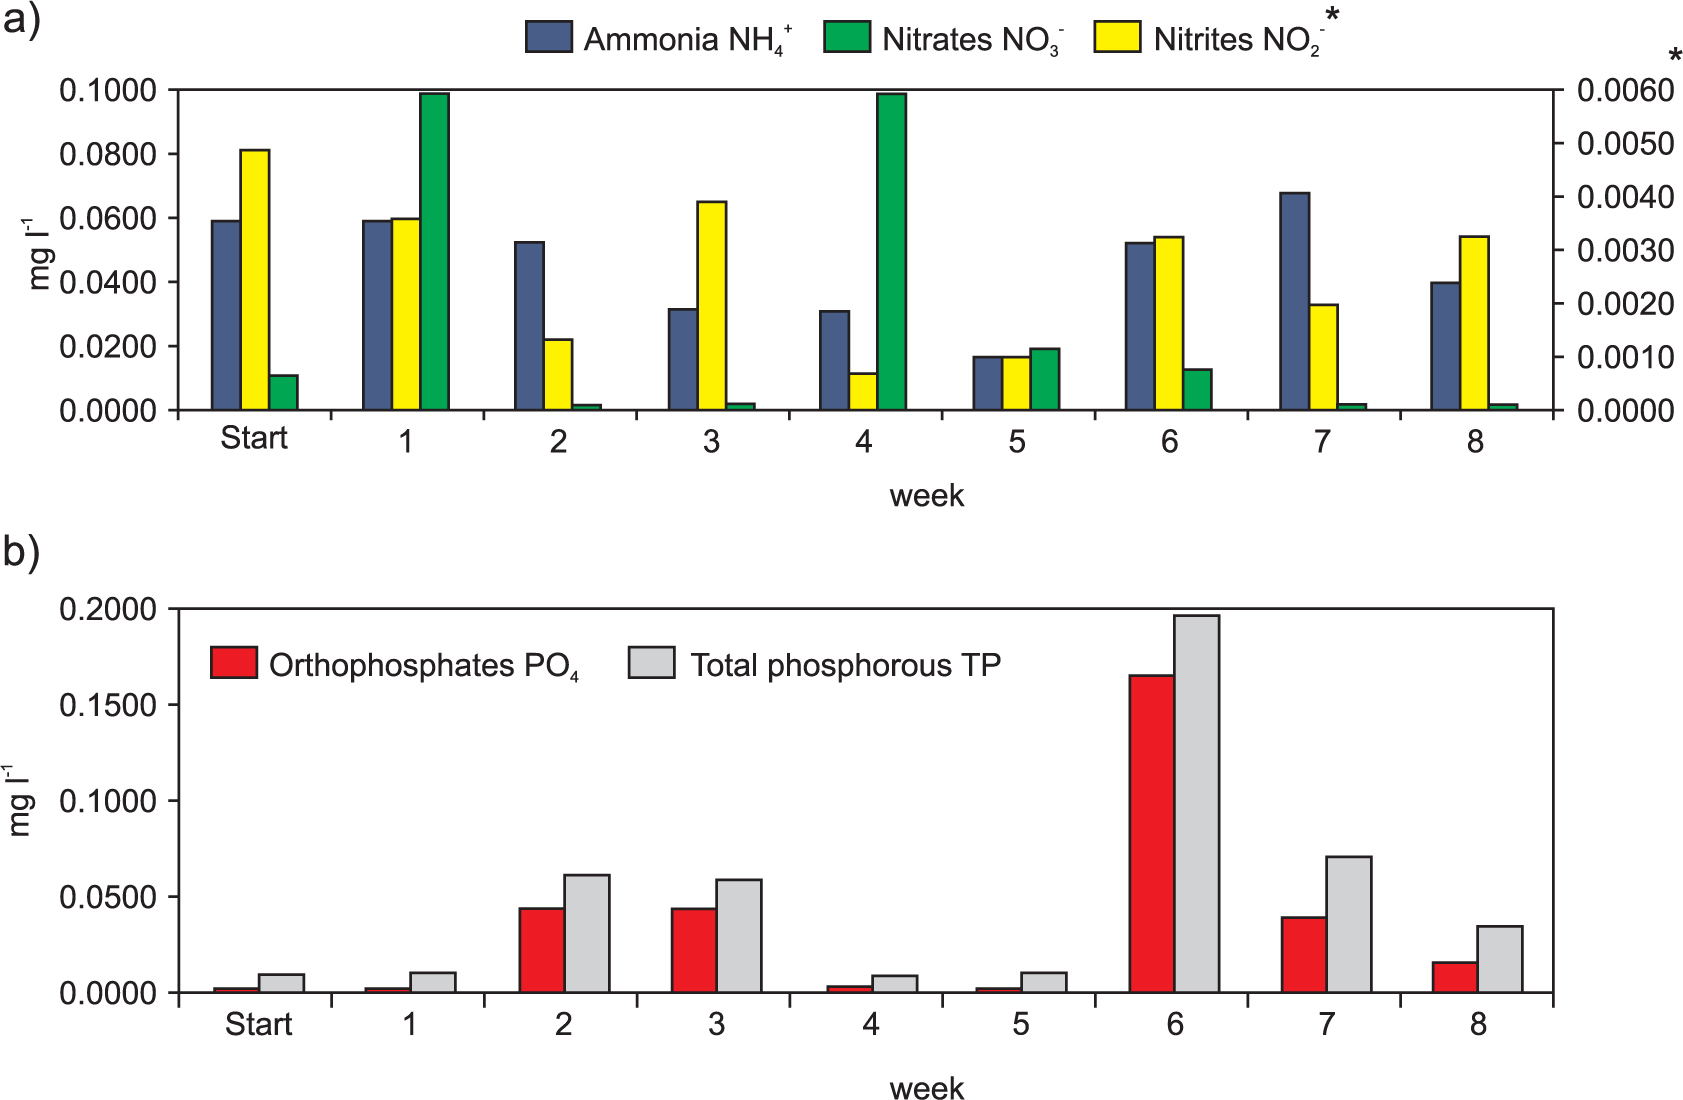
Figure 2
Temporal variation of nutrients in Lake Savsko in summer 2014
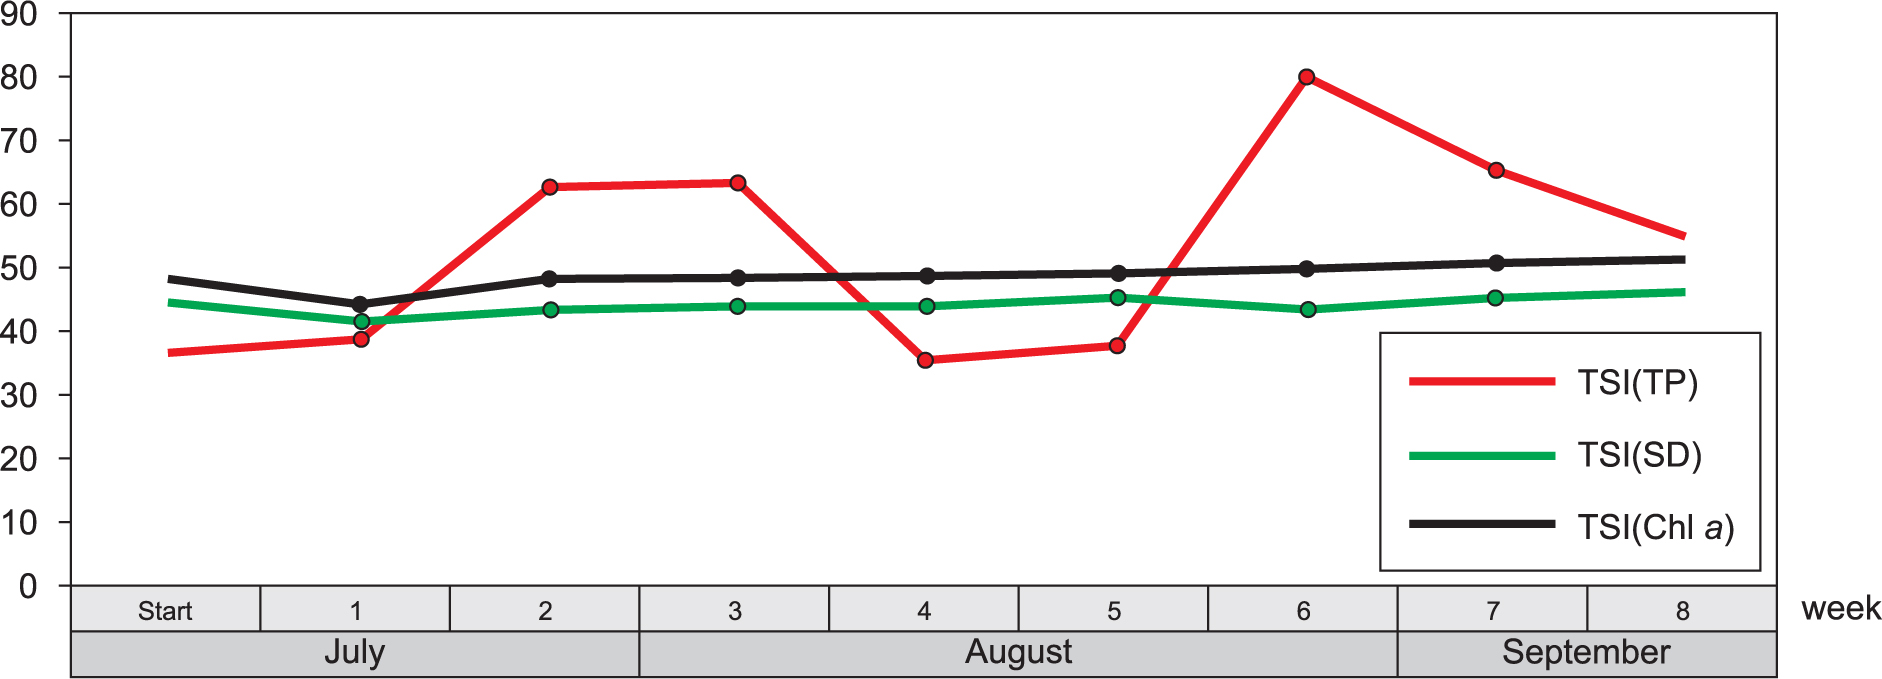
Figure 3
Carlson’s trophic state index of Lake Savsko in summer 2014
Table 1
Lakatos index – classification of the developed periphyton according to the values obtained for DM, AC and Chl a; sampling weeks are presented in the rows; the obtained results for DM, AC and Chl a types are presented in columns for each tested substrate
| Week | Glass tiles | Ceramic tiles | Willow tiles | Yew tiles | ||||||||
|---|---|---|---|---|---|---|---|---|---|---|---|---|
| DM type | AC type | Chl type | DM type | AC type | Chl type | DM type | AC type | Chl type | DM type | AC type | Chl type | |
| 1 | III | II | III | III | IV | IV | III | III | IV | III | II | IV |
| 2 | III | IV | IV | III | II | III | III | II | IV | III | II | III |
| 3 | III | II | II | III | II | II | III | IV | III | III | II | II |
| 4 | III | III | III | III | II | III | III | II | III | III | III | III |
| 5 | III | III | IV | III | II | III | III | II | II | III | III | III |
| 6 | II | II | III | III | II | III | III | II | IV | III | II | IV |
| 7 | II | II | IV | II | II | IV | III | II | III | III | II | IV |
| 8 | II | II | III | II | II | III | III | II | III | III | II | III |
Table 2
Values obtained for DM, AFDM and Chl a on each type of substrate, presented as maximum, minimum and average
| Glass tiles | Ceramic tiles | Willow tiles | Yew tiles | |||||||||
|---|---|---|---|---|---|---|---|---|---|---|---|---|
| DM g m-2 | AFDM g m-2 | Chl a mg m-2 | DM g m-2 | AFDM g m-2 | Chl a mg m-2 | DM g m-2 | AFDM g m-2 | Chl a mg m-2 | DM g m-2 | AFDM g m-2 | Chl a mg m-2 | |
| max | 27.83 | 9.50 | 9.09 | 22.77 | 9.95 | 9.09 | 16.87 | 7.87 | 10.29 | 18.56 | 6.52 | 6.86 |
| min. | 3.37 | 0.84 | 0.86 | 1.69 | 0.84 | 0.34 | 3.37 | 1.52 | 0.34 | 2.53 | 0.90 | 0.34 |
| average | 11.49 | 4.41 | 6.11 | 11.07 | 4.00 | 4.76 | 8.65 | 3.87 | 5.29 | 8.54 | 3.57 | 4.22 |
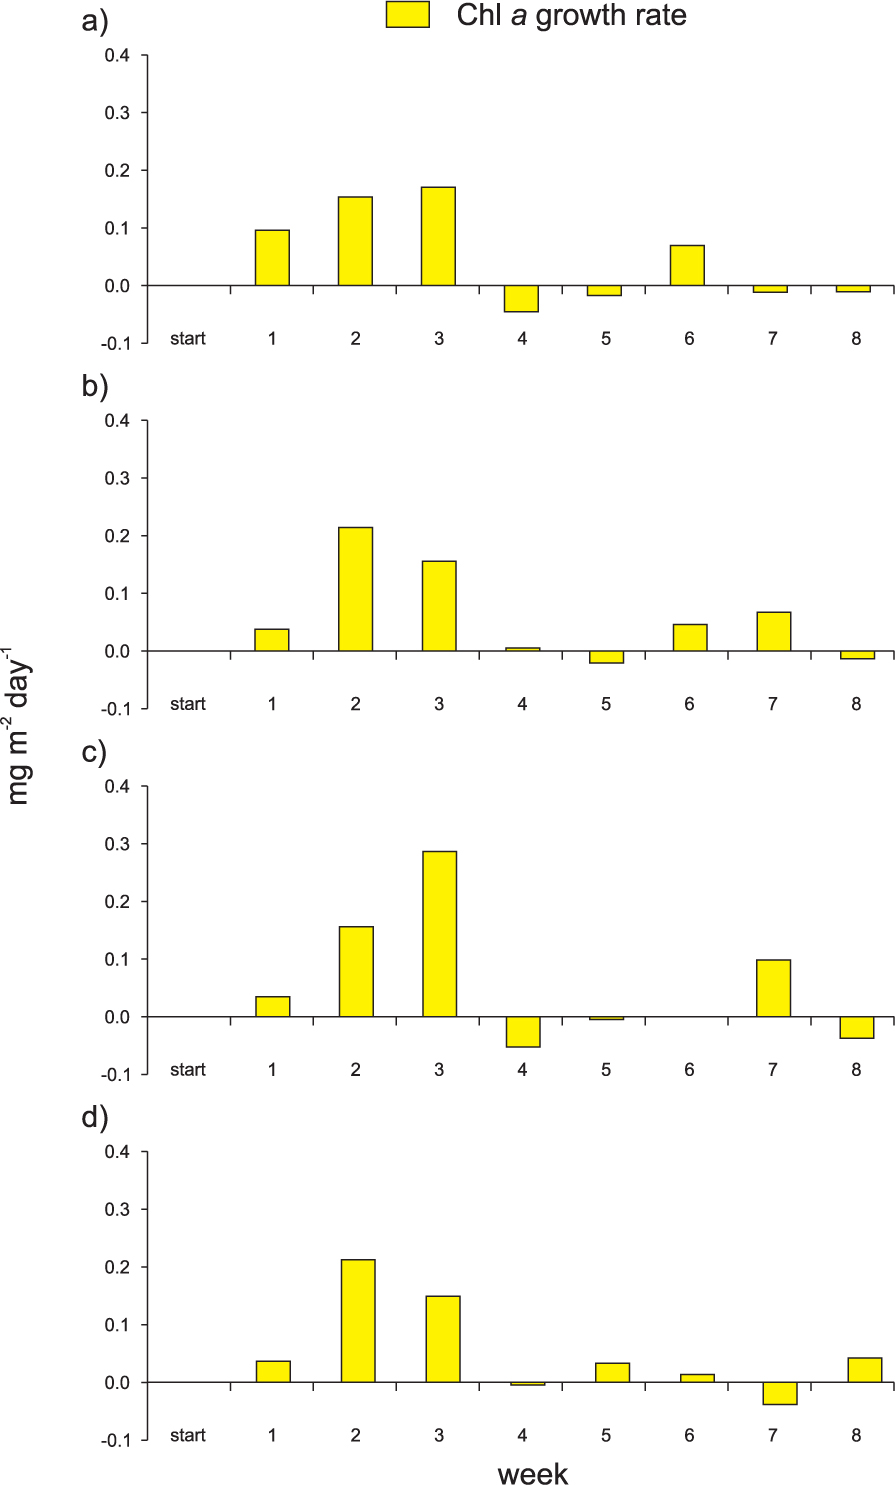
Figure 4
Periphyton photosynthetic component (Chl a) growth rate dynamics on glass (a), ceramic (b), willow (c) and yew (d) tiles
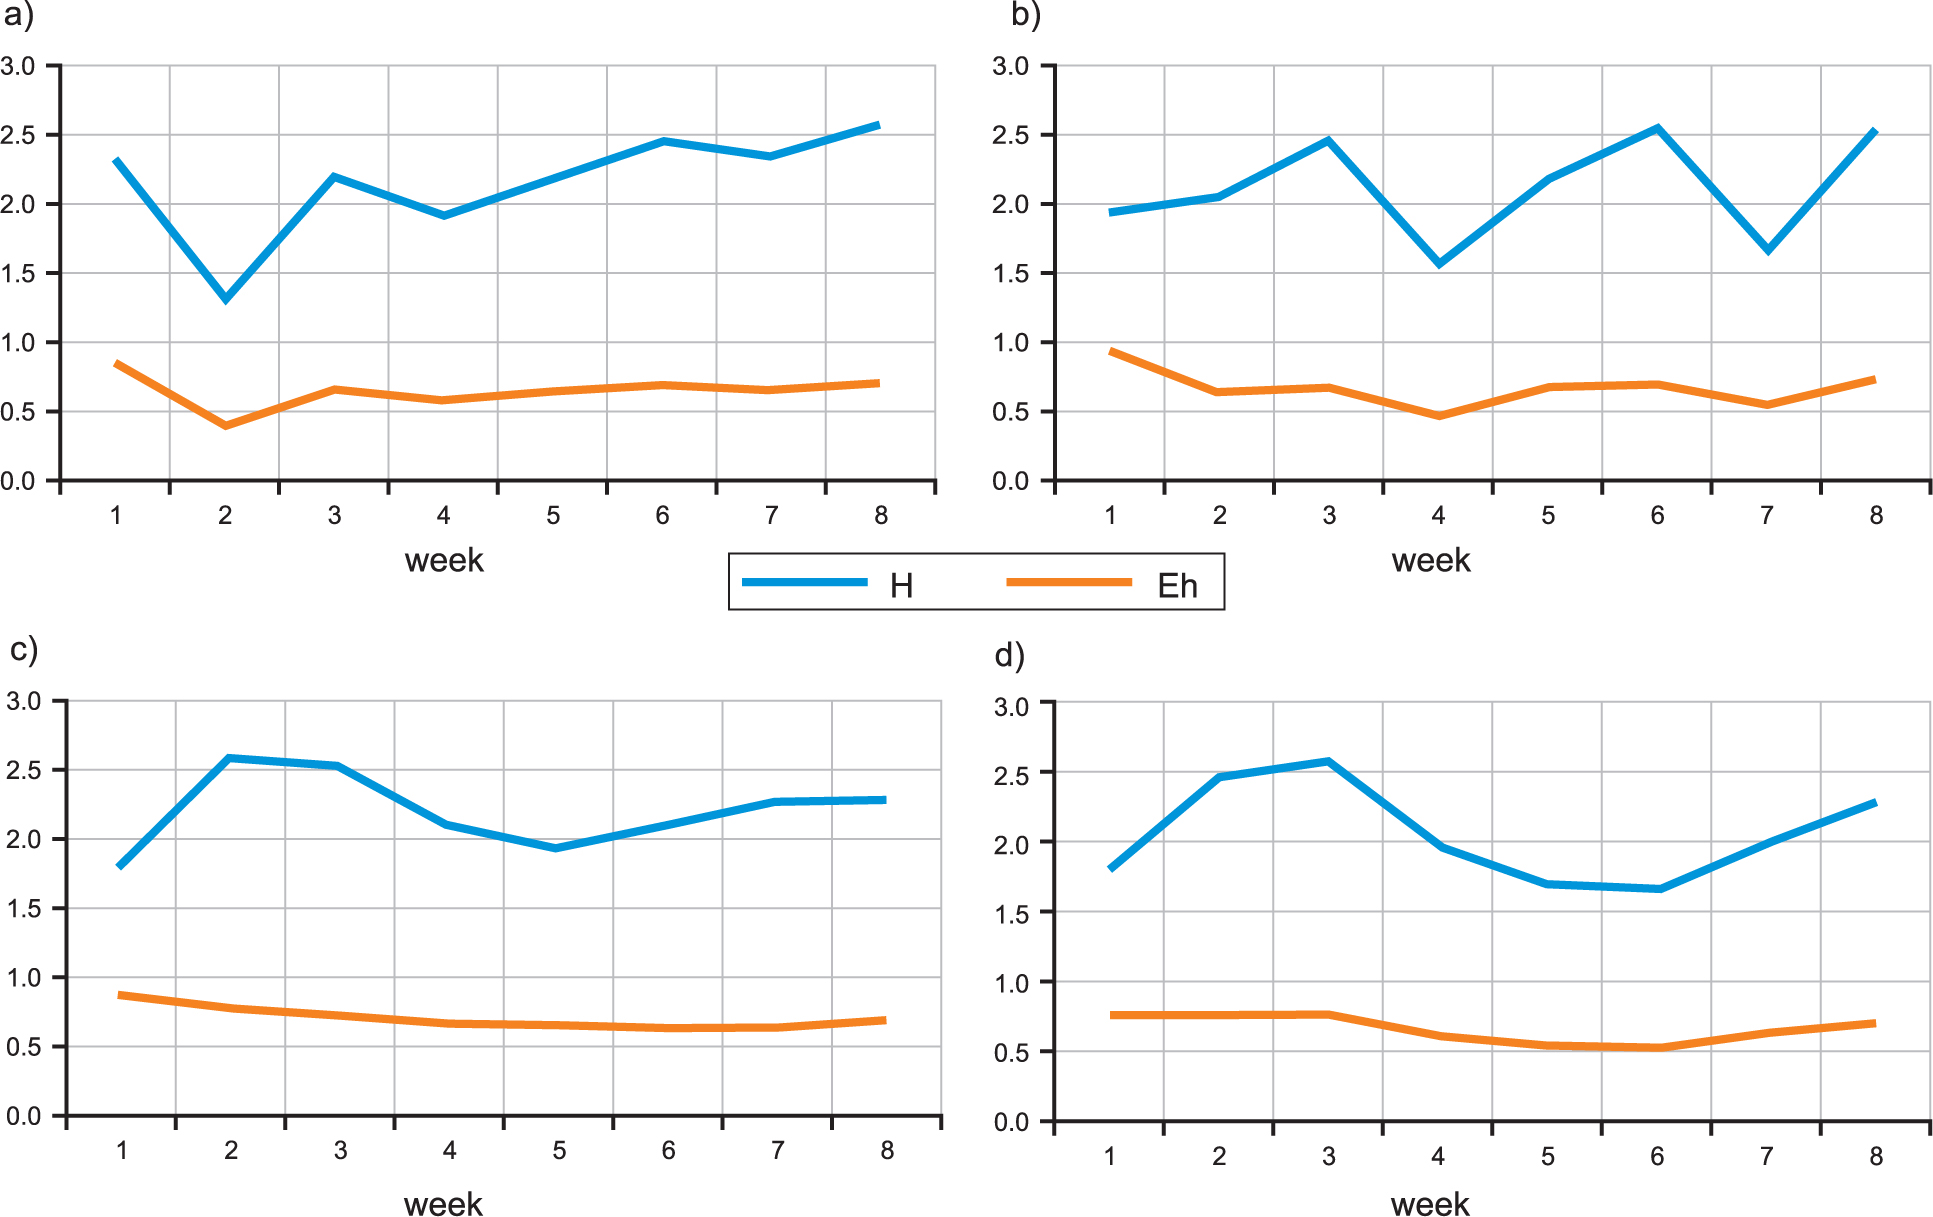
Figure 5
Shannon’s diversity index (H) and Pielou’s evenness index (Eh) on glass (a), ceramic (b), willow (c) and yew (d) tiles
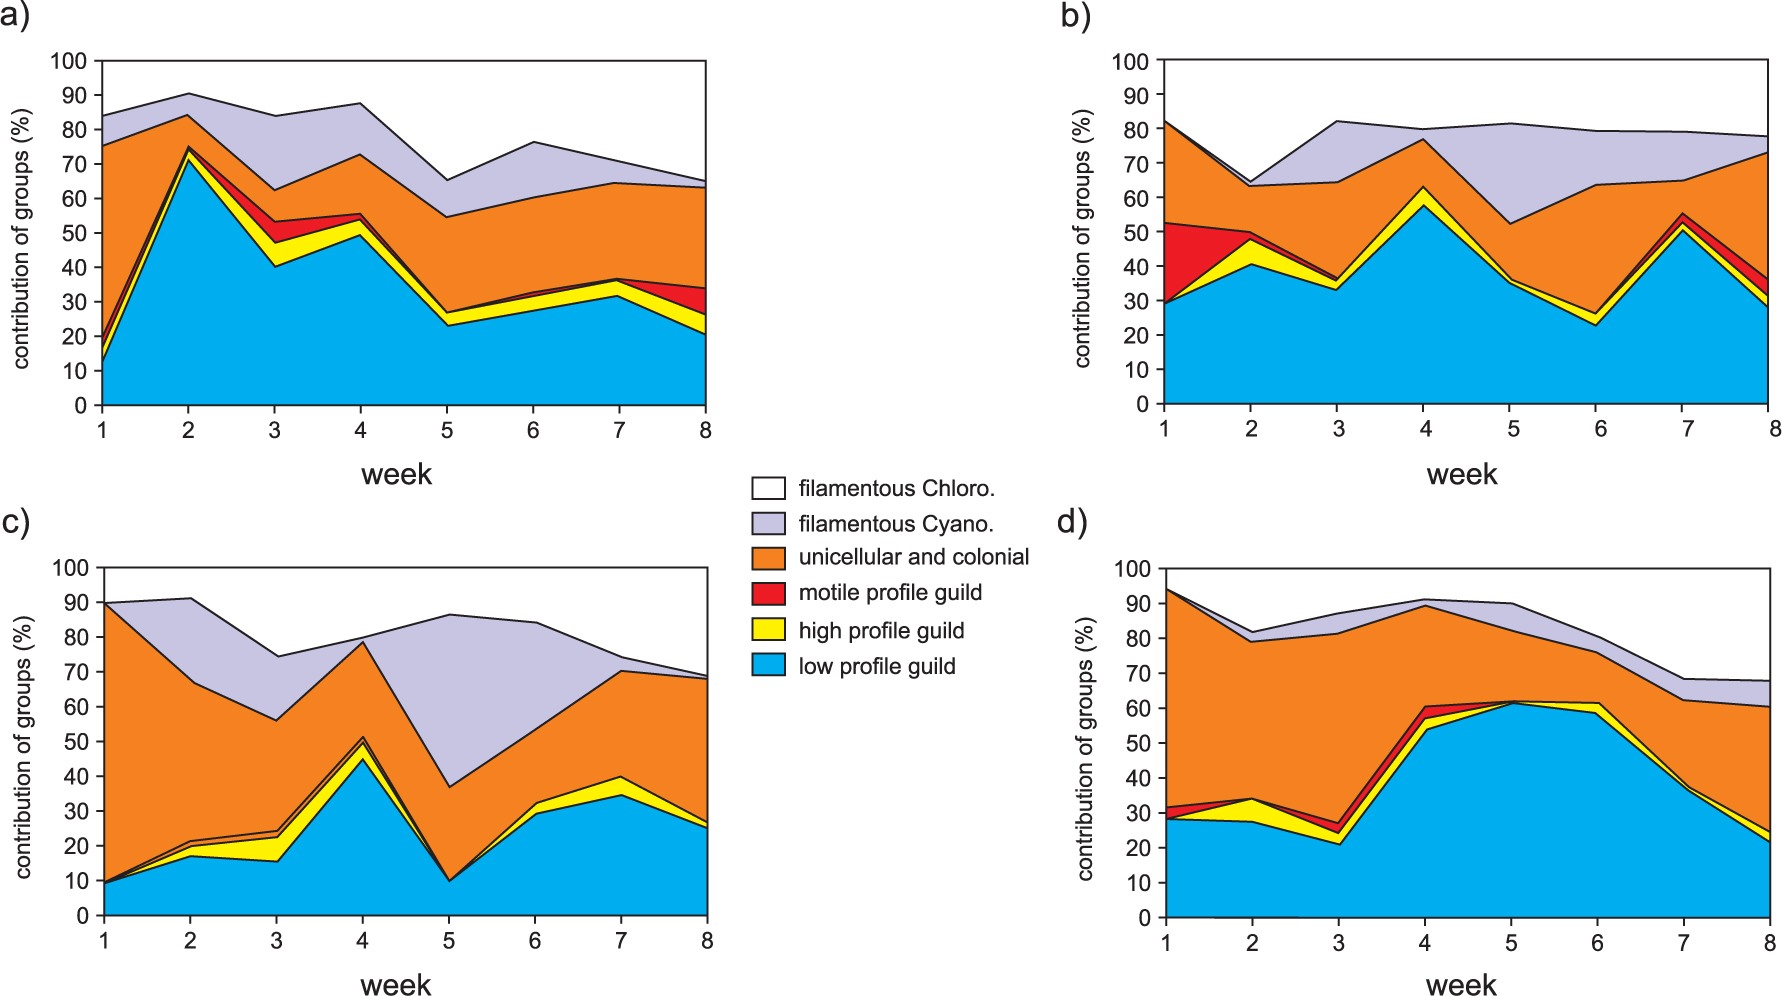
Figure 6
Percentage contribution of the ecological groups to the periphyton community during the duration of the experiment on glass (a), ceramic (b), willow (c) and yew (d) tiles
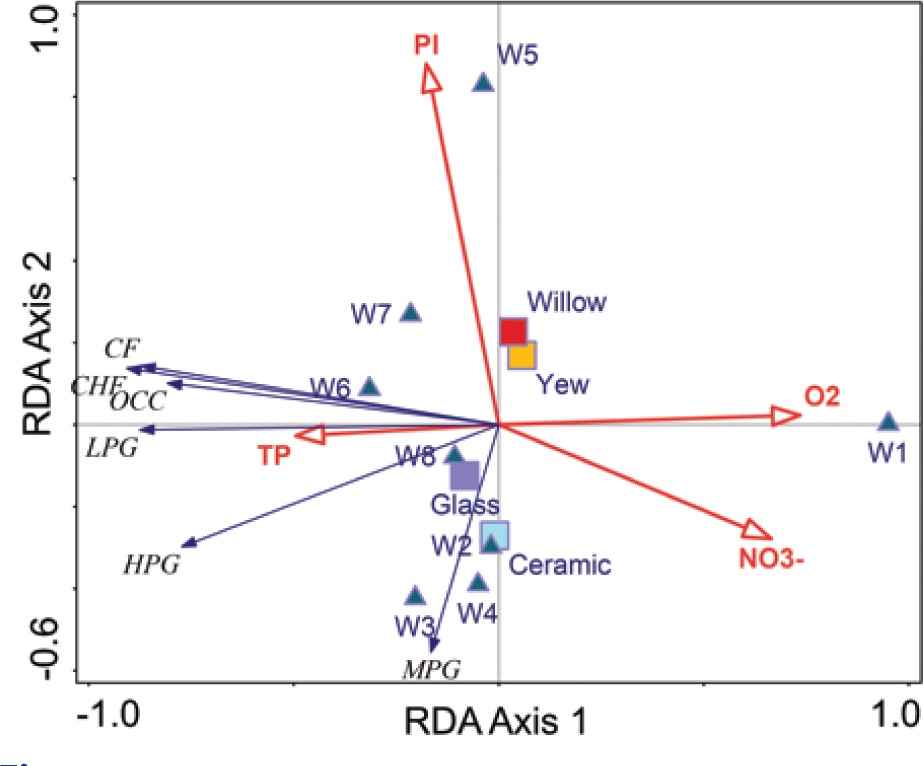
Figure 7
Relationship between the ecological groups of periphytic algae and environmental parameters Ecological groups: low profile guild (LPG), high profile guild (HPG), motile guild (MPG), unicellular and colonial (OCC), filamentous Cyanobacteria (CF) and filamentous Chlorophyta (CHF); Environmental parameters: total phosphorus (TP), nitrates (NO3 −), oxygen saturation (O2) and permanganate index (PI). Weeks of sampling (W1-W8) and substrates (Ceramic, Glass, Yew and Willow) are included as supplementary variables.