
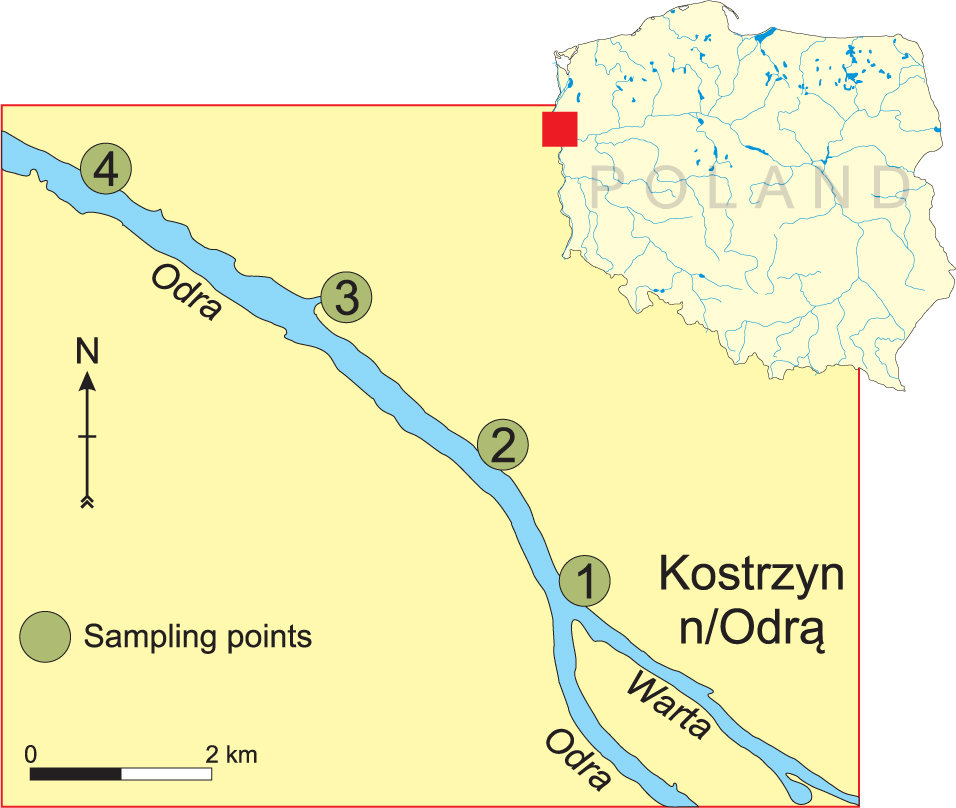
Figure 1
Distribution of sampling sites in the lower Oder River
Table 1
Biometric data of Sinanodonta woodiana in the lower Oder River
| No. | Sampling site | GPS | Average length ± SD (mm) | Average height ± SD (mm) | Average width ± SD (mm) | Average mass ± SD (g) |
|---|---|---|---|---|---|---|
| 1 | Oder/Warta D = 2.5 F = 25 | 52°35’50.37”N 14°36’46.20”E | 85.4 ± 22 | 57 ± 12 | 35.2 ± 13 | 91.6 ± 64 |
| 2 | Oder, 618 km D = 2.0 F = 25 | 52°36’44.06”N 14°35’39.23”E | 73.3 ± 10 | 49.6 ± 7 | 30.9 ± 8 | 54.6 ± 27 |
| 3 | Oxbow lake of Oder D = 0.3 F = 16 | 52°37’36.07”N 14°33’54.03”E | 100 ± NA | 66 ± NA | 36 ± NA | 115 ± NA |
| 4 | Oder, 624 km D = 2.6 F = 25 | 52°38’08.93”N 14°31’59.61”E | 95.8 ± 20 | 59.3 ± 8 | 37 ± 10 | 107 ± 60 |
D = density [ind. m-2]; F = frequency [%]; SD = standard deviation; NA = not available.
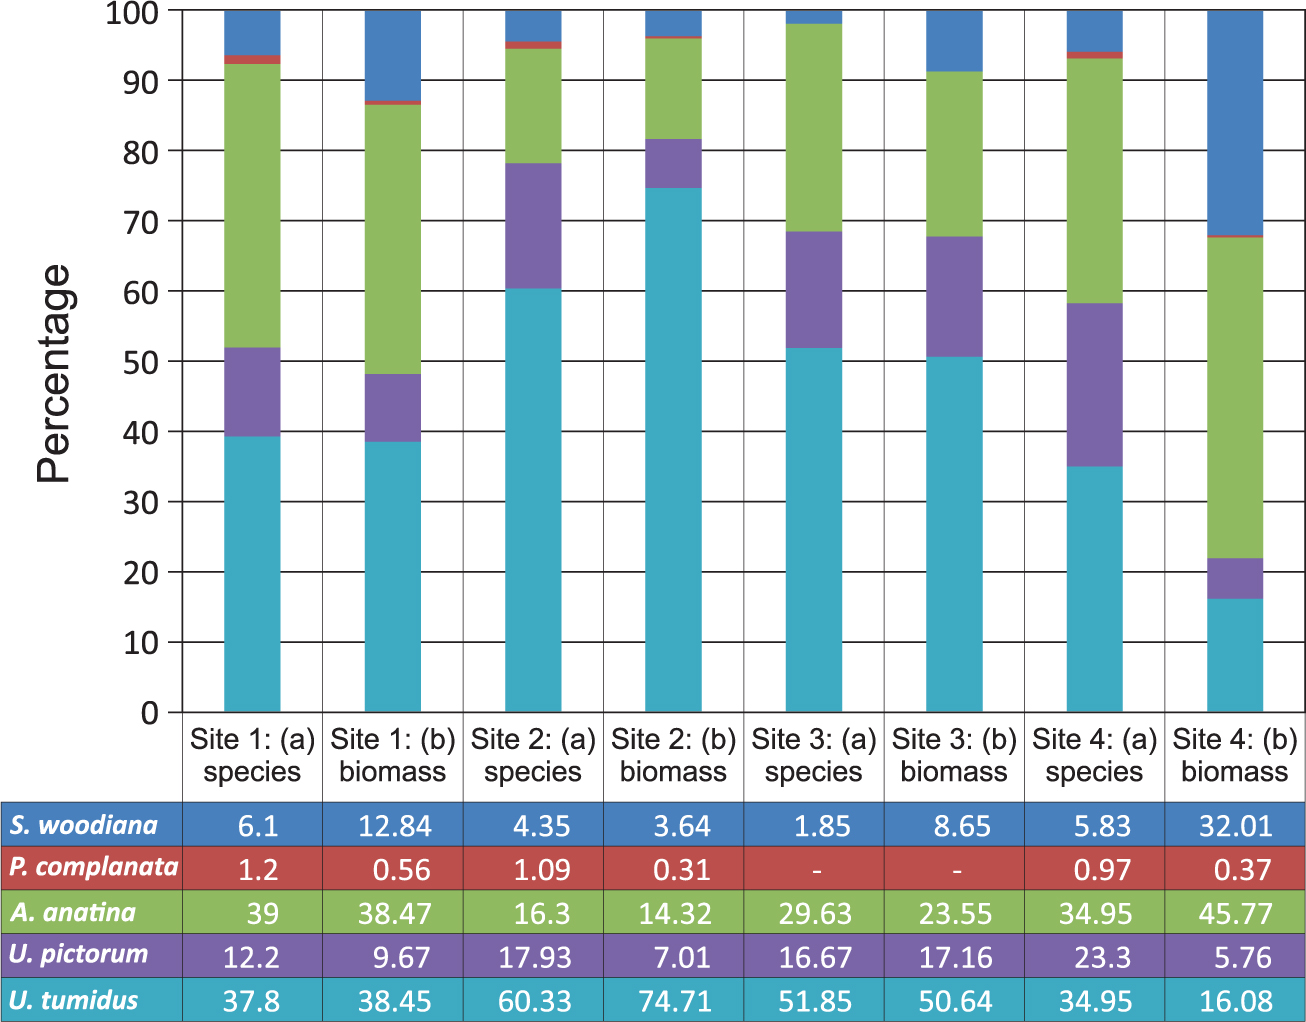
Figure 2
Percentage contribution of the number of specimens per individual species of Unionidae at the sampling sites (a) and of their biomass (b) in the lower Oder River