
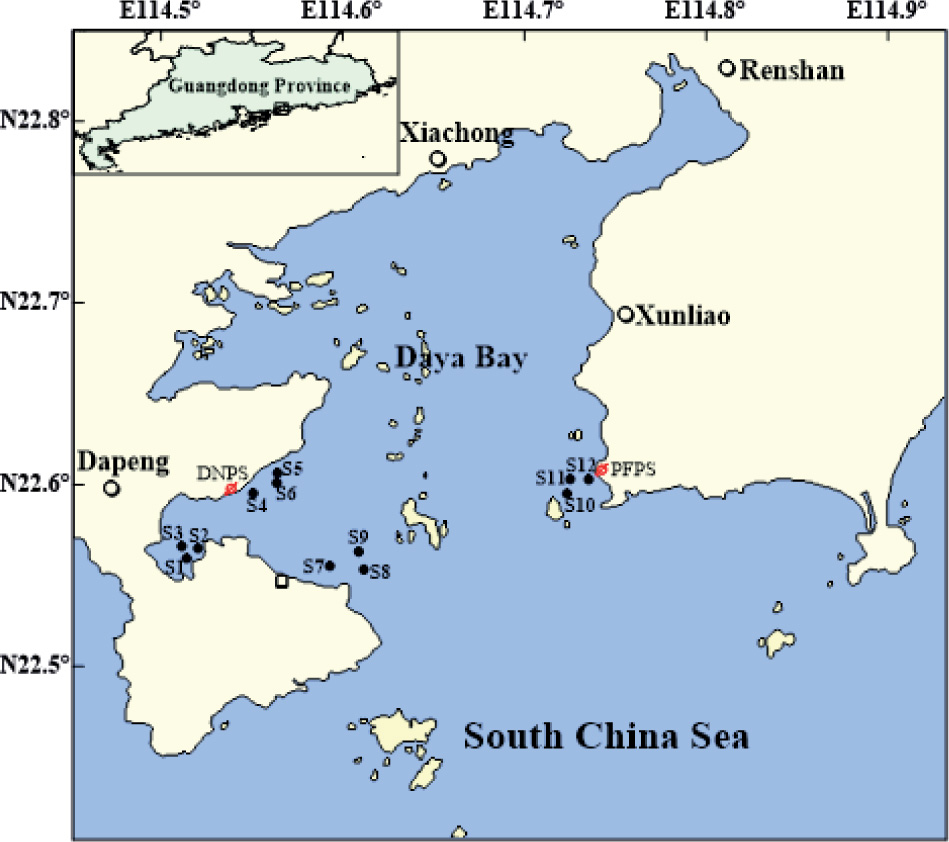
Figure 1
Location of the study area and the sampling sites of planktonic ciliates in Daya Bay
Table 1
Environmental variables for Daya Bay water samplings in winter 2013, spring, summer and autumn 2014
| Parameters | Unit | Winter | Spring | Summer | Autumn |
|---|---|---|---|---|---|
| Temp. | °C | 16.93 | 24.73 | 27.75 | 24.89 |
| Sal. | PSU | 32.83 | 31.86 | 33.94 | 33.80 |
| pH | 8.27 | 8.31 | 8.07 | 8.20 | |
| DO | mg l-1 | 7.21 | 5.98 | 5.45 | 5.46 |
| NO2- | μmol l-1 | 0.39 | 0.27 | 0.63 | 0.20 |
| NO3- | 1.57 | 1.73 | 7.05 | 2.09 | |
| NH4+ | 1.53 | 1.74 | 3.12 | 1.78 | |
| DIN | 3.49 | 3.74 | 10.8 | 4.08 | |
| PO43- | 0.29 | 0.20 | 0.41 | 0.22 | |
| Chl a | μg l-1 | 1.78 | 2.07 | 3.92 | 2.48 |
Table 2
List of ciliate species encountered in Daya Bay
| Ciliate species | |||
|---|---|---|---|
| 1 | Amphorellopsis acuta | 22 | Tintinnopsis schotti |
| 2 | Codonellopsis morchella | 23 | Tintinnopsis tentaculata |
| 3 | Codonellopsis ostenfeldi | 24 | Tintinnopsis tubulosa |
| 4 | Dadayiella ganymedes | 25 | Tintinnopsis turgida |
| 5 | Eutintinnus fraknoii | 26 | Tintinnopsis vosmaeri |
| 6 | Eutintinnus stramentus | 27 | Wangiella dicollaria |
| 7 | Favella companula | 28 | Helicostomella longa |
| 8 | Leprotintinnus nordqvisti | 29 | Strombidium conicum |
| 9 | Leprotintinnus simplex | 30 | Strombidium globosaneum |
| 10 | Salpingacantha minutissima | 31 | Strombidium major |
| 11 | Metacylis tropica | 32 | Strombidium sp. |
| 12 | Metacylis oviformis | 33 | Spirotontonia turbinata |
| 13 | Stenosemella pacifica | 34 | Laboea strobila |
| 14 | Tintinnopsis minuta | 35 | Euplotes eurystomus |
| 15 | Tintinnopsis radix | 36 | Mesodinium rubrum |
| 16 | Tintinnopsis tocantinencis | 37 | Didinium nasufum |
| 17 | Tintinnopsis beroidea | 38 | Lacrymaria sp. |
| 18 | Tintinnopsis butschlii | 39 | Amphileptus sp. |
| 19 | Tintinnopsis corniger | 40 | Cyclidium sp. |
| 20 | Tintinnopsis digita | 41 | Prorodon sp. |
| 21 | Tintinnopsis nucula | ||
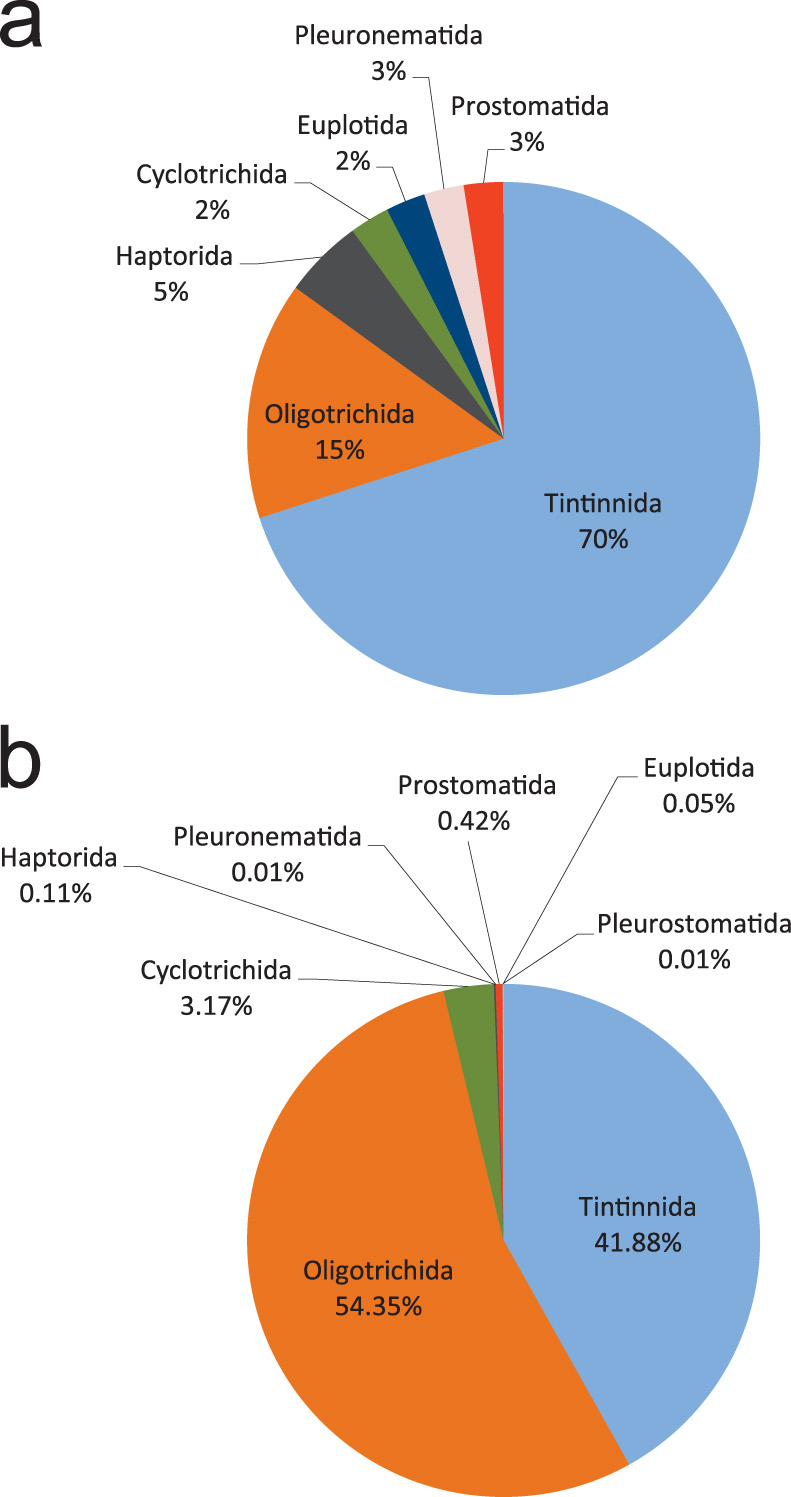
Figure 2
Proportions of the number of species (a) and abundance (b) of planktonic ciliates in Daya Bay
Table 3
Dominant ciliate species in each season in Daya Bay (species dominance, Y ≥ 0.02)
| Dominant species | Y | |||
|---|---|---|---|---|
| Winter | Spring | Summer | Autumn | |
| Tintinnopsis minuta | 0.5716 | - | - | 0.0215 |
| Tintinnopsis beroidea | 0.0863 | - | - | - |
| Strombidium conicum | 0.0387 | 0.4583 | 0.0336 | 0.1792 |
| Strombidium globosaneum | 0.1165 | 0.0538 | 0.0413 | 0.1481 |
| Spirotontonia turbinata | - | 0.3678 | 0.0656 | 0.0443 |
| Laboea strobila | - | 0.0687 | - | - |
| Amphorellopsis acuta | - | - | 0.1321 | - |
| Eutintinnus stramentus | - | - | 0.0407 | - |
| Tintinnopsis tocantinencis | - | - | 0.0200 | 0.0447 |
| Tintinnopsis corniger | - | - | 0.0235 | - |
| Helicostomella longa | - | - | 0.3221 | - |
| Tintinnopsis nucula | - | - | - | 0.0937 |
| Wangiella dicollaria | - | - | - | 0.0507 |
| Mesodinium rubrum | - | - | - | 0.0948 |
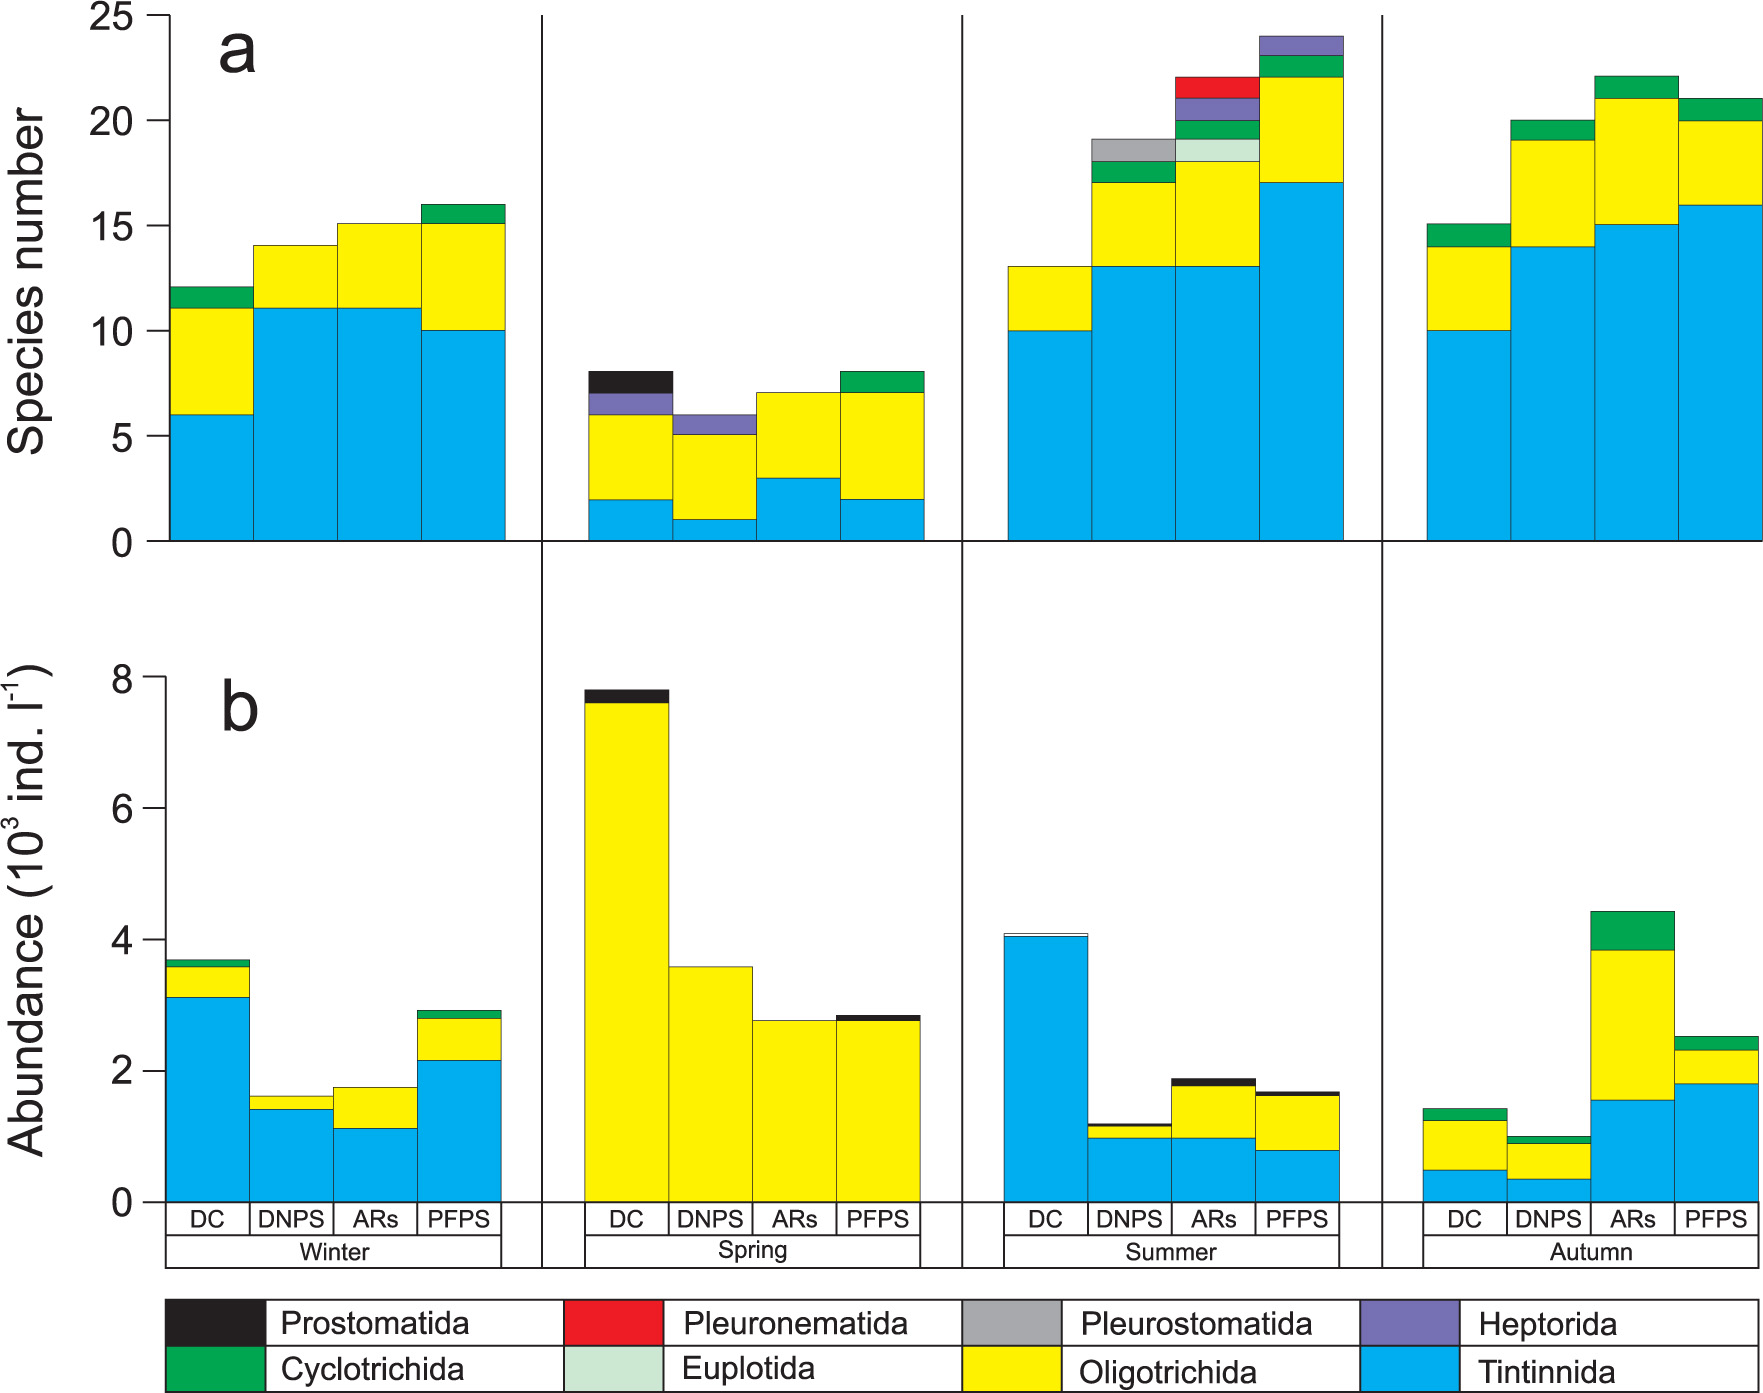
Figure 3
Variation in the number of species (a) and abundance (b) of planktonic ciliates in Daya Bay
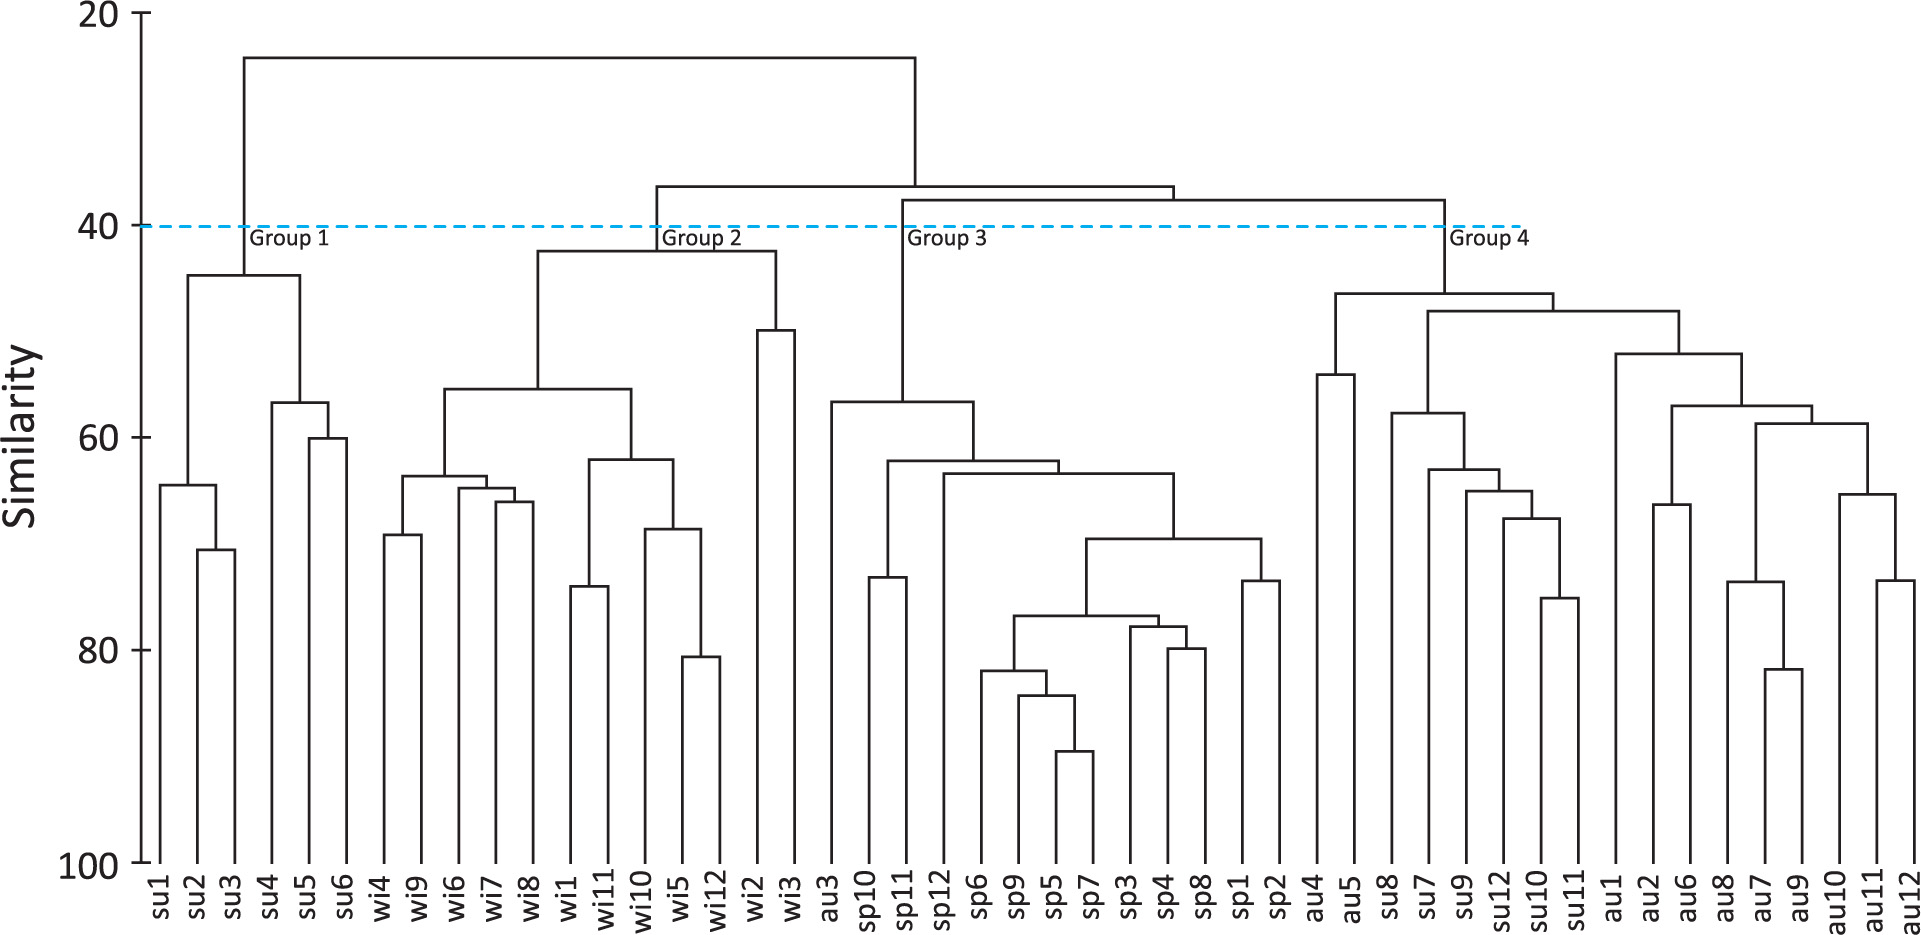
Figure 4
Cluster analysis of ciliate communities on the Bray-Curtis similarity matrix from the fourth-root transformed biotic data of 48 surface samples from Daya Bay. Wi: winter; Sp: spring; Su: summer; Au: autumn
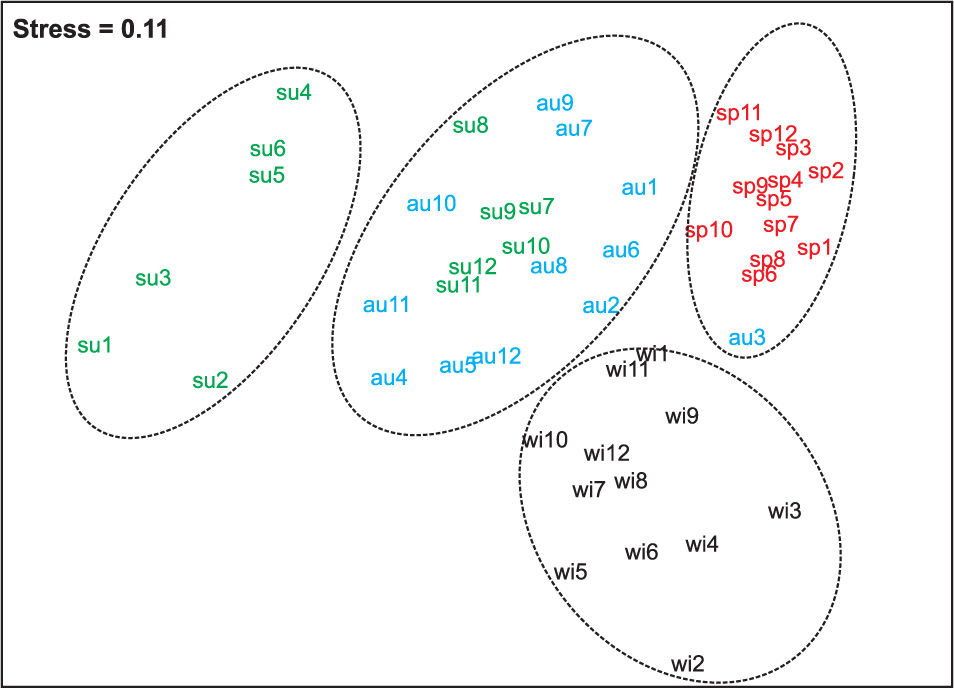
Figure 5
Multidimensional scaling (MDS) analysis of ciliate communities on the Bray-Curtis similarity matrix from the fourth-root transformed biotic data of 48 surface samples in Daya Bay. Wi: winter; Sp: spring; Su: summer; Au: autumn
Table 4
Summary of results from biota-environment (BIOENV) analysis, with the top ten correlations corresponding to different variables (R is Spearman correlation coefficient)
| Rank | R | Environmental variables |
|---|---|---|
| 1 | 0.391 | Sal., pH |
| 2 | 0.388 | Sal., NO2-, NO3-, NH4+, PO43- |
| 3 | 0.387 | DO, NO2-, NO3-, NH4+, PO43- |
| 4 | 0.386 | Temp., Sal., pH |
| 5 | 0.386 | Temp., NO2-, NO3-, NH4+, PO43- |
| 6 | 0.386 | Sal., DO, NO2-, NO3-, PO43- |
| 7 | 0.384 | pH, NO2-, NO3-, NH4+, PO43- |
| 8 | 0.384 | Sal., pH, NO2-, NO3-, PO43- |
| 9 | 0.383 | Temp., Sal., NO2-, NO3-, PO43- |
| 10 | 0.383 | pH, DO, NO2-, NO3-, PO43- |
Table 5
Correlation between environmental variables and ciliate abundance (N), the number of species (S) in four seasons in Daya Bay
| parameters | Winter | Spring | Summer | Autumn | ||||
|---|---|---|---|---|---|---|---|---|
| N | S | N | S | N | S | N | S | |
| Temp. | -0.448 | 0.088 | 0.374 | -0.181 | 0.282 | -0.751** | -0.470 | -0.083 |
| Sal. | -0.606* | 0.441 | -0.840** | -0.103 | 0.881** | -0.720** | 0.231 | 0.431 |
| pH | 0.748** | -0.537 | -0.448 | -0.061 | 0.342 | -0.241 | 0.309 | -0.169 |
| DO | 0.672* | -0.352 | -0.379 | -0.330 | 0.757** | -0.560 | -0.214 | -0.064 |
| NO2- | -0.469 | 0.454 | 0.331 | -0.088 | 0.772** | -0.549 | 0.499 | 0.395 |
| NO3- | -0.489 | 0.185 | 0.341 | -0.02 | -0.346 | 0.049 | -0.161 | -0.511 |
| NH4+ | -0.113 | 0.543 | 0.434 | -0.105 | -0.088 | 0.225 | 0.590* | 0.688* |
| DIN | -0.484 | 0.247 | 0.468 | -0.091 | 0.179 | -0.155 | 0.474 | 0.338 |
| PO43- | -0.329 | 0.693* | 0.547 | -0.165 | 0.677** | -0.278 | -0.423 | -0.794** |
| Chl a | 0.395 | 0.179 | 0.244 | 0.432 | 0.026 | 0.047 | -0.065 | -0.298 |
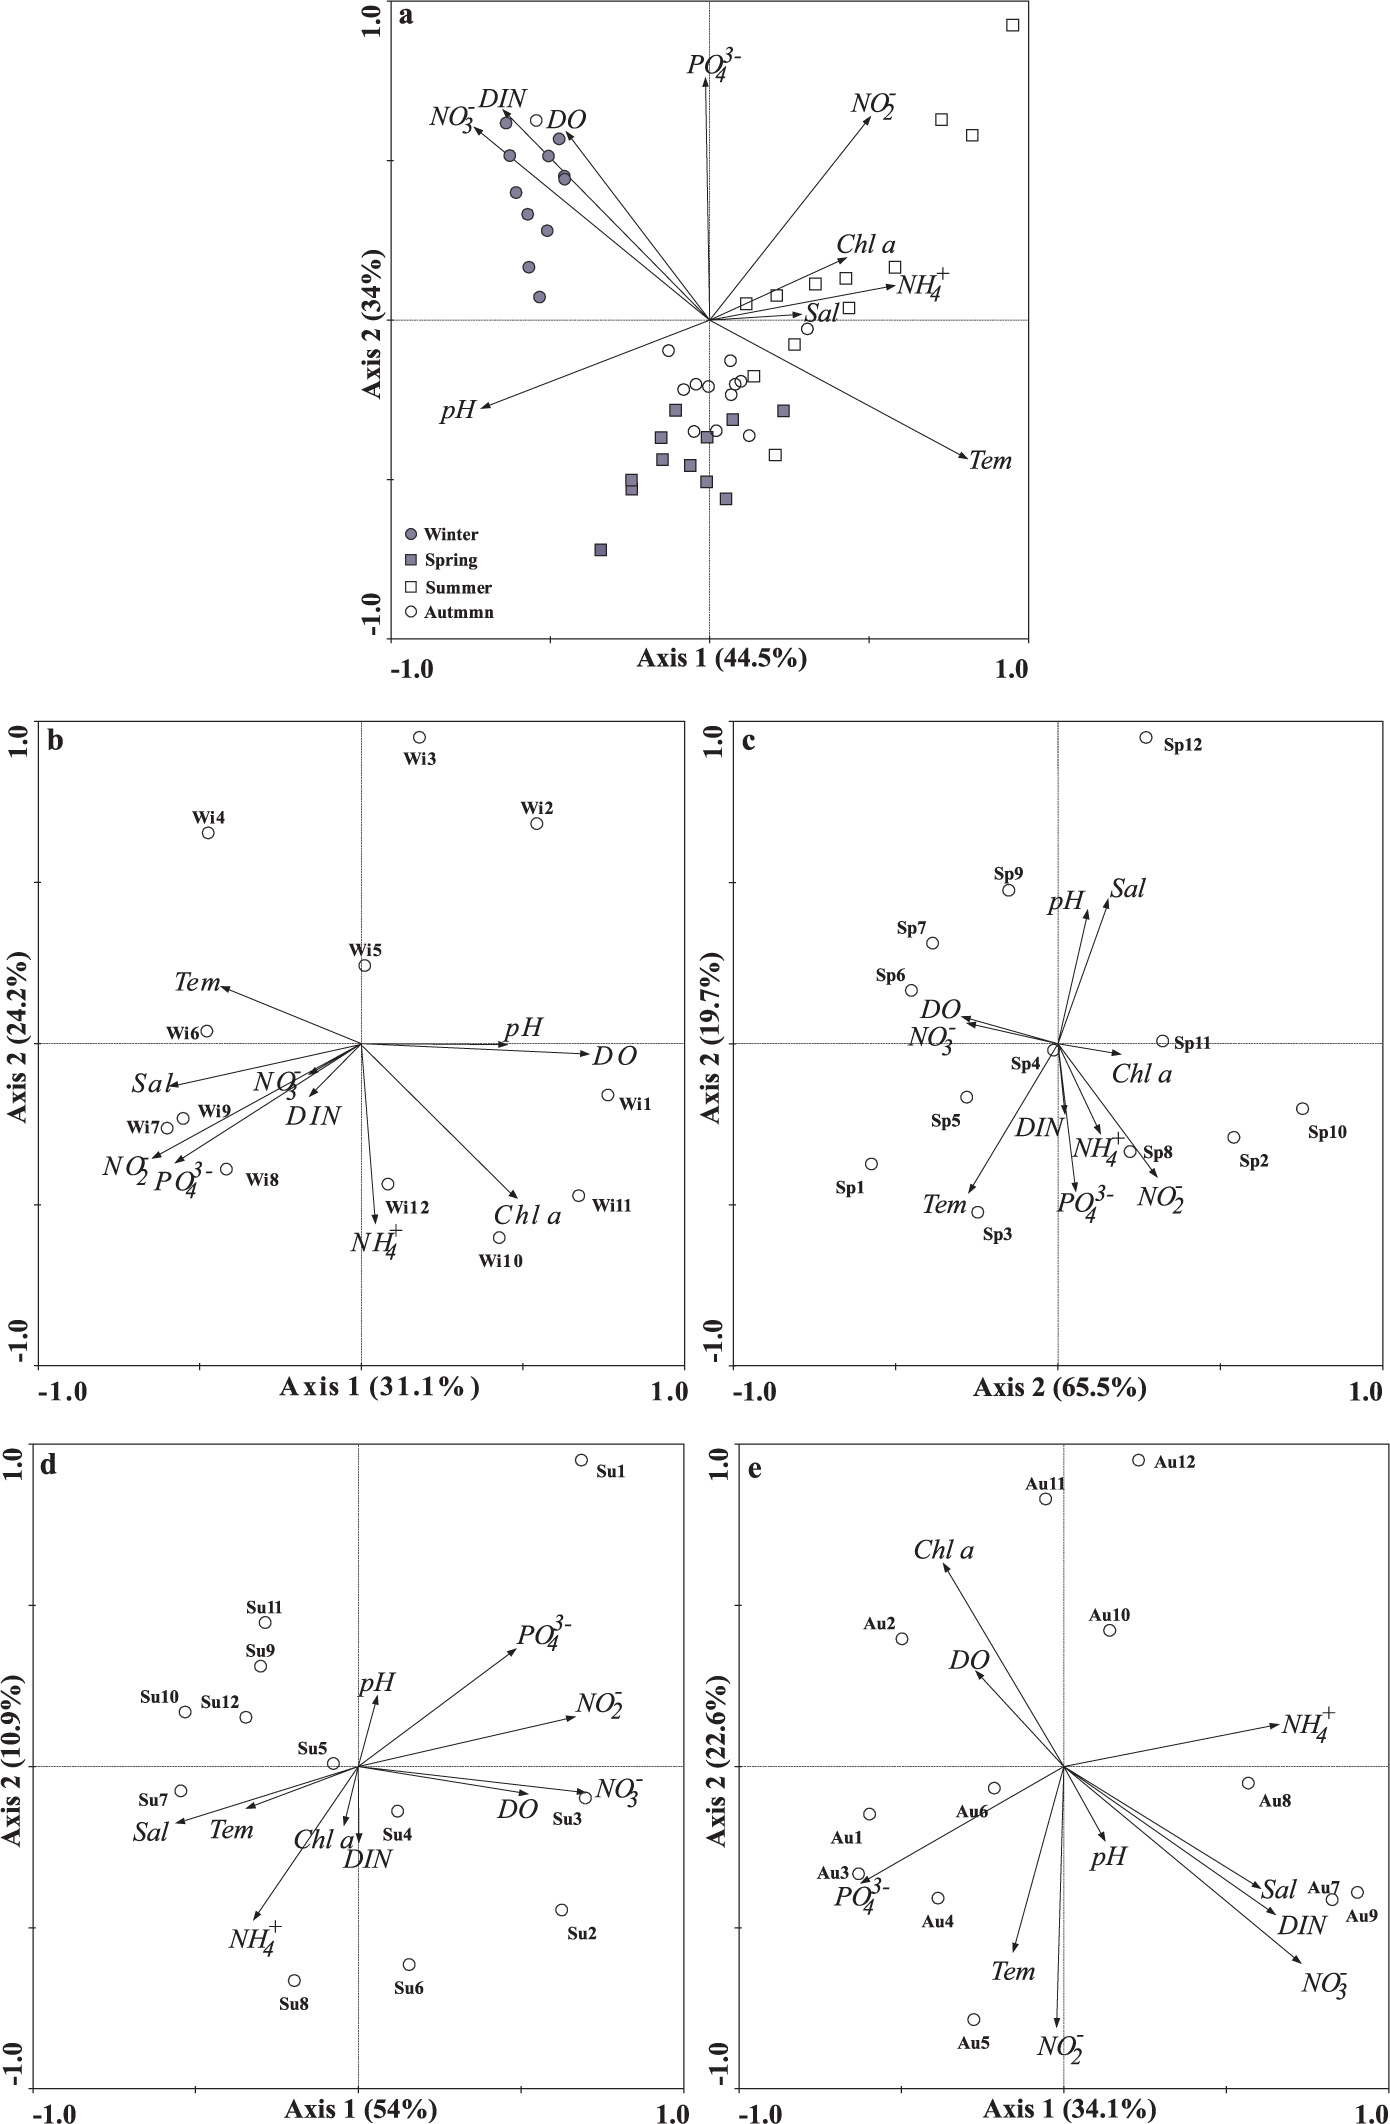
Figure 6
Canonical Correspondence Analysis (CCA) and Redundancy Analysis (RDA) ordination plots show the relationship between ciliate communities and environmental factors during four seasons (a), in winter (b), in spring (c), in summer (d) and in autumn (e). The length of vectors indicates the marginal effects of environmental variables they represent. The sample points can be projected perpendicularly onto the line overlaying the arrow of a given environmental variable. The sample points are arranged according to the predicated increase in values of a given environmental variable and the predicted increase occurs in the direction indicated by the arrow. (a) expresses mainly seasonal variation in ciliate communities in relation to environmental factors. (b)-(e) express spatial variation in ciliate communities in each season in relation to environmental factors. Wi: winter; Sp: spring; Su: summer; Au: autumn