
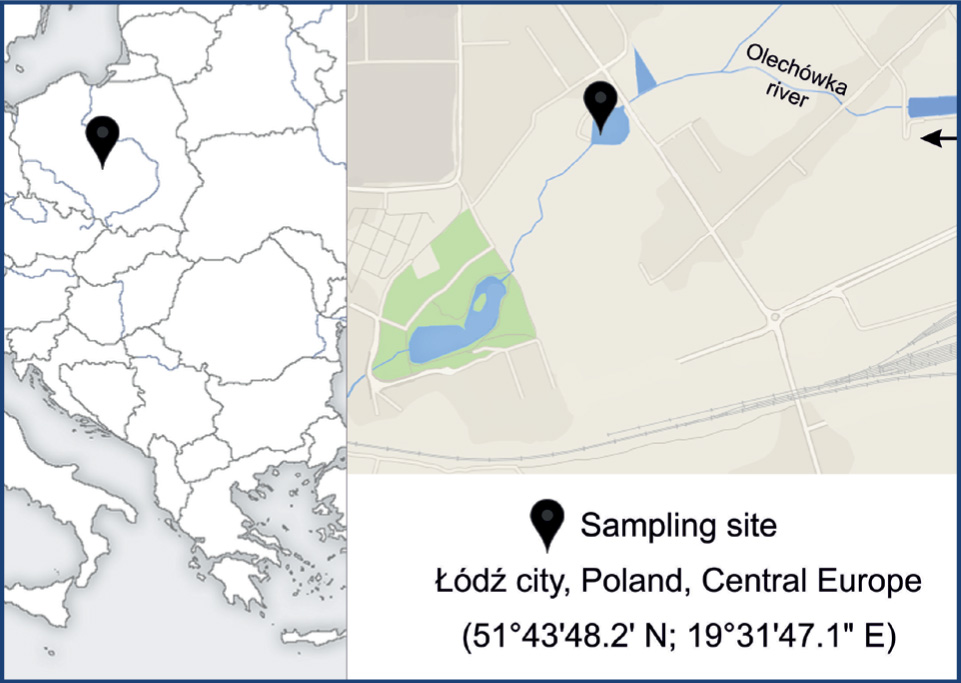
Figure 1
Location of the flow-through reservoir with Pleodorina indica (Iyengar) Nozaki
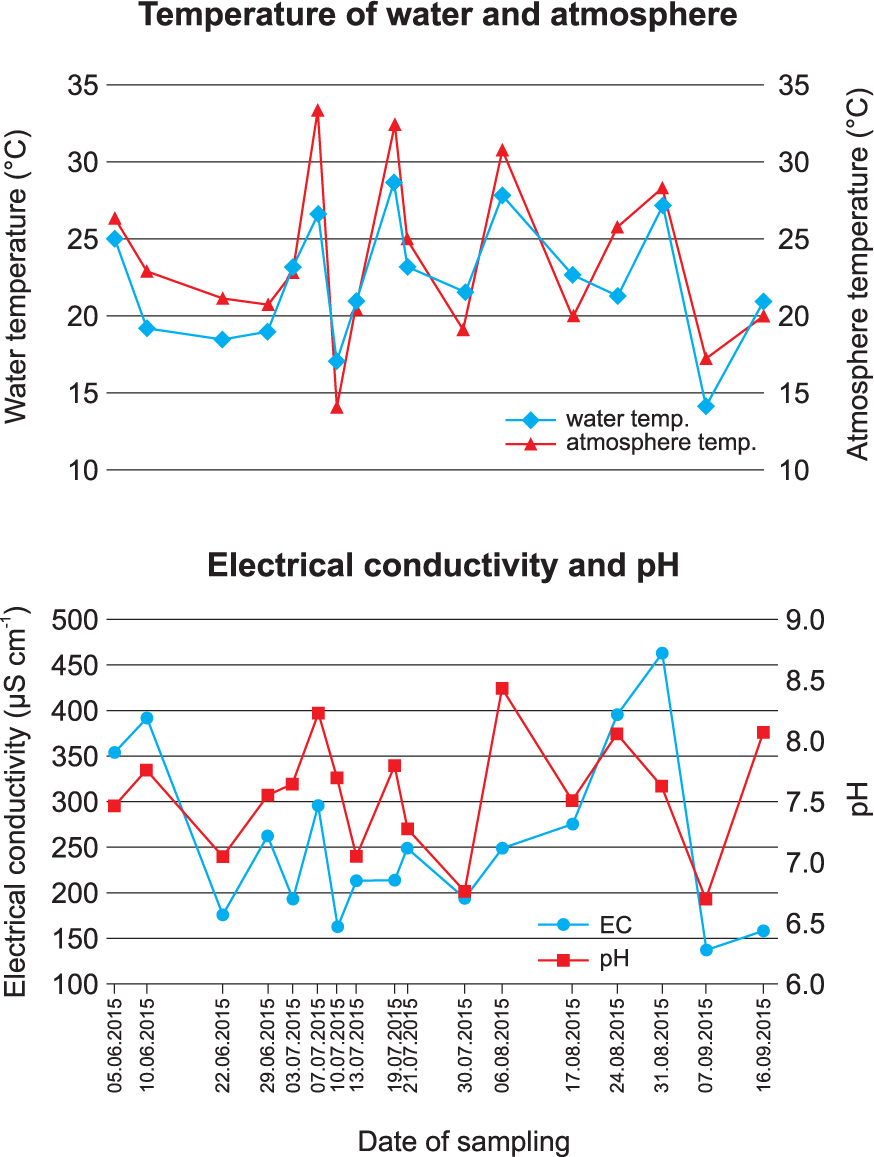
Figure 2
Air and water temperature, pH reaction and conductivity at the sampling site during the study
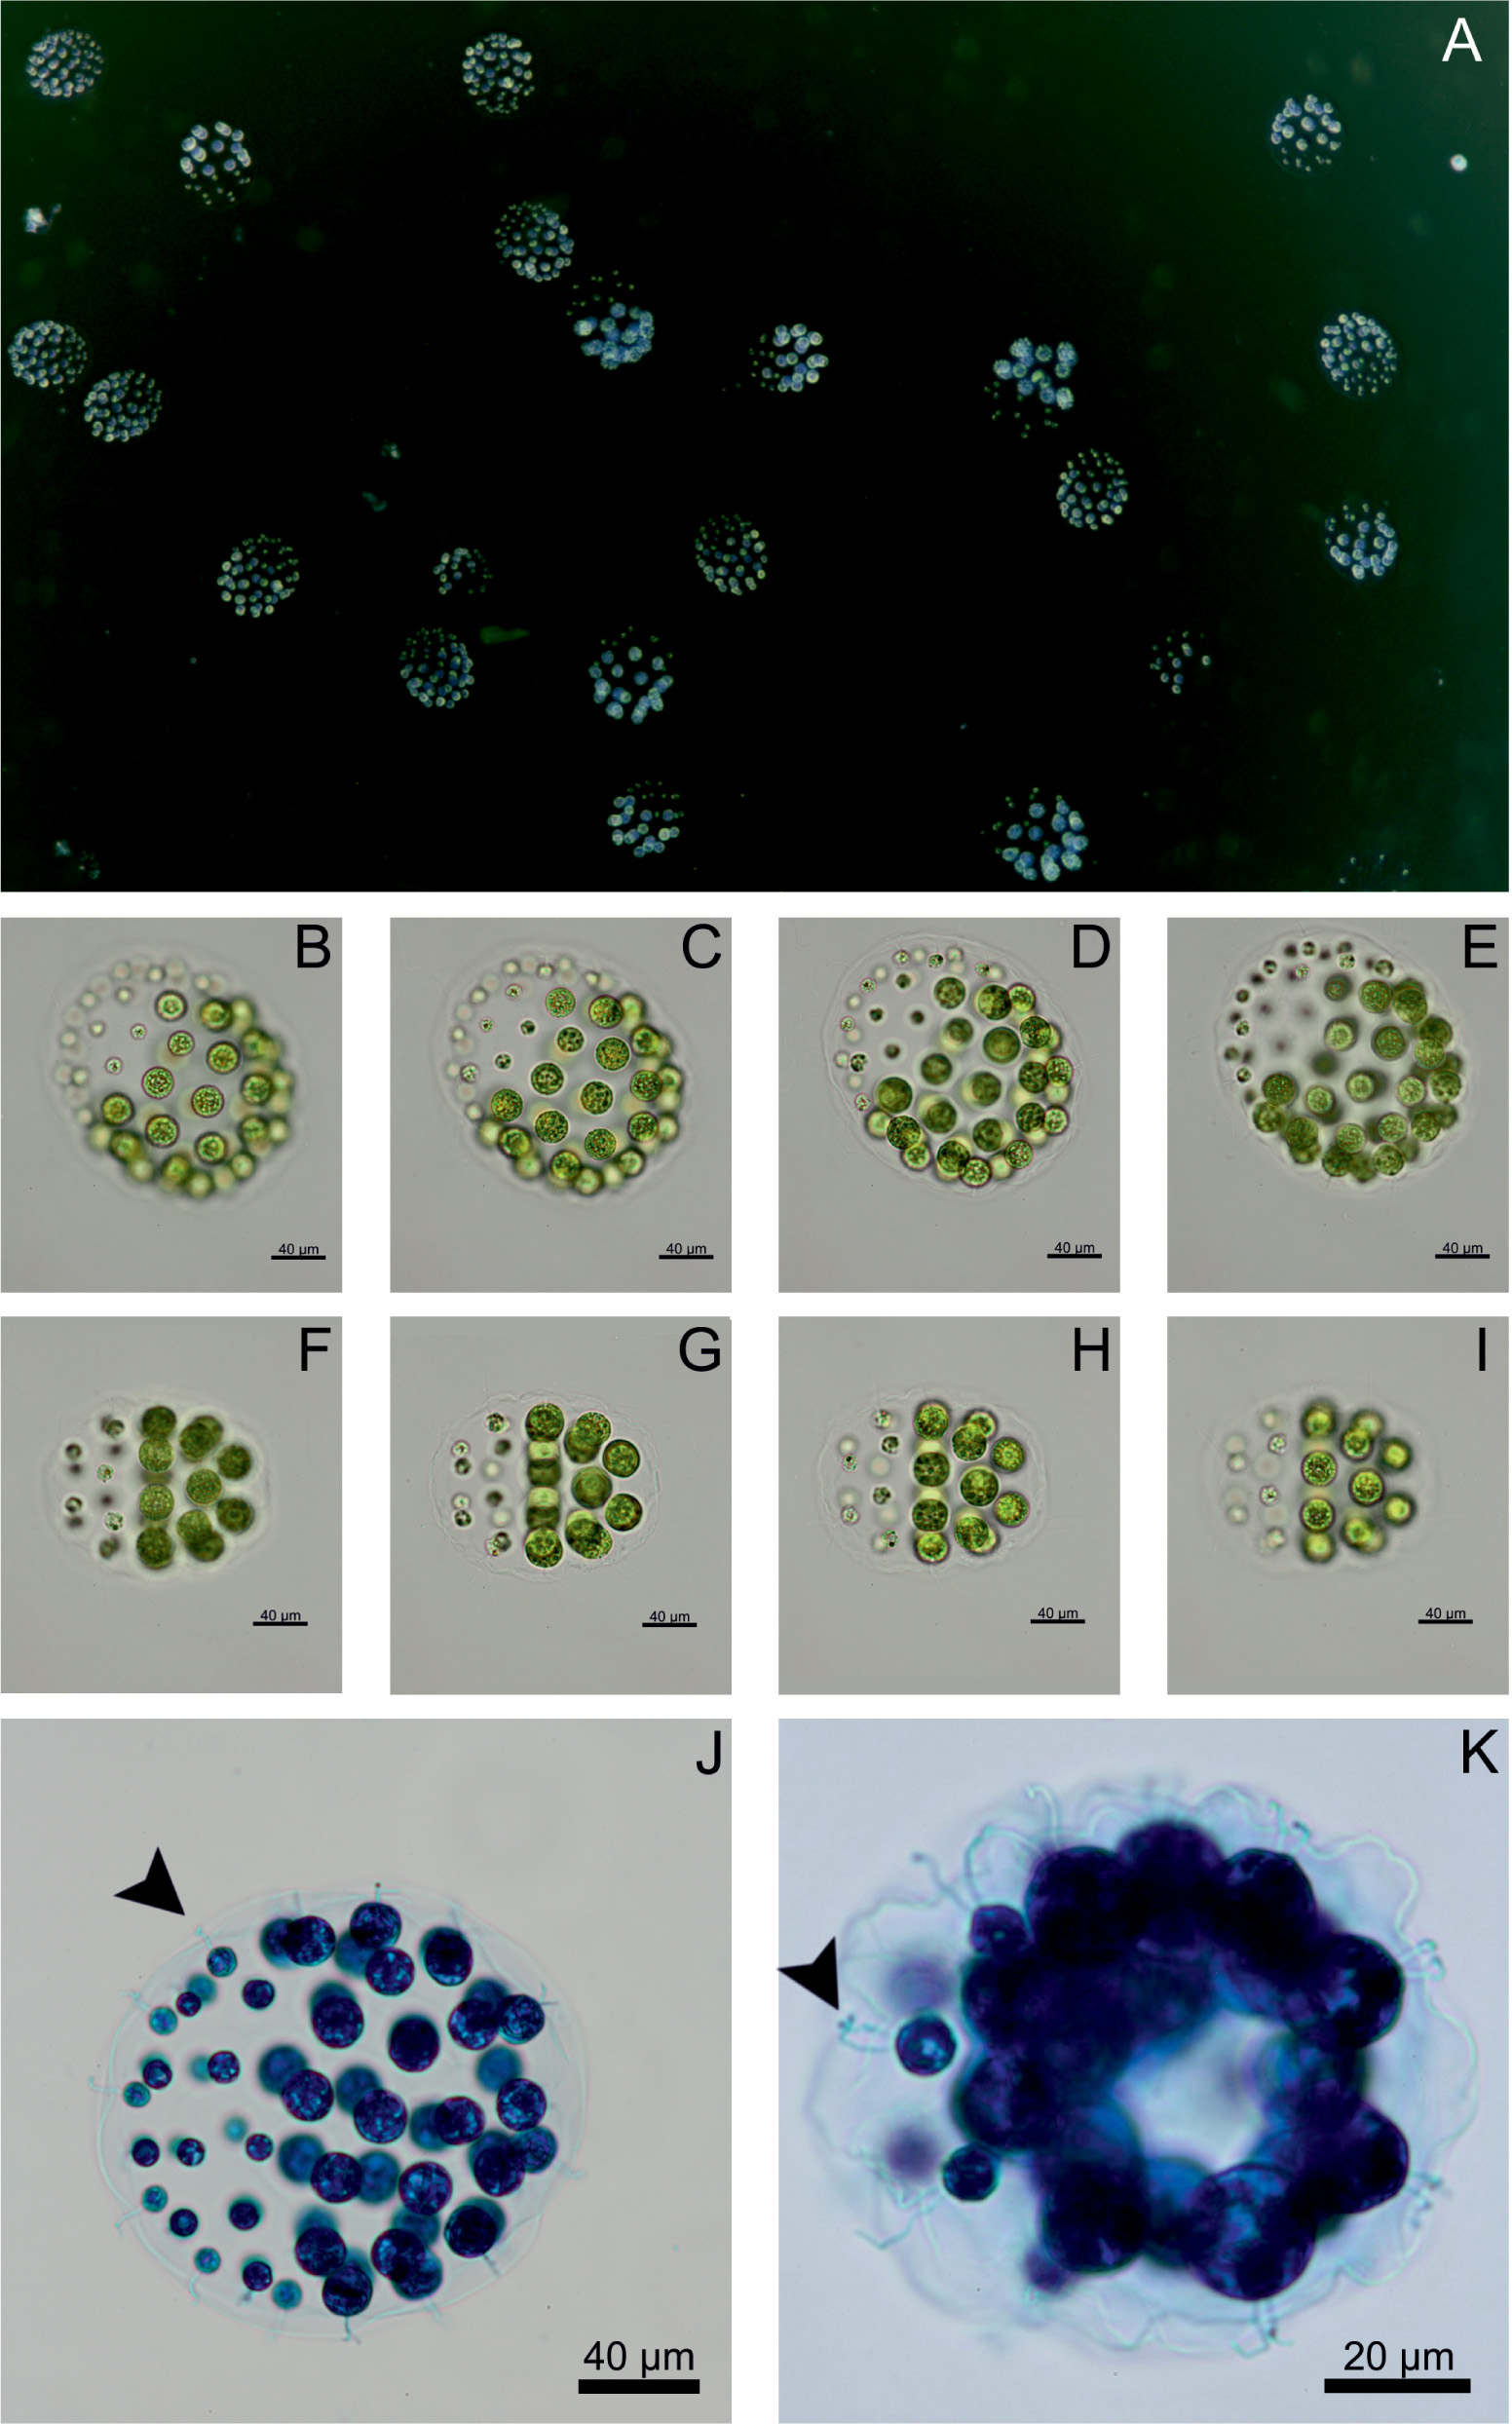
Figure 3
Pleodorina indica (Iyengar) H. Nozaki (A-K) Light microscope, Nikon Eclipse 50i (A) Dark field view, monoculture colony, magnification 10×4; (B-I) magnification 10×40; (J, K) arrows indicate flagellum, colony stained with blue methylene, magnification 10×40, 10×100
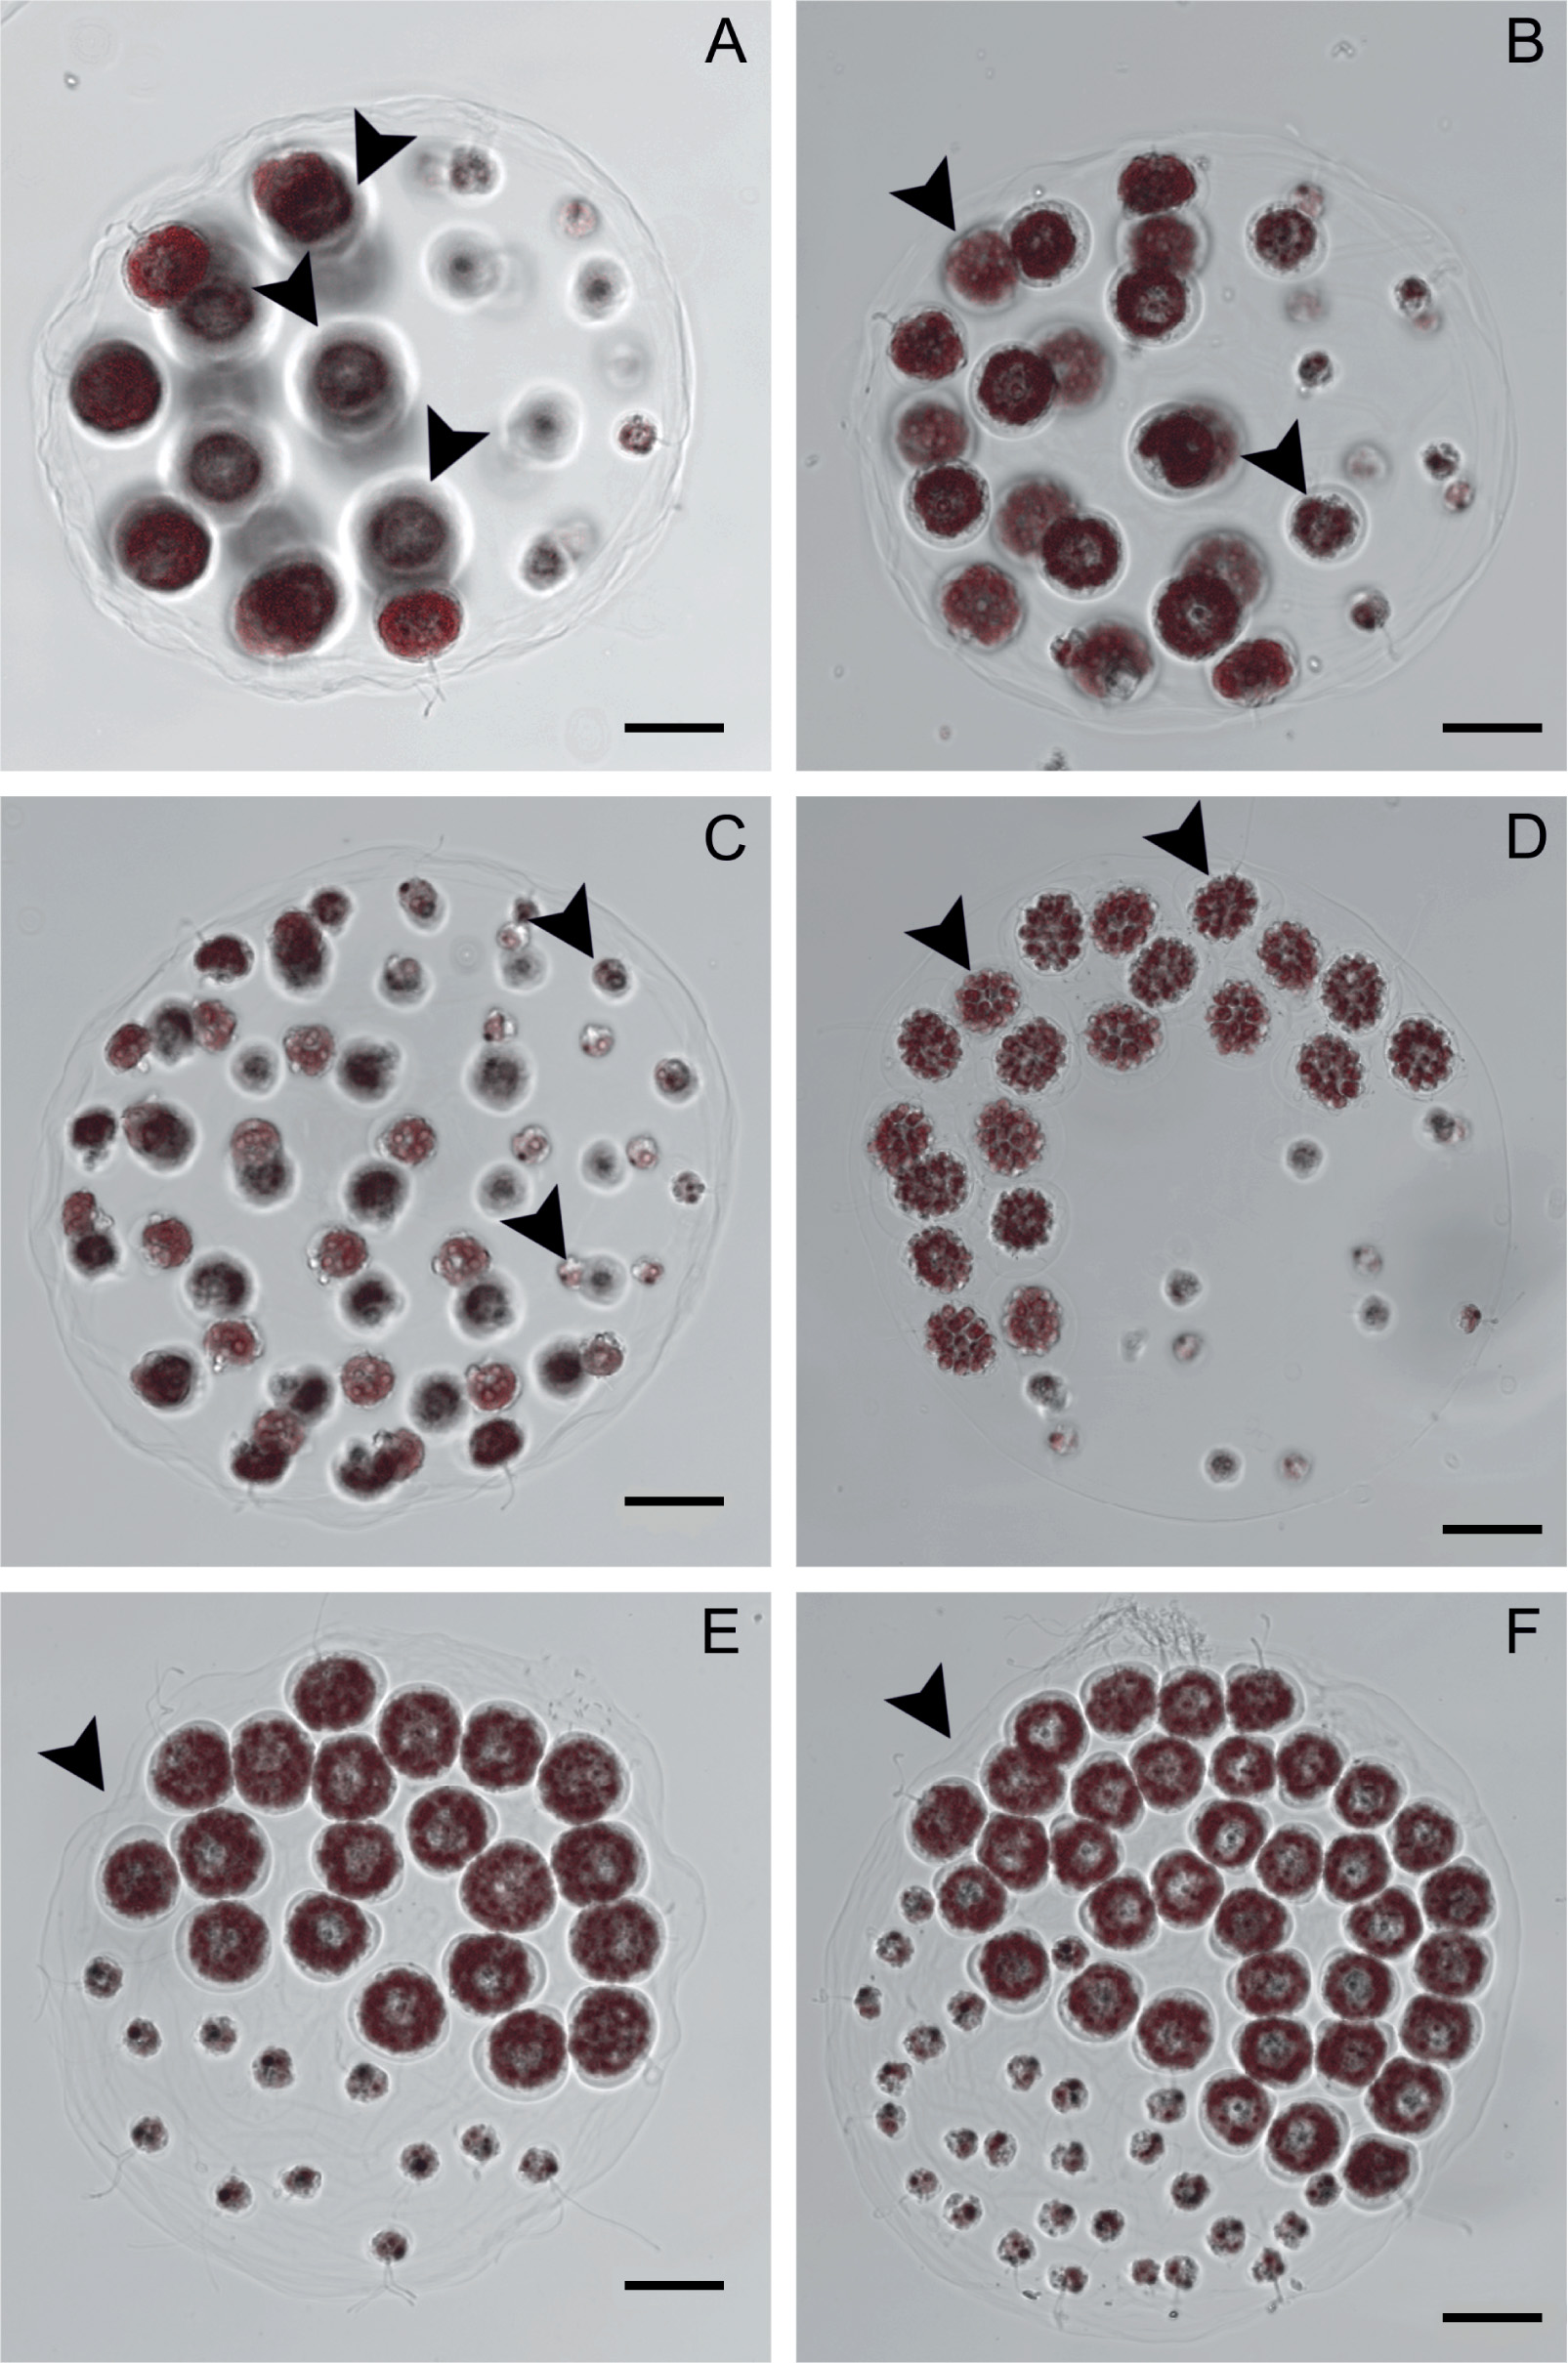
Figure 4
Pleodorina indica (A-F) Confocal microscope, Leica SP-8. Scale bar 20 μm (A) arrows indicate individual sheaths in the gelatinous matrix; (D, E) Surface of the 32-cells colony; (F) 64-cells colony; (B) arrows indicate vegetative cells; (C) arrows indicate somatic cells; (D) arrows indicate vegetative cells during division (asexual reproduction); (E, F) arrows indicate undulating peripheries of the colony
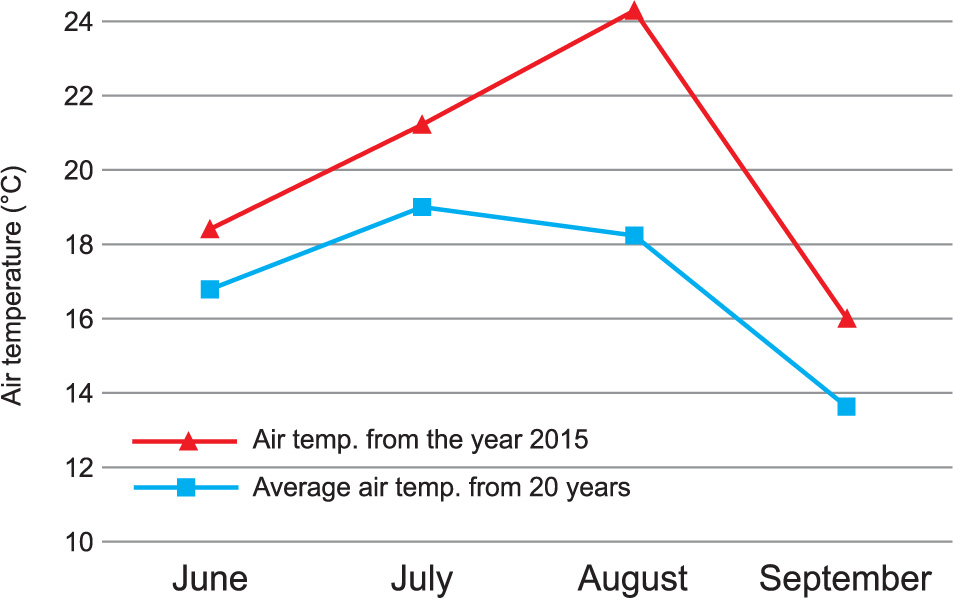
Figure 5
Average monthly temperatures from 1995-2014 in comparison with average monthly temperatures from 2015, in Łódź