
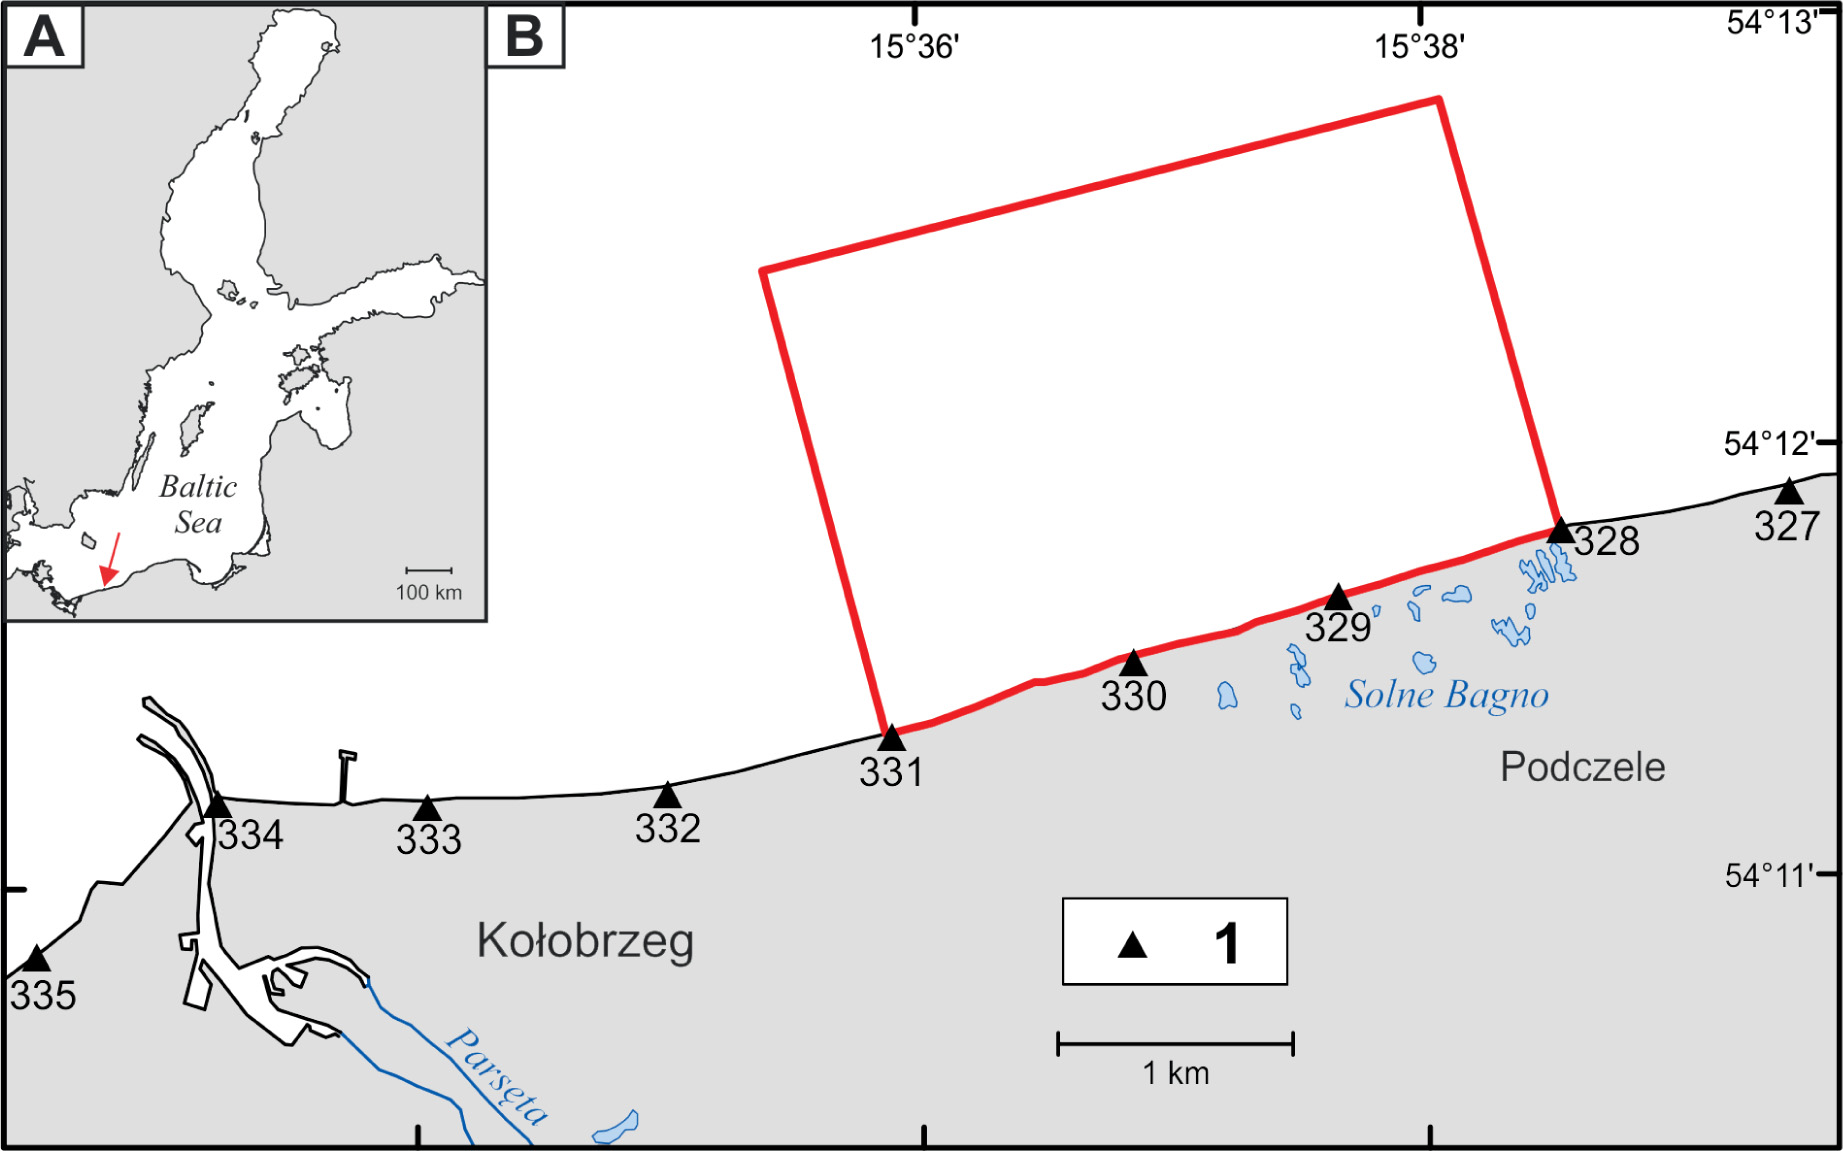
Figure 1
Location of the study area: A – marked by the red arrow, B – sketch by red lines; 1 – mileage (expressed in kilometers) of the Polish shoreline
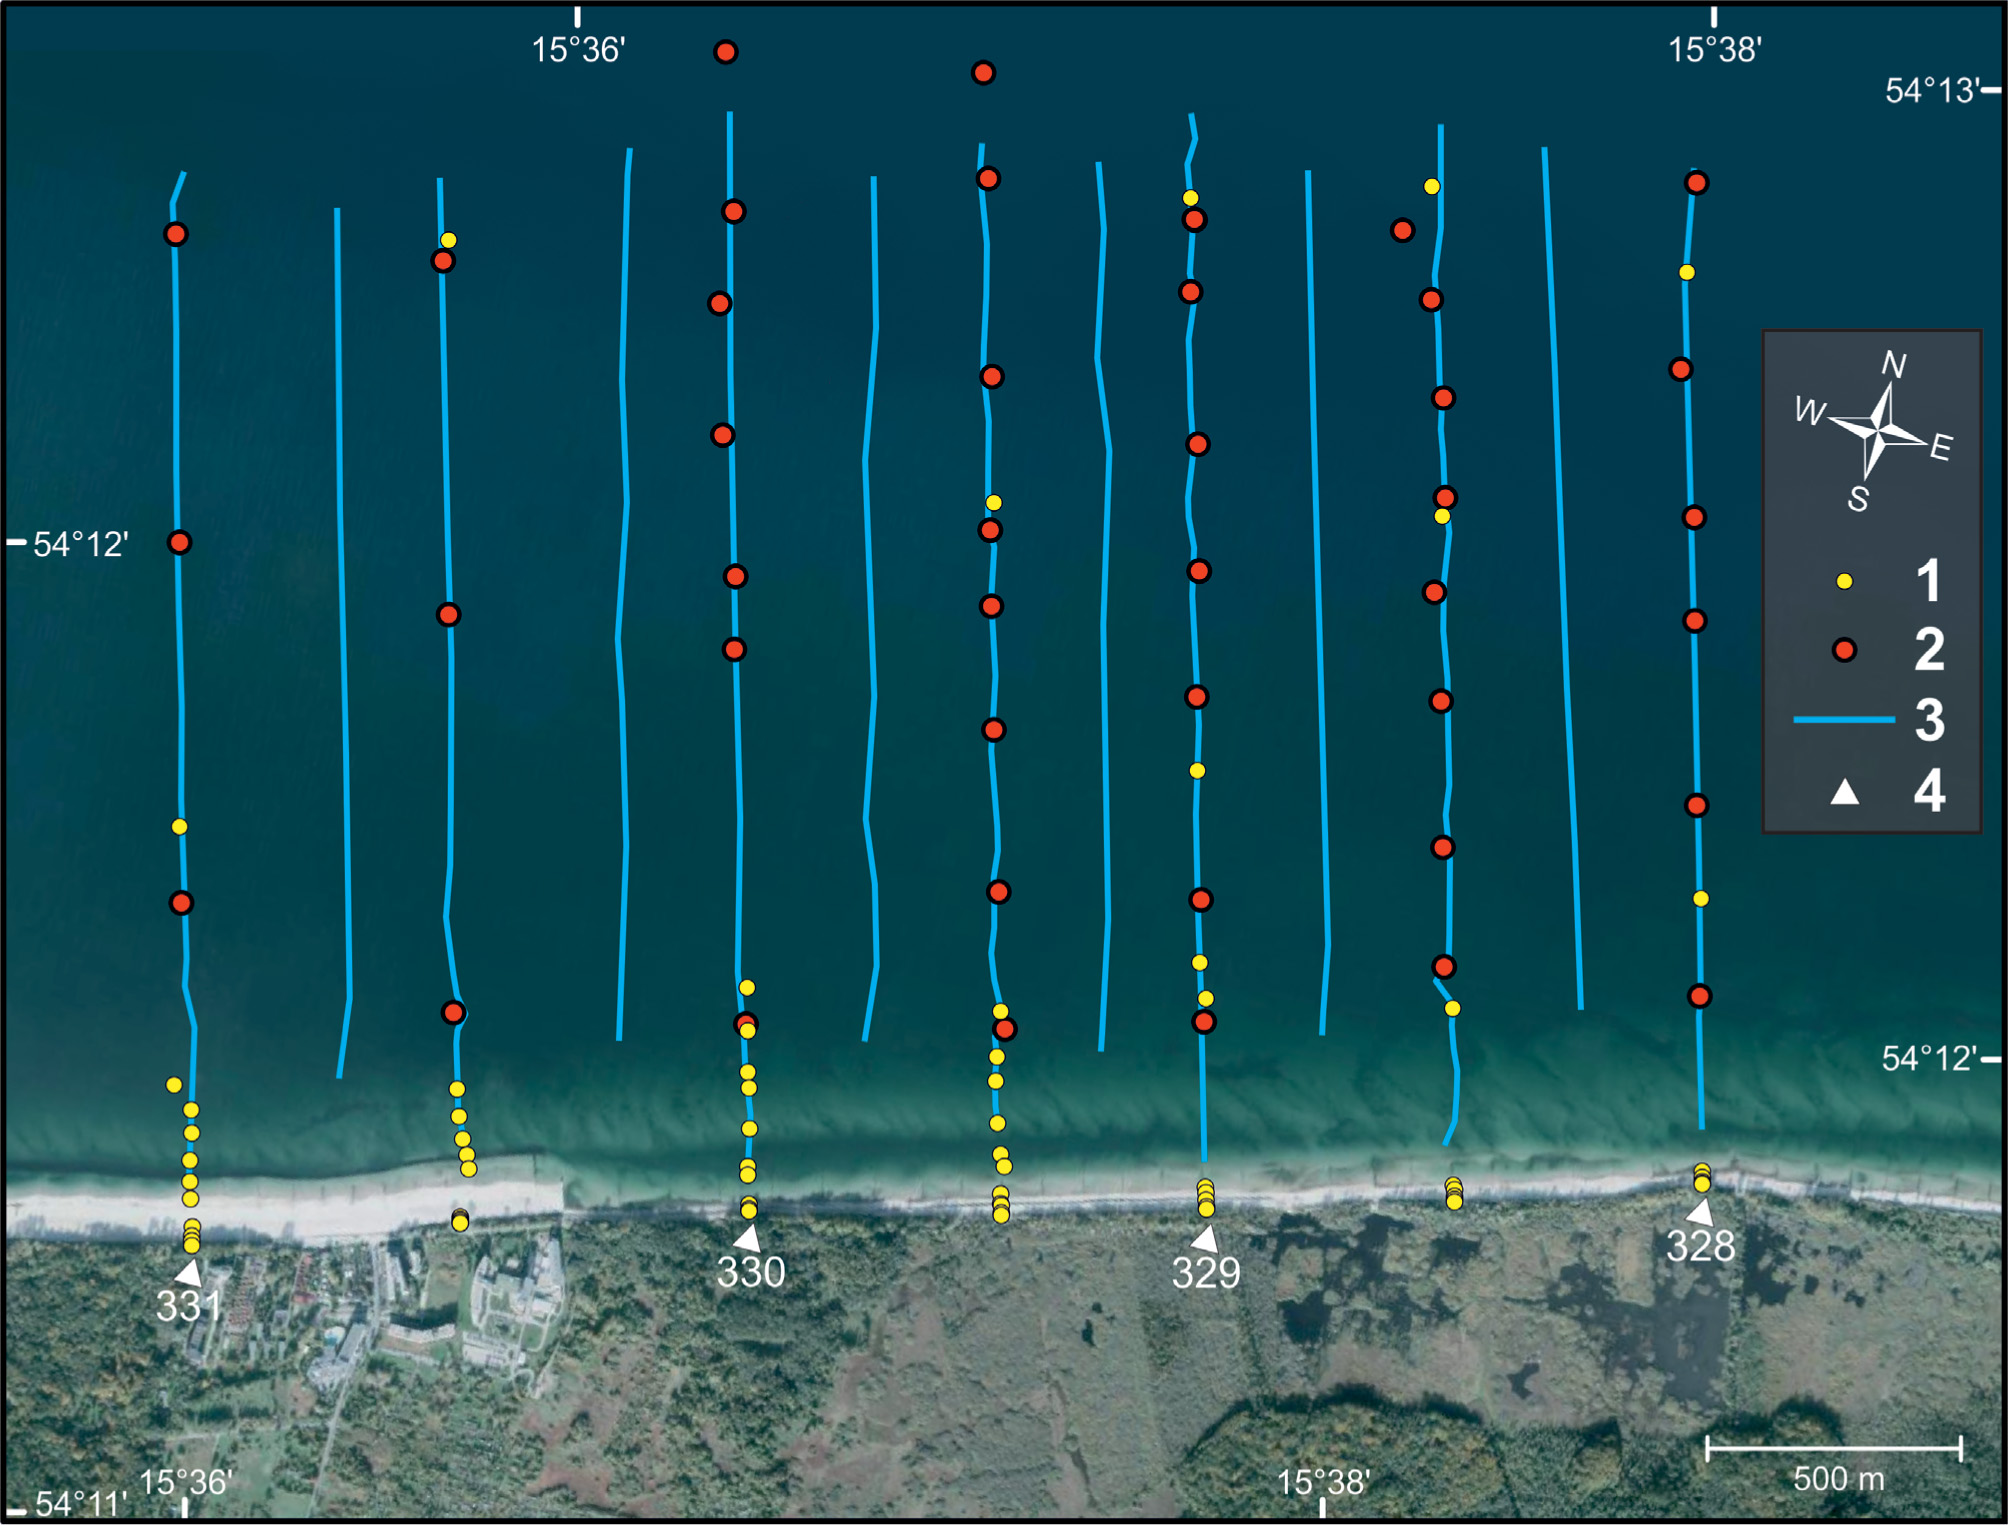
Figure 2
Location map of: 1 – grab sediment samples, 2 – core samples, 3 – sub-bottom profiles, 4 – kilometers of the Polish shoreline. Orthophotomap (by CODGiK, October 19, 2012) in the background
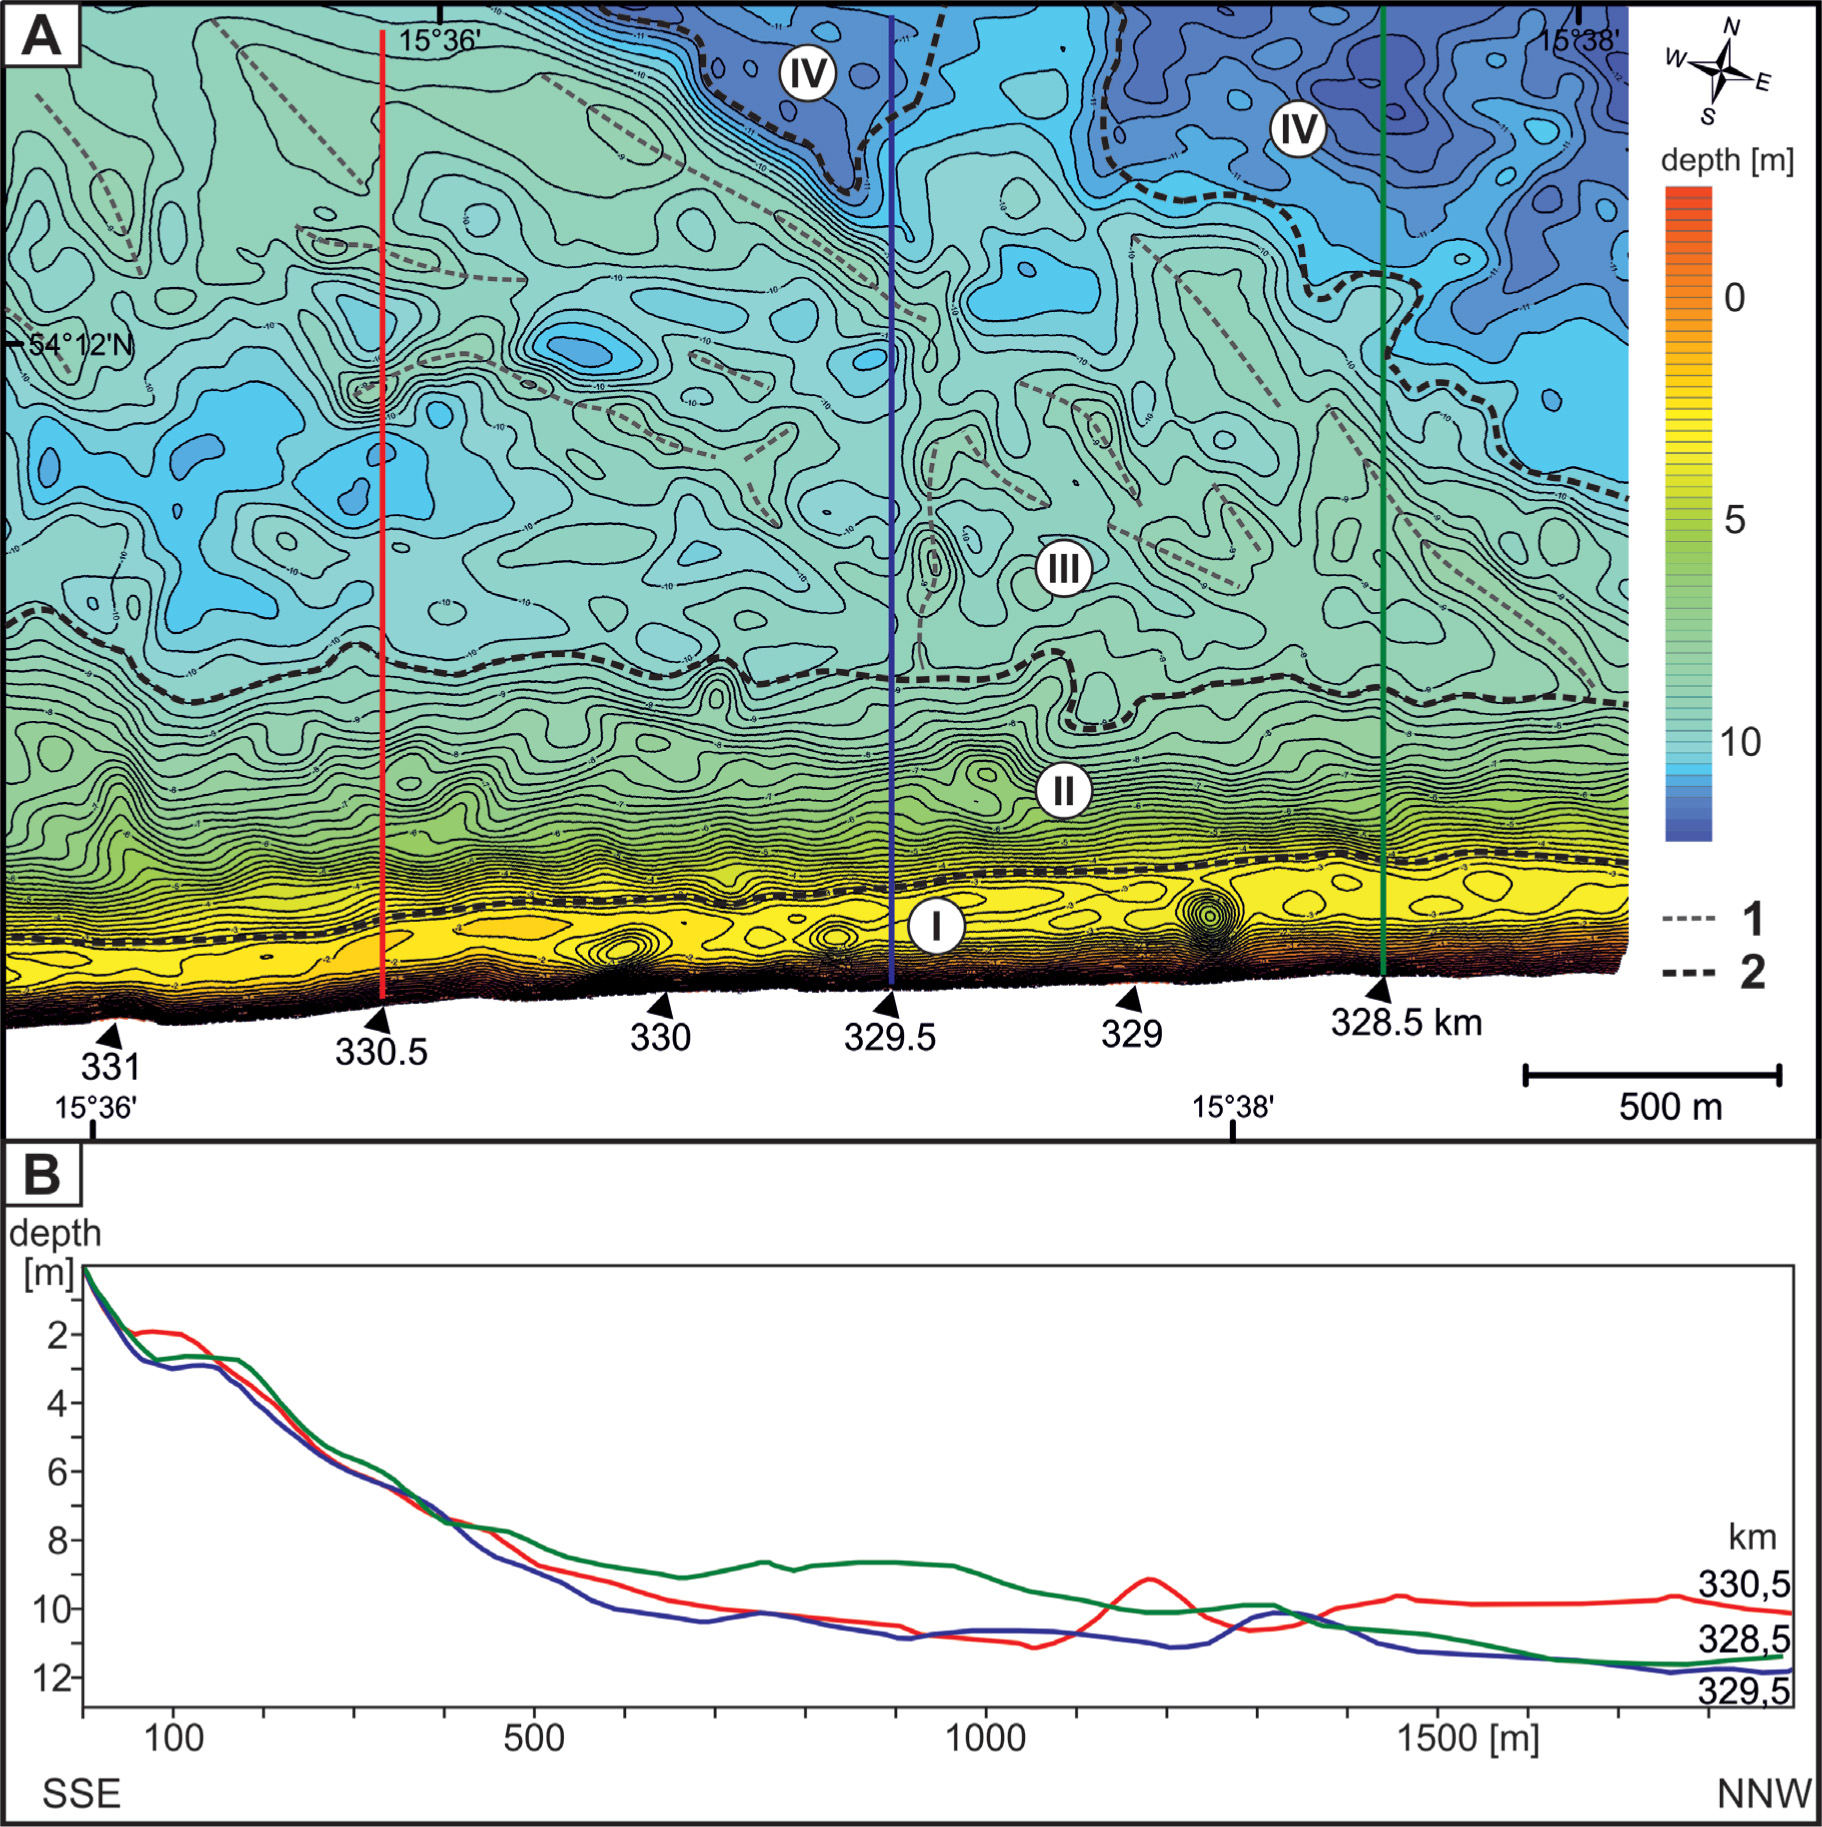
Figure 3
Relief of the nearshore seafloor. A – bathymetric map. 1 – main ridges; 2 – boundaries of the morphological units: I -nearshore bar zone, II – shoreface slope, III – rock platform, IV – deeper nearshore seafloor. B – bathymetric cross-shore profiles (location on the map A)
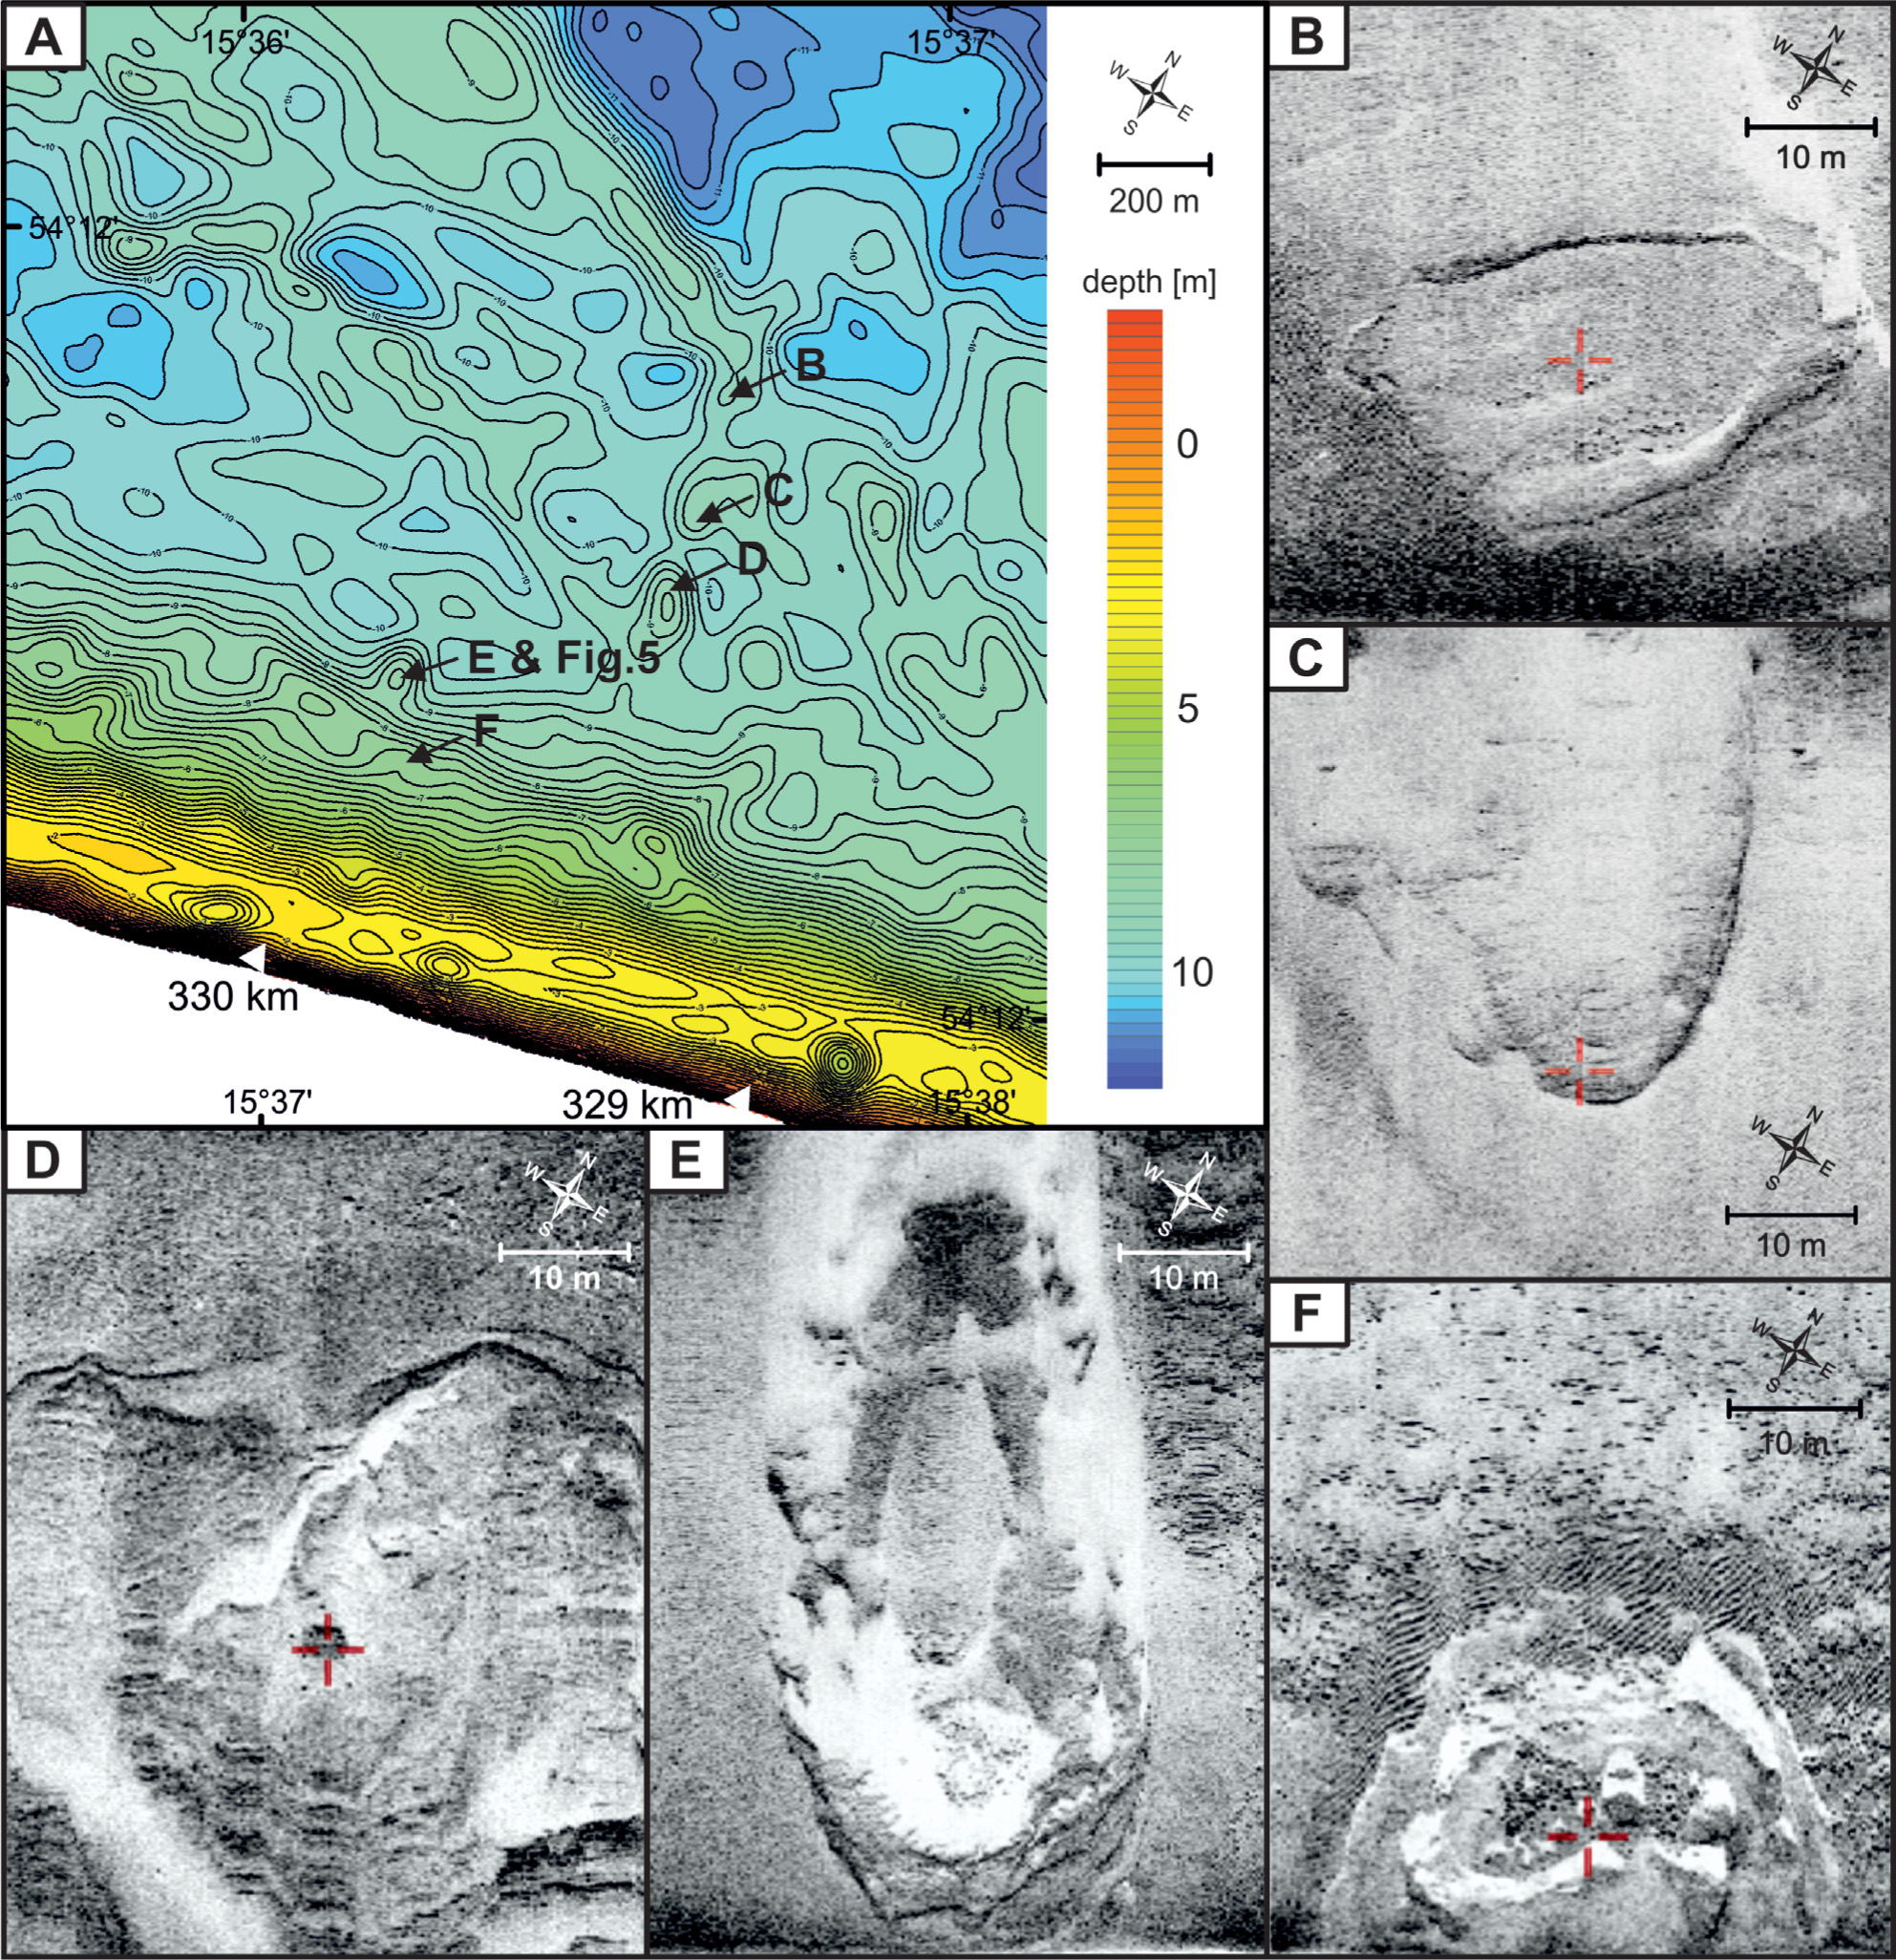
Figure 4
Location map (A) of the presented examples of the solid rocks’ outcrops shown on the sonar images (B, C, D, E & F)
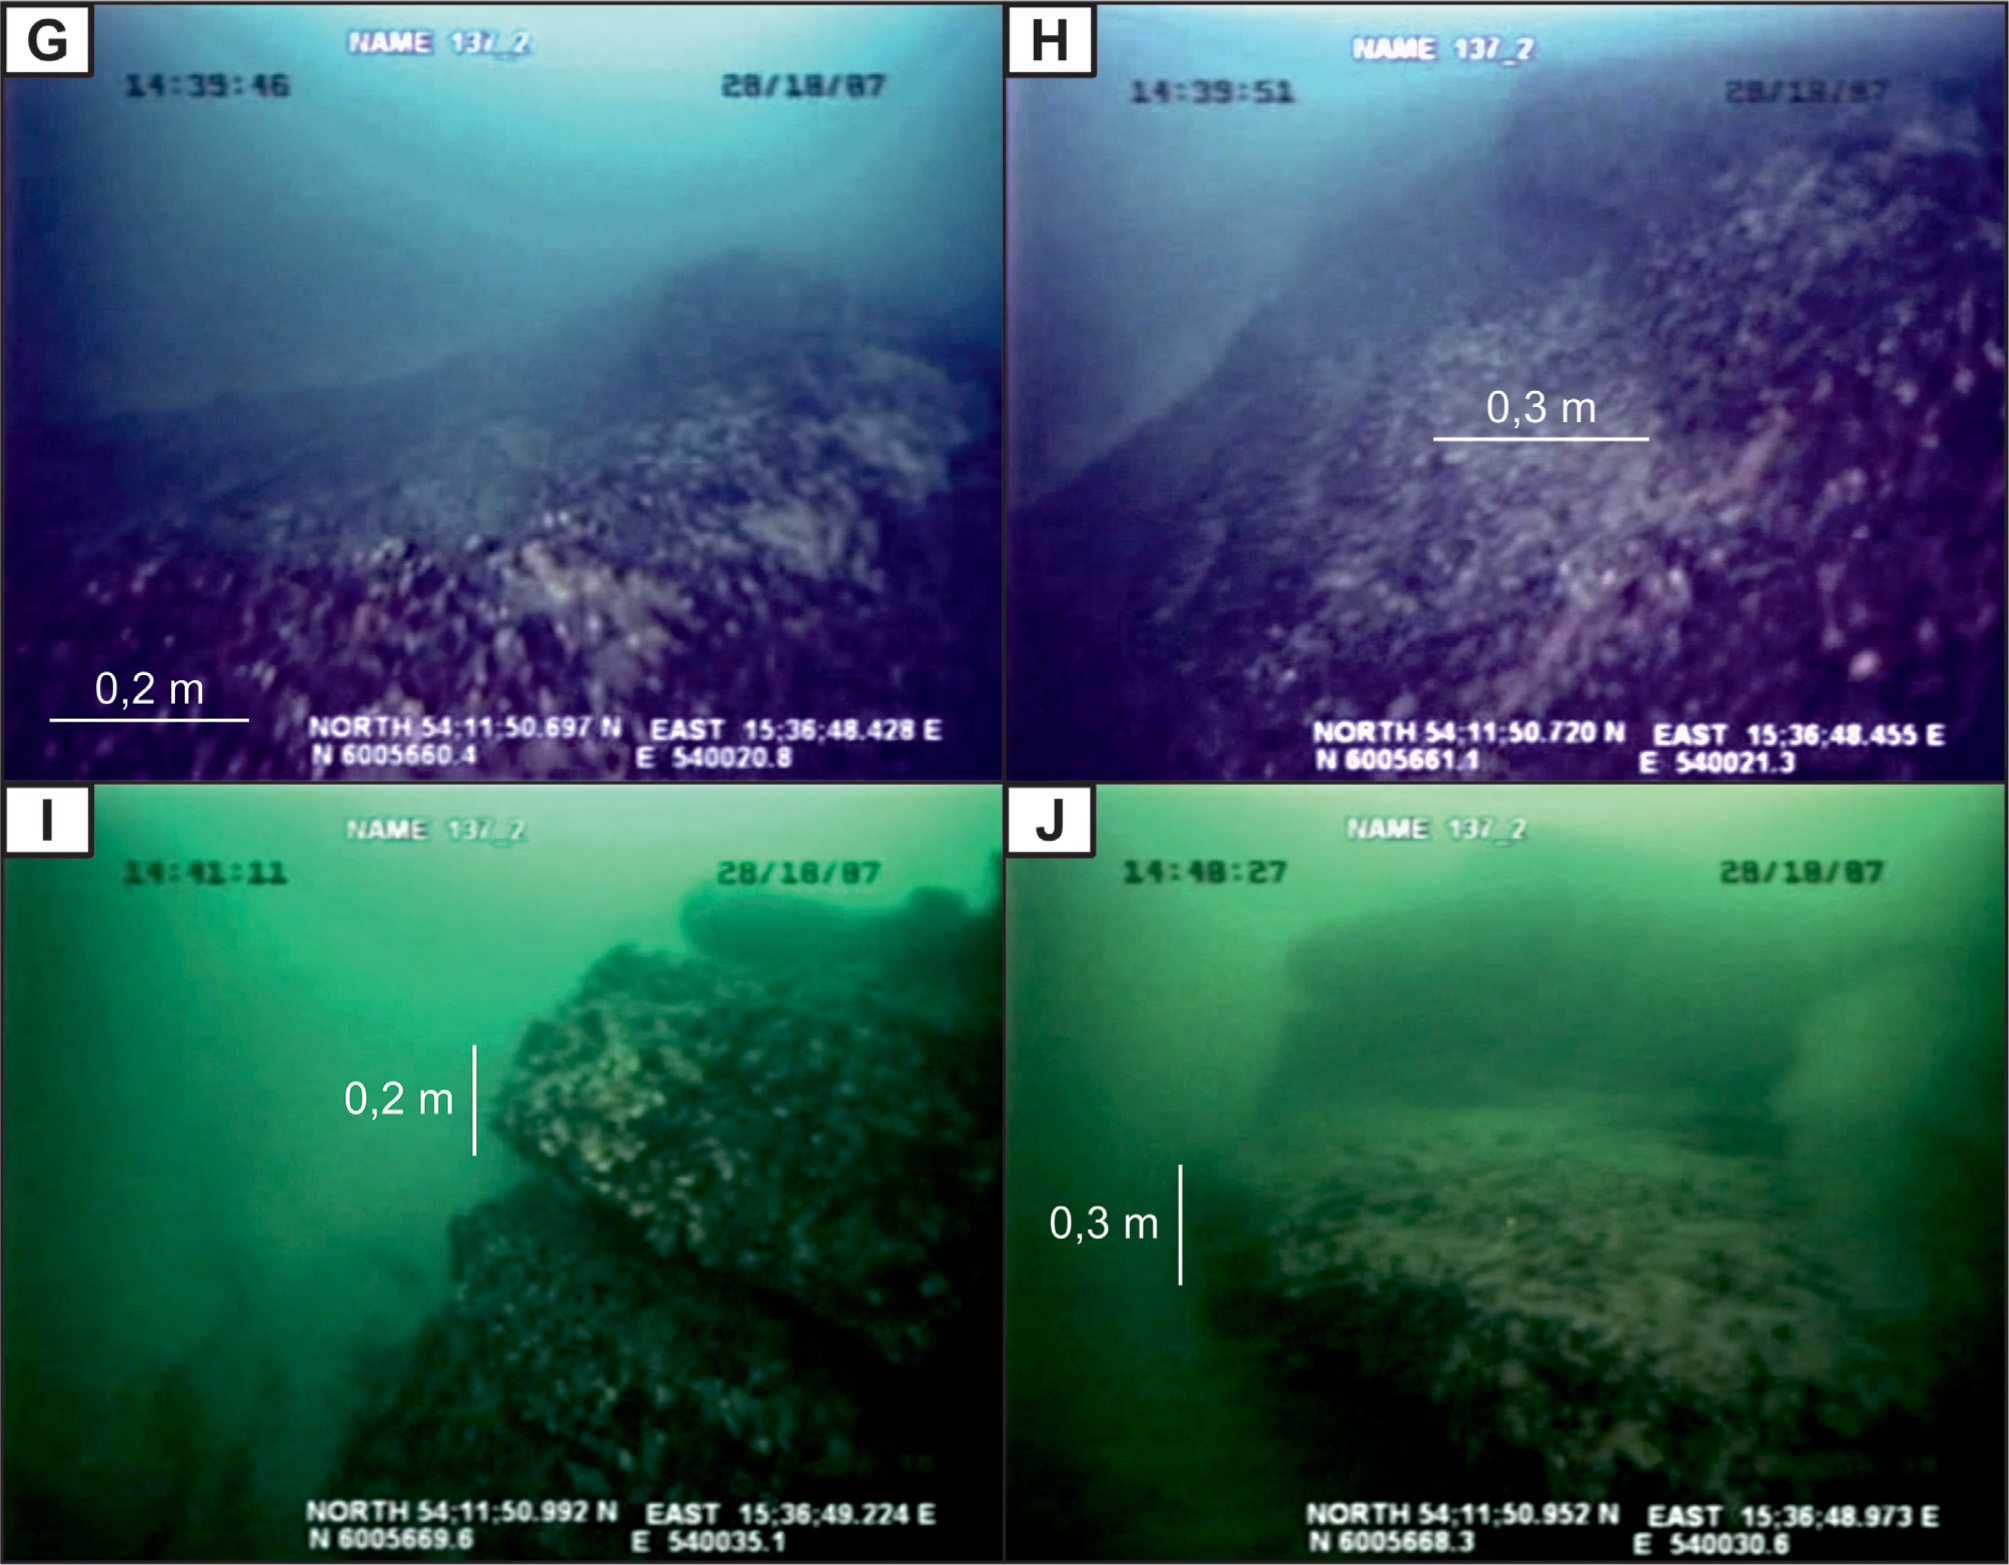
Figure 5
Jurassic rocks’ outcrop (E in Fig. 4) presented from different sides on underwater photos (G, H, I & J) taken by ROV TV
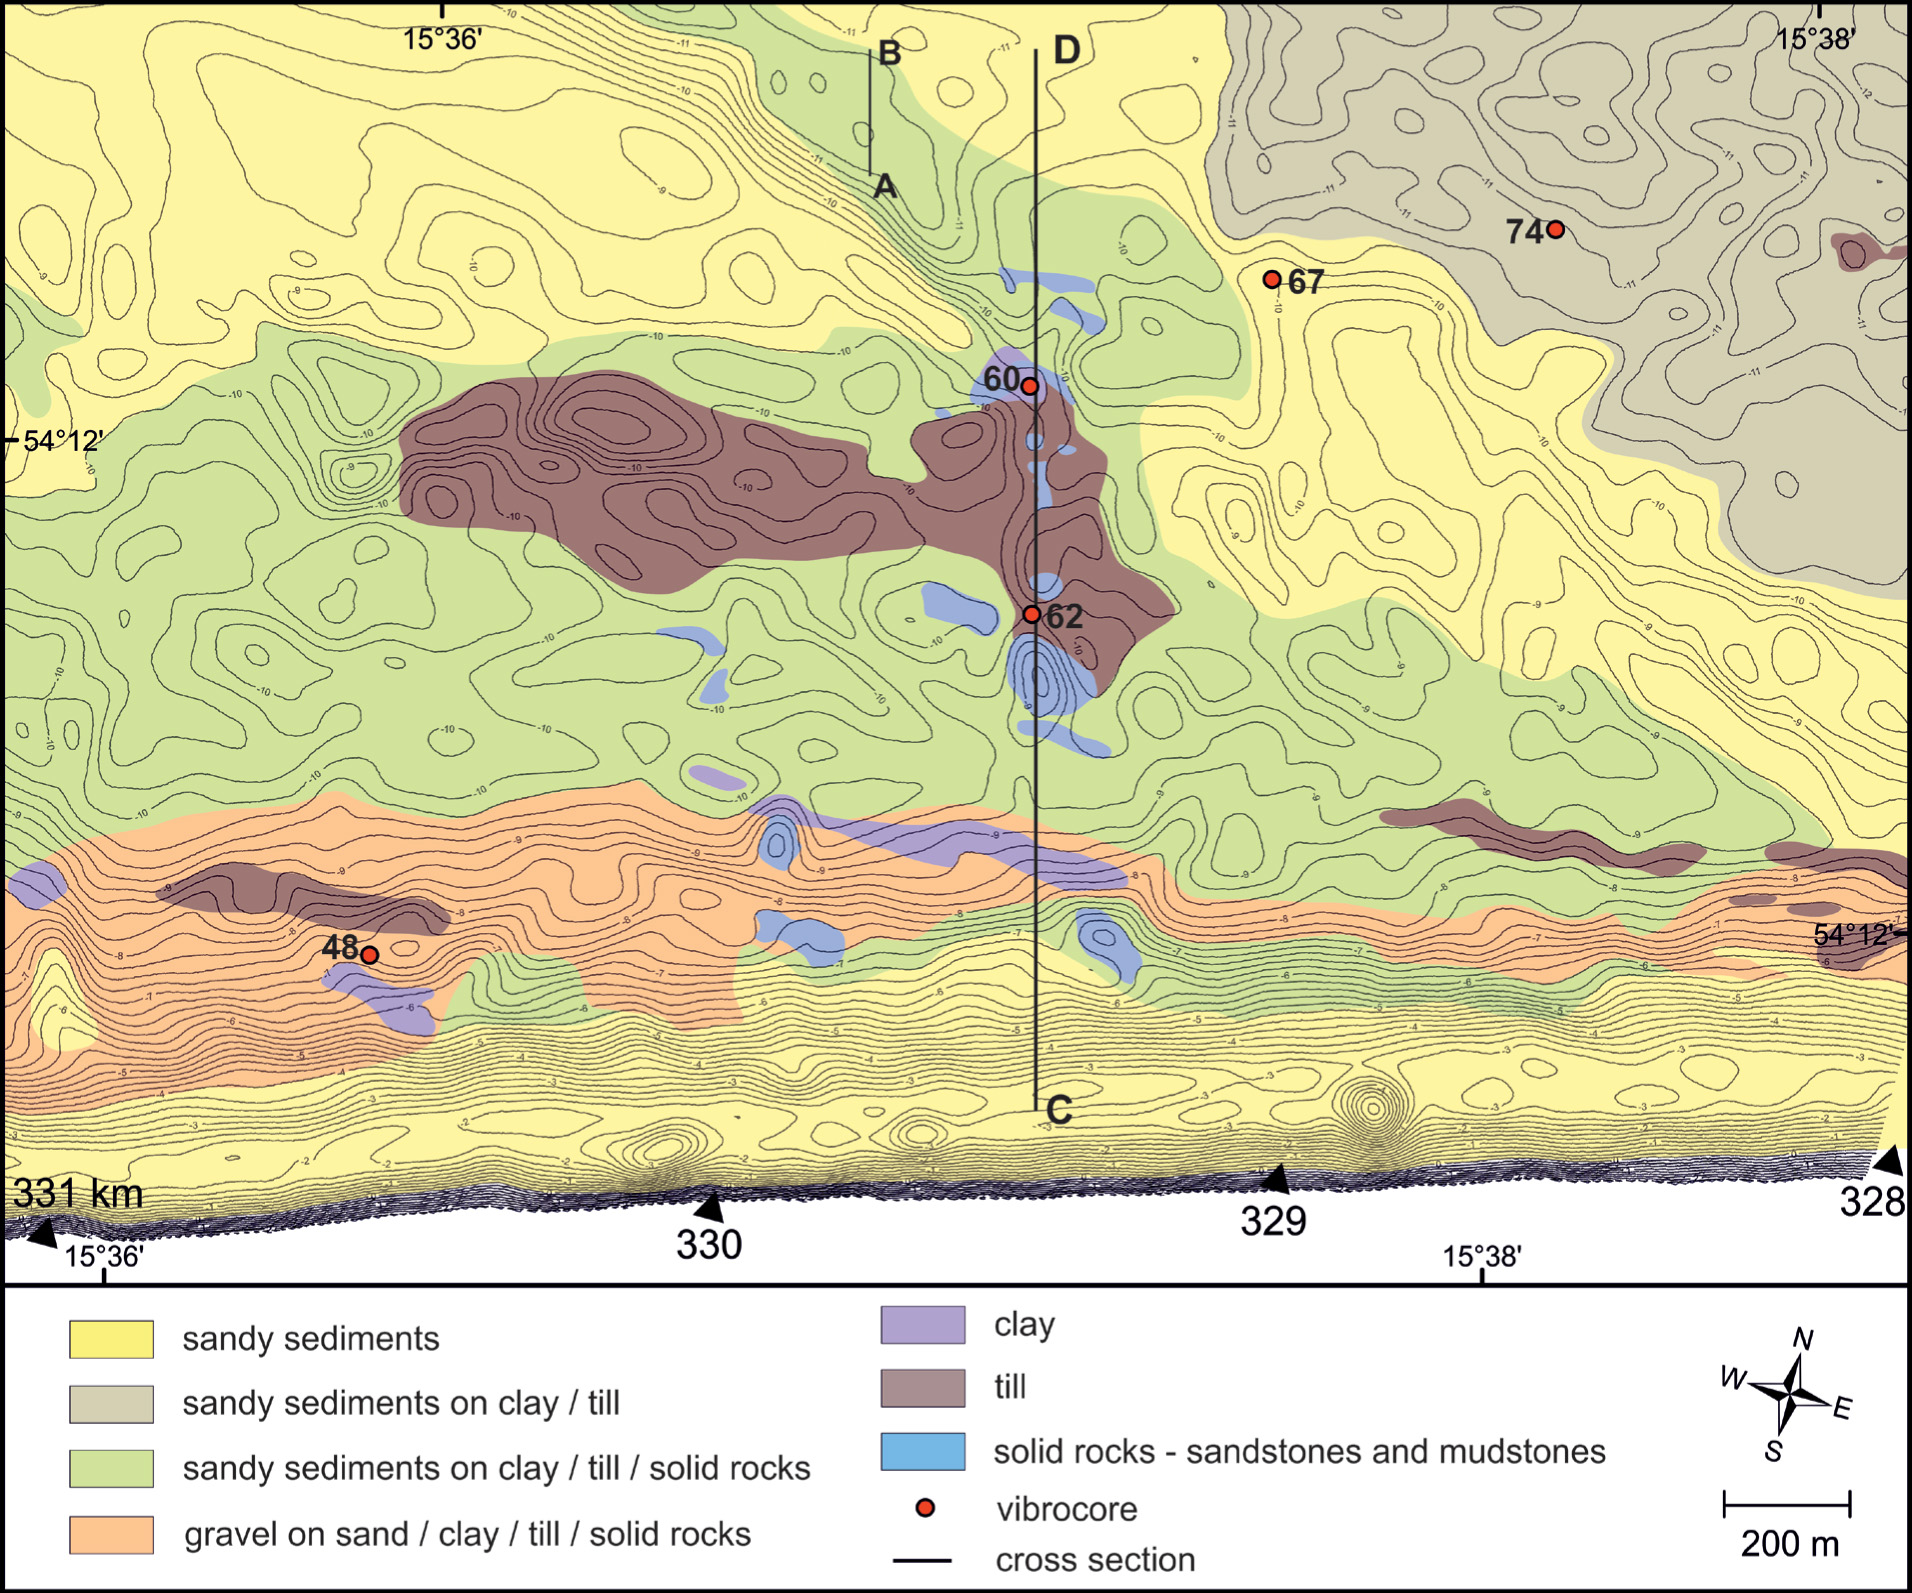
Figure 6
Lithological map of the seabed surface (isobaths every 0.25 m)
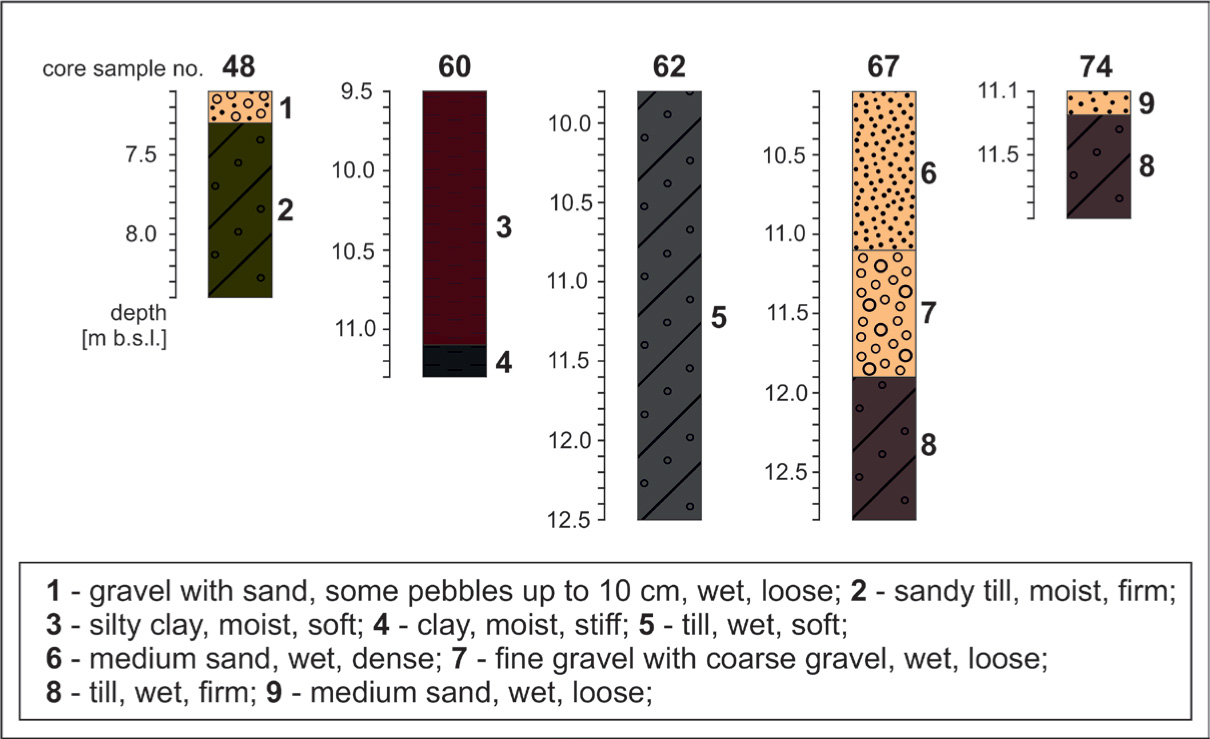
Figure 7
Selected examples of the core sections (for location see Fig. 6)
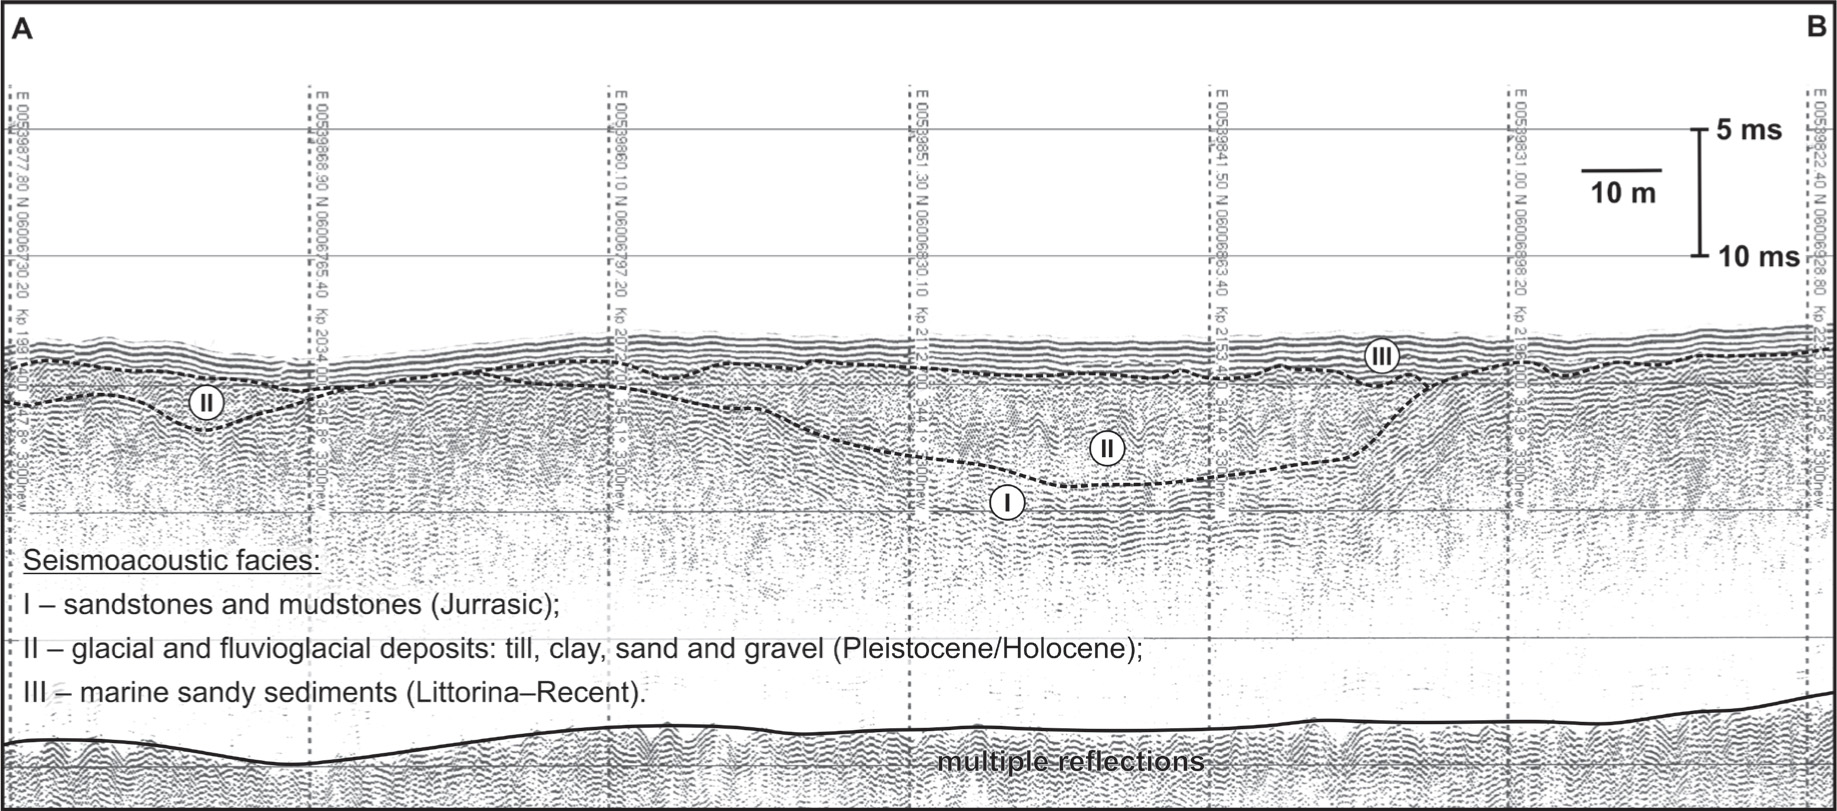
Figure 8
Fragment A-B of the seismoacoustic profile (location in Fig. 6)
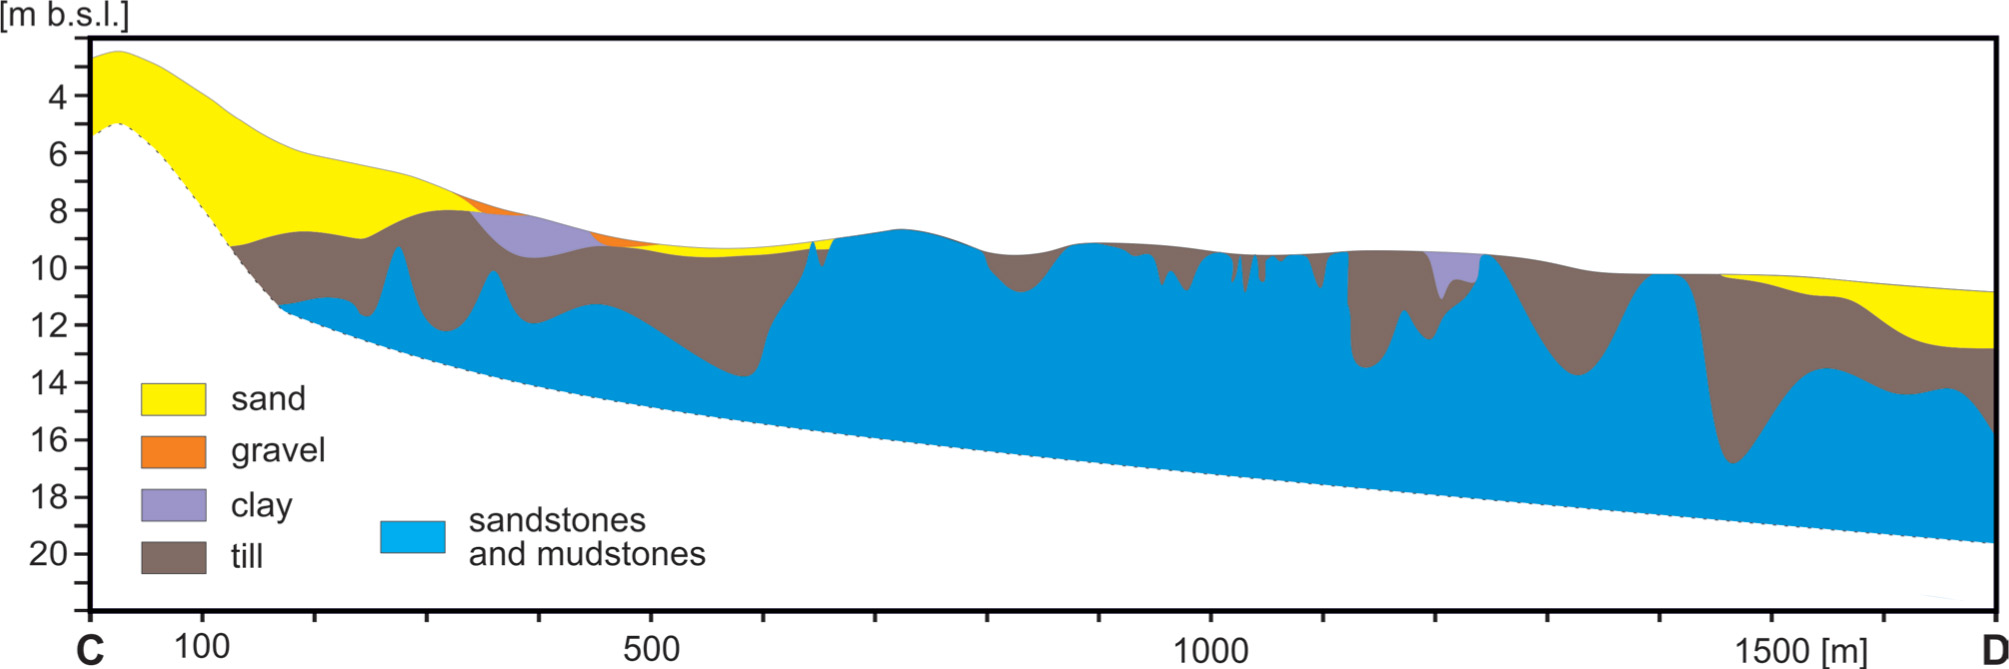
Figure 9
Geological cross section C-D (for location see Fig. 6)