
Figure 1
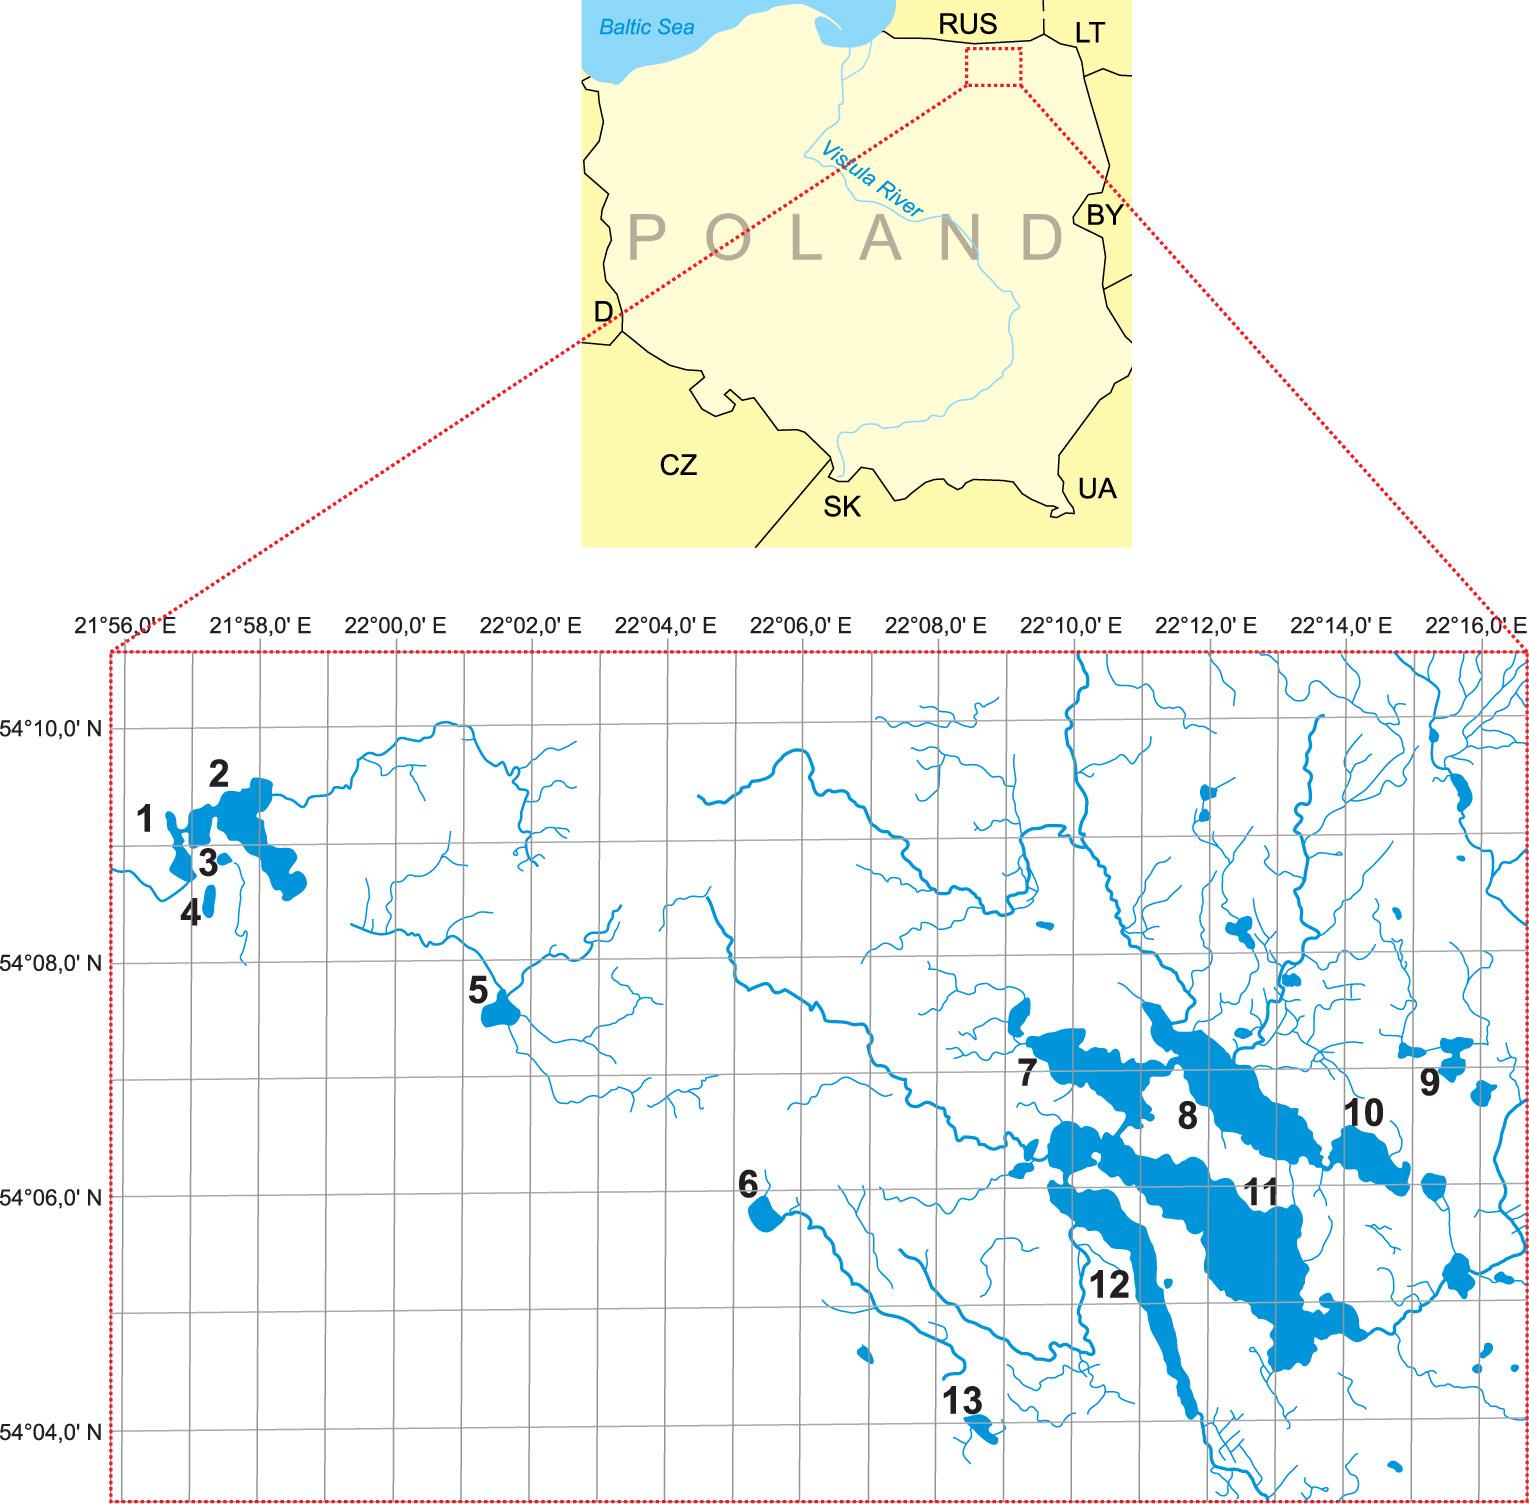
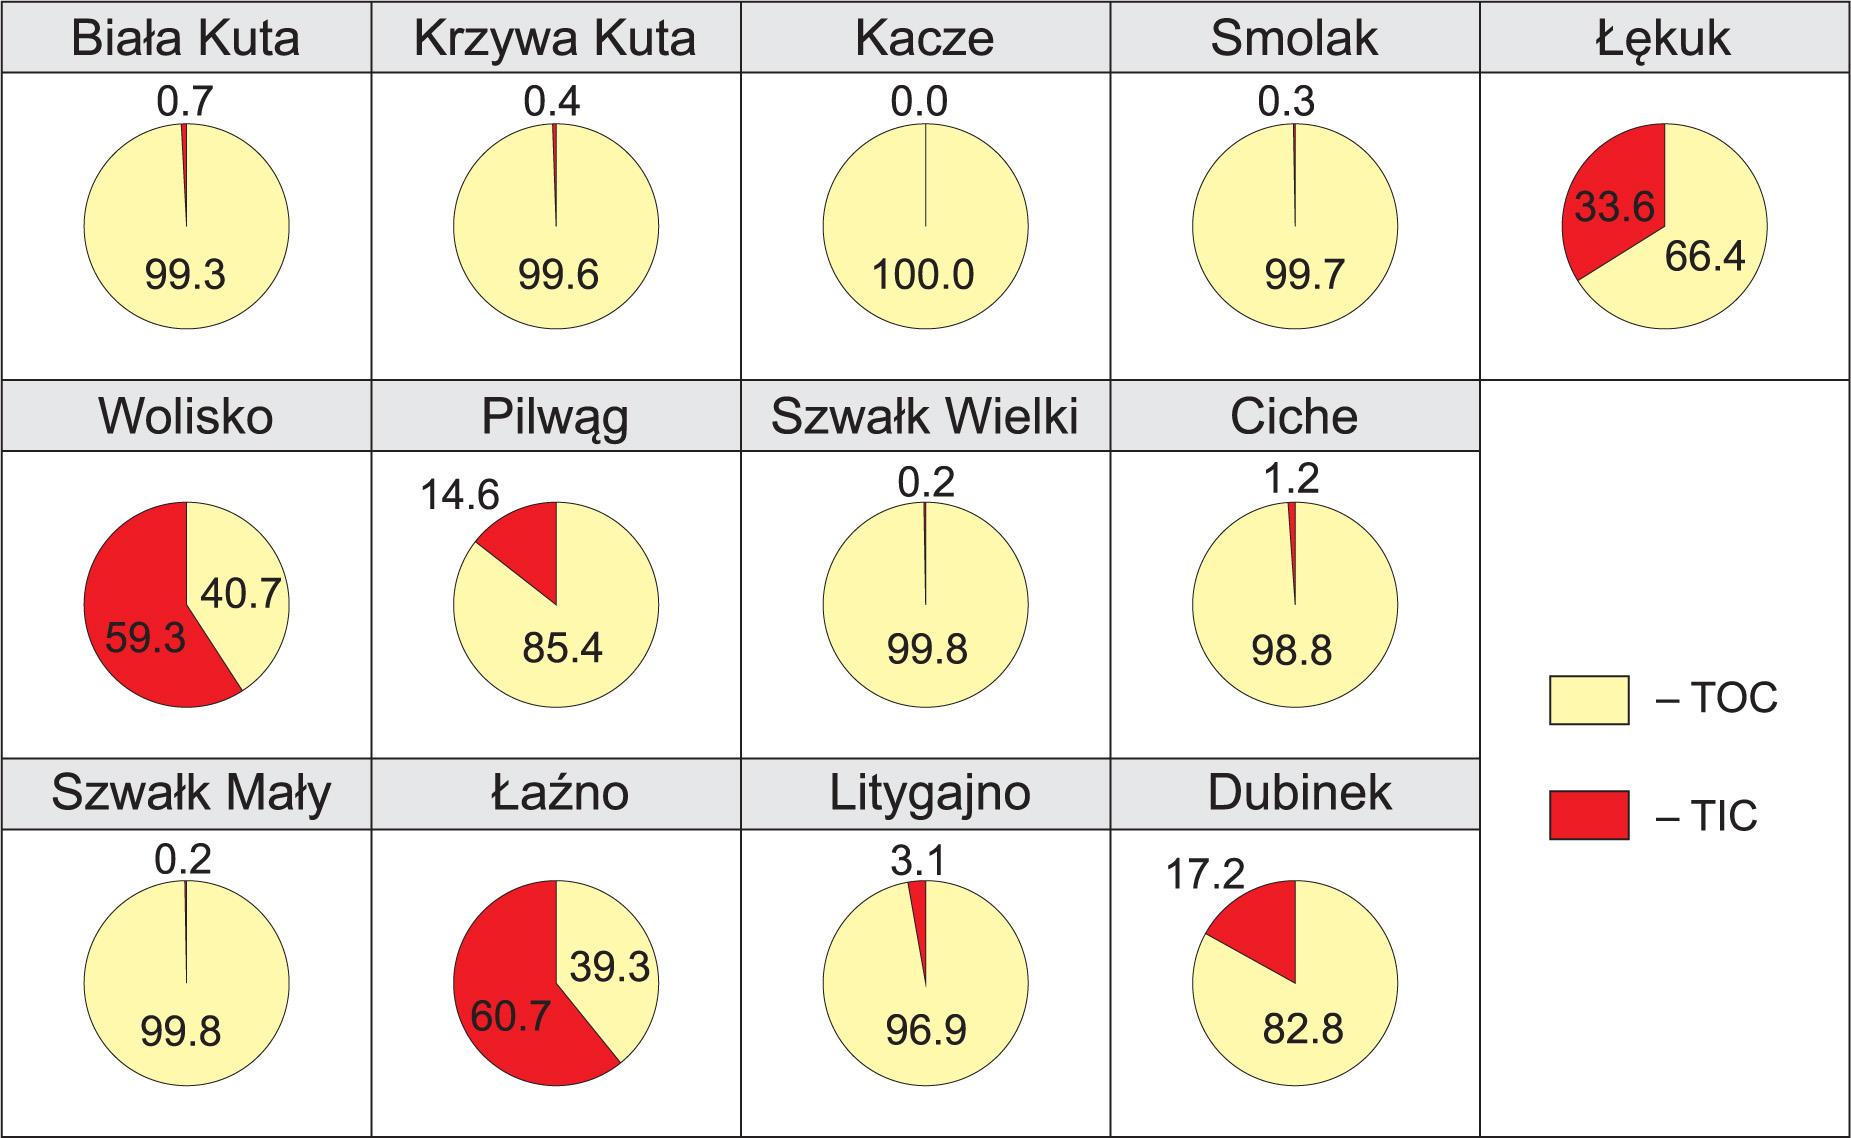
Figure 2
Morphometric parameters of Borecka Forest lakes
| Lake | Catchment | Natura 2000 Code shallow lakes (3140), eutrophic lakes (3150), dystrophic lakes (3160) | Area | Height | Volume | Average depth | Max. depth | Depth factor | Shoreline depth | Shoreline development | Lake length | Average width | Elongation factor |
|---|---|---|---|---|---|---|---|---|---|---|---|---|---|
| − | − | [ha] | [m a.s.l.] | [Mm3] | [m] | [m] | − | [m] | − | [m] | [m] | − | |
| Biala Kuta | Pregola | 3140 | 21.3 | 134.3 | 318.2 | 1.4 | 3.2 | 0.44 | 2700 | 1.65 | 1200 | 177.5 | 6.76 |
| Krzywa Kuta | 3150 | 131.2 | 134.4 | 7883.1 | 6.0 | 26.5 | 0.23 | 8550 | 2.11 | 2250 | 583.1 | 3.86 | |
| Kacze | 3160 | 1.8 | 134.3 | 5.1 | 0.3 | 0.8 | 0.38 | 490 | 1.04 | 171 | 103.0 | 1.66 | |
| Smolak | 3160 | 7.0 | 135.3 | 125.9 | 1.7 | 5.1 | 0.33 | 1190 | 1.27 | 500 | 140.0 | 3.57 | |
| Łękuk | 3150 | 20.7 | 127.4 | 957.4 | 4.6 | 12.5 | 0.37 | 1900 | 1.18 | 675 | 306.7 | 2.20 | |
| Wolisko | Vistula | 3150 | 13.5 | 175.9 | 620.2 | 4.6 | 8.6 | 0.53 | 1780 | 1.37 | 588 | 229.6 | 2.56 |
| Pilwag | 3150 | 135.1 | 133.3 | 2025.3 | 1.5 | 3.6 | 0.42 | 7940 | 1.93 | 2320 | 582.3 | 3.98 | |
| Szwalk Wielki | 3150 | 213.4 | 133.4 | 10505.8 | 4.9 | 11 | 0.45 | 9350 | 1.81 | 3800 | 561.6 | 6.77 | |
| Ciche | 3150 | 15.0 | 141.9 | 330.0 | 2.2 | 4.5 | 0.49 | 2560 | 1.86 | 689 | 217.7 | 3.16 | |
| Szwalk Maly | 3150 | 70.4 | 133.6 | 3016.8 | 4.3 | 6.7 | 0.64 | 4900 | 1.65 | 1485 | 474.1 | 3.13 | |
| Łaźno | 3150 | 562.4 | 133.2 | 32017.9 | 5.7 | 18 | 0.32 | 17825 | 2.12 | 6200 | 907.1 | 6.83 | |
| Litygajno | 3150 | 162.1 | 133.1 | 9763.9 | 6.0 | 16.4 | 0.37 | 10675 | 2.37 | 4700 | 344.9 | 13.63 | |
| Dubinek | 3140 | 12.1 | 151.4 | 310.1 | 2.5 | 6.2 | 0.40 | 1660 | 1.35 | 638 | 189.7 | 3.36 |
Ecotoxicological assessment of sediments in rivers and lakes (Macdonald 1994, CCME 1999)
| Metal | TEL | PEL |
|---|---|---|
| (mg kg–1) | ||
| Zn | 123 | 315 |
| Cu | 36 | 197 |
| Pb | 35 | 91 |
| Ni | 16 | 42 |
| Cd | 0.6 | 3.5 |
Heavy metals in sediments arranged in order from the highest to the lowest concentration for a given metal
| Lake | Order of heavy metals |
|---|---|
| Biała Kuta | Zn < Cu < Pb < Ni < Cd |
| Krzywa Kuta | Zn < Cu < Pb < Ni < Cd |
| Kacze | Zn < Pb < Cu < Ni = Cd |
| Smolak | Zn < Cu < Pb < Ni < Cd |
| Łękuk | Zn < Pb < Cu < Ni < Cd |
| Wolisko | Zn < Cu < Pb < Ni < Cd |
| Pilwąg | Zn < Cu < Pb < Ni < Cd |
| Szwałk Wielki | Zn < Cu < Pb < Ni < Cd |
| Ciche | Zn < Pb < Cu < Ni < Cd |
| Szwałk Mały | Zn < Cu < Pb < Ni < Cd |
| Łaźno | Cu < Zn < Pb < Ni < Cd |
| Litygajno | Zn < Pb < Cu < Ni < Cd |
| Dubinek | Zn < Cu < Ni < Pb < Cd |
Values of geoaccumulation indices (Igeo) of heavy metals in littoral sediments from lakes in Borecka Forest
| Lake | Background | Igeo-Zn | Igeo-Cu | Igeo-Pb | Igeo-Ni | Igeo-Cd |
|---|---|---|---|---|---|---|
| Biała Kuta | GBP | −4.07 | −0.76 | −2.55 | −2.78 | −4.00 |
| GBE | −3.95 | −3.23 | −2.74 | −5.05 | −1.67 | |
| KrzywaKuta | GBP | −5.01 | −2.39 | −4.41 | −3.38 | −2.97 |
| GBE | −4.88 | −4.86 | −4.59 | −7.15 | −0.64 | |
| Kacze | GBP | −1.37 | 0.57 - unpolluted to moderately polluted sediments (class I); | 0.25 - unpolluted to moderately polluted sediments (class I); | −3.55 | −0.23 |
| GBE | −1.25 | −1.91 | 0.07 - unpolluted to moderately polluted sediments (class I); | −7.31 | 2.10 - moderately to strongly polluted sediments (class III); | |
| Smolak | GBP | −3.28 | −0.90 | −2.96 | −3.91 | −3.91 |
| GBE | −3.15 | −3.38 | −3.14 | −7.67 | −1.58 | |
| Łękuk | GBP | −3.11 | −0.92 | −1.84 | −1.69 | −2.95 |
| GBE | −2.99 | −3.40 | −2.02 | −5.46 | −0.63 | |
| Wolisko | GBP | −2.29 | −1.37 | −3.36 | −1.96 | −2.92 |
| GBE | −2.16 | −3.85 | −3.54 | −5.72 | −0.60 | |
| Pilwąg | GBP | −2.47 | 0.02 - unpolluted to moderately polluted sediments (class I); | −2.97 | −2.19 | −2.33 |
| GBE | −2.35 | −2.46 | −3.15 | −5.96 | −0.01 | |
| Szwałk Wielki | GBP | −4.24 | −1.50 | −4.12 | −3.14 | −2.40 |
| GBE | −4.11 | −3.98 | −4.31 | −6.91 | −0.08 | |
| Ciche | GBP | −3.61 | −1.95 | −3.03 | −1.97 | −1.97 |
| GBE | −3.49 | −4.43 | −3.21 | −5.74 | 0.35 - unpolluted to moderately polluted sediments (class I); | |
| SzwalkMaly | GBP | −7.46 | −2.04 | −4.66 | −2.47 | 0.74 - unpolluted to moderately polluted sediments (class I); |
| GBE | −7.34 | −4.52 | −4.84 | −6.24 | 3.06 - strongly polluted sediments (class IV) | |
| Łaźno | GBP | −4.98 | −0.73 | −3.57 | −2.39 | −2.39 |
| GBE | −4.86 | −3.21 | −3.75 | −6.16 | −0.07 | |
| Litygajno | GBP | −3.76 | −1.57 | −2.46 | −2.04 | −2.94 |
| GBE | −3.64 | −4.05 | −2.64 | −5.81 | −0.61 | |
| Dubinek | GBP | −2.00 | 0.45 - unpolluted to moderately polluted sediments (class I); | −1.78 | 0.69 - unpolluted to moderately polluted sediments (class I); | −3.91 |
| GBE | −1.88 | −2.03 | −1.96 | −3.08 | −1.58 |
Contamination factors (CF), the percentage of each metal in the total sediment contamination (%CF) with heavy metals in littoral sediments and the degree of sediment contamination (Cd)
| Lake | Background | CF (Zn) | %CF (Zn) | CF (Cu) | %CF (Cu) | CF (Pb) | %CF (Pb) | CF (Ni) | %CF (Ni) | CF (Cd) | %CF (Cd) | ?CF | Cd |
|---|---|---|---|---|---|---|---|---|---|---|---|---|---|
| Biała Kuta | GBP | 0.09 | 5.8 | 0.89 | 57.5 | 0.26 | 16.5 | 0.22 | 14.1 | 0.09 | 6.1 | 1.54 | 0.31 |
| GBE | 0.10 | 10.0 | 0.16 | 16.5 | 0.23 | 23.3 | 0.02 | 1.7 | 0.47 | 48.6 | 0.97 | 0.19 | |
| Krzywa Kuta | GBP | 0.05 | 6.3 | 0.29 | 38.8 | 0.07 | 9.5 | 0.14 | 19.5 | 0.19 | 25.9 | 0.74 | 0.15 |
| GBE | 0.05 | 4.5 | 0.05 | 4.5 | 0.06 | 5.5 | 0.01 | 0.9 | 0.96 | 84.6 | 1.14 | 0.23 | |
| Kacze | GBP | 0.58 | 9.7 | 2.23 – moderate contamination level; | 37.1 | 1.78 – moderate contamination level; | 29.7 | 0.13 | 2.1 | 1.28 – moderate contamination level; | 21.4 | 6.00 | 1.20 |
| GBE | 0.63 | 7.0 | 0.40 | 4.4 | 1.57 – moderate contamination level; | 17.4 | 0.01 | 0.1 | 6.41 – very high contamination level; | 71.0 | 9.03 | 1.81 – low contamination level; | |
| Smolak | GBP | 0.15 | 11.5 | 0.80 | 59.5 | 0.19 | 14.3 | 0.10 | 7.4 | 0.10 | 7.4 | 1.35 | 0.27 |
| GBE | 0.17 | 17.0 | 0.14 | 14.6 | 0.17 | 17.2 | 0.01 | 0.7 | 0.50 | 50.5 | 0.99 | 0.20 | |
| Łękuk | GBP | 0.17 | 8.5 | 0.79 | 38.8 | 0.42 | 20.5 | 0.46 | 22.7 | 0.19 | 9.5 | 2.05 | 0.41 |
| GBE | 0.19 | 11.1 | 0.14 | 8.4 | 0.37 | 21.7 | 0.03 | 2.0 | 0.97 | 56.9 | 1.71 | 0.34 | |
| Wolisko | GBP | 0.31 | 19.0 | 0.58 | 35.9 | 0.15 | 9.0 | 0.39 | 23.9 | 0.20 | 12.2 | 1.62 | 0.32 |
| GBE | 0.34 | 21.1 | 0.10 | 6.6 | 0.13 | 8.1 | 0.03 | 1.8 | 0.99 | 62.4 | 1.59 | 0.32 | |
| Pilwąg | GBP | 0.27 | 10.4 | 1.52 – moderate contamination level; | 58.2 | 0.19 | 7.4 | 0.33 | 12.6 | 0.30 | 11.4 | 2.60 | 0.52 |
| GBE | 0.30 | 13.1 | 0.27 | 12.1 | 0.17 | 7.5 | 0.02 | 1.1 | 1.49 – moderate contamination level; | 66.2 | 2.25 | 0.45 | |
| Szwałk Wielki | GBP | 0.08 | 6.9 | 0.53 | 46.0 | 0.09 | 7.5 | 0.17 | 14.8 | 0.28 | 24.7 | 1.15 | 0.23 |
| GBE | 0.09 | 5.1 | 0.09 | 5.6 | 0.08 | 4.5 | 0.01 | 0.7 | 1.42 – moderate contamination level; | 84.0 | 1.69 | 0.34 | |
| Ciche | GBP | 0.12 | 8.4 | 0.39 | 26.6 | 0.18 | 12.6 | 0.38 | 26.2 | 0.38 | 26.2 | 1.46 | 0.29 |
| GBE | 0.13 | 5.8 | 0.07 | 3.0 | 0.16 | 7.0 | 0.03 | 1.2 | 1.91 – moderate contamination level; | 82.9 | 2.30 | 0.46 | |
| Szwałk Mały | GBP | 0.01 | 0.3 | 0.36 | 11.4 | 0.06 | 1.9 | 0.27 | 8.4 | 2.50 – moderate contamination level; | 78.1 | 3.20 | 0.64 |
| GBE | 0.01 | 0.1 | 0.07 | 0.5 | 0.05 | 0.4 | 0.02 | 0.2 | 12.49 – very high contamination level; | 98.8 | 12.64 | 2.53 – moderate contamination level | |
| Łaźno | GBP | 0.05 | 2.9 | 0.90 | 54.7 | 0.13 | 7.7 | 0.29 | 17.4 | 0.29 | 17.4 | 1.65 | 0.33 |
| GBE | 0.05 | 2.9 | 0.16 | 9.1 | 0.11 | 6.3 | 0.02 | 1.2 | 1.43 – moderate contamination level; | 80.5 | 1.78 | 0.36 | |
| Litygajno | GBP | 0.11 | 7.6 | 0.51 | 34.9 | 0.27 | 18.8 | 0.36 | 25.1 | 0.20 | 13.5 | 1.45 | 0.29 |
| GBE | 0.12 | 8.3 | 0.09 | 6.2 | 0.24 | 16.5 | 0.03 | 1.8 | 0.98 | 67.2 | 1.46 | 0.29 | |
| Dubinek | GBP | 0.37 | 7.0 | 2.04 – moderate contamination level; | 38.0 | 0.44 | 8.1 | 2.42 – moderate contamination level; | 45.0 | 0.10 | 1.9 | 5.37 | 1.07 |
| GBE | 0.41 | 22.2 | 0.37 | 19.9 | 0.39 | 21.0 | 0.18 | 9.7 | 0.50 | 27.2 | 1.84 | 0.37 |
The average content of heavy metals, total carbon (TC), total organic carbon (TOC), total inorganic carbon (TIC) in littoral sediments in lakes of Borecka Forest
| Lake | Zn | Cu | Pb | Ni | Cd | TOC | TIC | TC |
|---|---|---|---|---|---|---|---|---|
| (mg kg−1) | g C kg−1 | |||||||
| Biała Kuta | 6.50 | 6.22 | 3.83 | 1.09 | 0.05 | 16.00 | 0.11 | 16.11 |
| Krzywa Kuta | 3.41 | 2.01 | 1.06 | 0.72 | 0.10 | 6.01 | 0.03 | 6.04 |
| Kacze | 42.35 | 15.60 | 26.77 | 0.64 | 0.64 | 494.46 | 0.22 | 494.68 |
| Smolak | 11.31 | 5.62 | 2.89 | 0.05 | 0.05 | 44.58 | 0.12 | 44.71 |
| Łękuk | 12.65 | 5.56 | 6.03 | 2.32 | 0.10 | 7.20 | 3.65 | 10.86 |
| Wolisko | 22.46 | 4.06 | 2.19 | 1.93 | 0.10 | 6.30 | 9.17 | 15.46 |
| Pilwąg | 19.78 | 10.61 | 2.88 | 1.64 | 0.15 | 41.96 | 7.16 | 49.12 |
| Szwałk Wielki | 5.80 | 3.70 | 1.29 | 0.85 | 0.14 | 12.17 | 0.03 | 12.20 |
| Ciche | 8.96 | 2.72 | 2.76 | 1.91 | 0.19 | 8.57 | 0.11 | 8.67 |
| Szwałk Mały | 0.62 | 2.55 | 0.89 | 1.35 | 1.25 | 15.56 | 0.04 | 15.60 |
| Łaźno | 3.46 | 6.31 | 1.90 | 1.43 | 0.14 | 9.79 | 15.11 | 24.90 |
| Litygajno | 8.06 | 3.54 | 4.08 | 1.82 | 0.10 | 22.95 | 0.74 | 23.69 |
| Dubinek | 27.3 | 14.3 | 6.57 | 12.1 | 0.05 | 50.30 | 10.42 | 60.72 |
| Average | 13.28 | 6.37 | 4.88 | 2.18 | 0.23 | 56.60 | 3.61 | 60.21 |
| Min. | 0.62 | 2.01 | 0.89 | 0.50 | 0.05 | 6.01 | 0.03 | 6.04 |
| Max. | 42.35 | 15.60 | 26.77 | 12.10 | 1.25 | 494.46 | 15.11 | 494.68 |
| SD | ±11.81 | ±4.42 | ±6.82 | ±3.03 | ±0.34 | ±132.47 | ±5.14 | ±131.65 |
| V | 112.44 | 144.03 | 71.54 | 71.74 | 68.76 | 42.73 | 70.19 | 45.74 |
| GBP | 73 | 7 | 15 | 5 | 0.5 | − | − | |
| GBE | 67 | 39 | 17 | 68 | 0.1 | − | − | |
Heavy metal pollution of littoral sediments from lakes in Borecka Forest
| Lake | Zn | Cu | Pb | Ni | Cd | Sediment evaluation |
|---|---|---|---|---|---|---|
| Sediment purity classes | ||||||
| Biała Kuta | 0 | 0 | 0 | 0 | 0 | geochemical background |
| KrzywaKuta | 0 | 0 | 0 | 0 | 0 | geochemical background |
| Kacze | 0 | I | I | 0 | I | unpolluted |
| Smolak | 0 | 0 | 0 | 0 | 0 | geochemical background |
| Łękuk | 0 | 0 | 0 | 0 | 0 | geochemical background |
| Wolisko | 0 | 0 | 0 | 0 | 0 | geochemical background |
| Pilwąg | 0 | I | 0 | 0 | 0 | unpolluted |
| Szwałk Wielki | 0 | 0 | 0 | 0 | 0 | geochemical background |
| Ciche | 0 | 0 | 0 | 0 | 0 | geochemical background |
| SzwalkMaly | 0 | 0 | 0 | 0 | II | moderately polluted |
| Łaźno | 0 | 0 | 0 | 0 | 0 | geochemical background |
| Litygajno | 0 | 0 | 0 | 0 | 0 | geochemical background |
| Dubinek | 0 | I | 0 | I | 0 | unpolluted |
Values of Pearson’s correlation coefficients between heavy metals, TOC and TIC in sediments
| Zn | Cu | Pb | Ni | Cd | TOC | TIC | |
|---|---|---|---|---|---|---|---|
| Zn | 1 | ||||||
| Cu | significant at p<0.01 and 0.05, respectively | 1 | |||||
| Pb | significant at p<0.01 and 0.05, respectively | significant at p<0.01 and 0.05, respectively | 1 | ||||
| Ni | 0.34 | 0.49 | 0.03 | 1 | |||
| Cd | 0.00 | 0.00 | 0.24 | −0.18 | 1 | ||
| TOC | significant at p<0.01 and 0.05, respectively | significant at p<0.01 and 0.05, respectively | significant at p<0.01 and 0.05, respectively | −0.09 | 0.34 | 1 | |
| TIC | 0.17 | 0.32 | −0.14 | 0.46 | −0.27 | −0.18 | 1 |
Geochemical criteria of sediment pollution assessment (Bojakowska 2001)
| Metal | Classes of sediment pollution | ||||
|---|---|---|---|---|---|
| 0 | I | II | III | IV | |
| geochemical background | unpolluted | moderately polluted | polluted | strongly polluted | |
| (mg kg−1) | |||||
| Zinc (Zn) | 73 | 200 | 500 | 1000 | >1000 |
| Copper (Cu) | 7 | 40 | 100 | 200 | >200 |
| Lead (Pb) | 15 | 30 | 100 | 200 | >200 |
| Nickel (Ni) | 5 | 16 | 40 | 50 | >50 |
| Cadmium (Cd) | <0.5 | 1 | 3.5 | 6 | >6 |
The land use in the direct catchments of the analyzed lakes
| Lake | Agricultural land (%) | Wasteland (%) | Building (%) | Forest (%) |
|---|---|---|---|---|
| Biala Kuta | 2.6 | − | − | 97.4 |
| Krzywa Kuta | 17.8 | 1.8 | 2.6 | 77.8 |
| Kacze | − | − | − | 100.0 |
| Smolak | 4.4 | − | − | 95.6 |
| Łękuk | 68.7 | 3.7 | 4.5 | 23.1 |
| Wolisko | 19.6 | 5.5 | 2.7 | 72.3 |
| Pilwąg | 5.2 | 1.1 | 0.5 | 93.2 |
| Szwałk Wielki | 20.6 | 2.8 | 1.1 | 75.4 |
| Ciche | 2.7 | − | − | 97.3 |
| Szwałk Mały | 38.8 | 9.6 | 1.2 | 50.4 |
| Łaźno | 40.7 | 12.2 | 5.4 | 41.7 |
| Litygajno | 15.9 | 12.5 | 2.2 | 69.4 |
| Dubinek | − | − | − | 100.0 |