
Figure 1

Figure 2
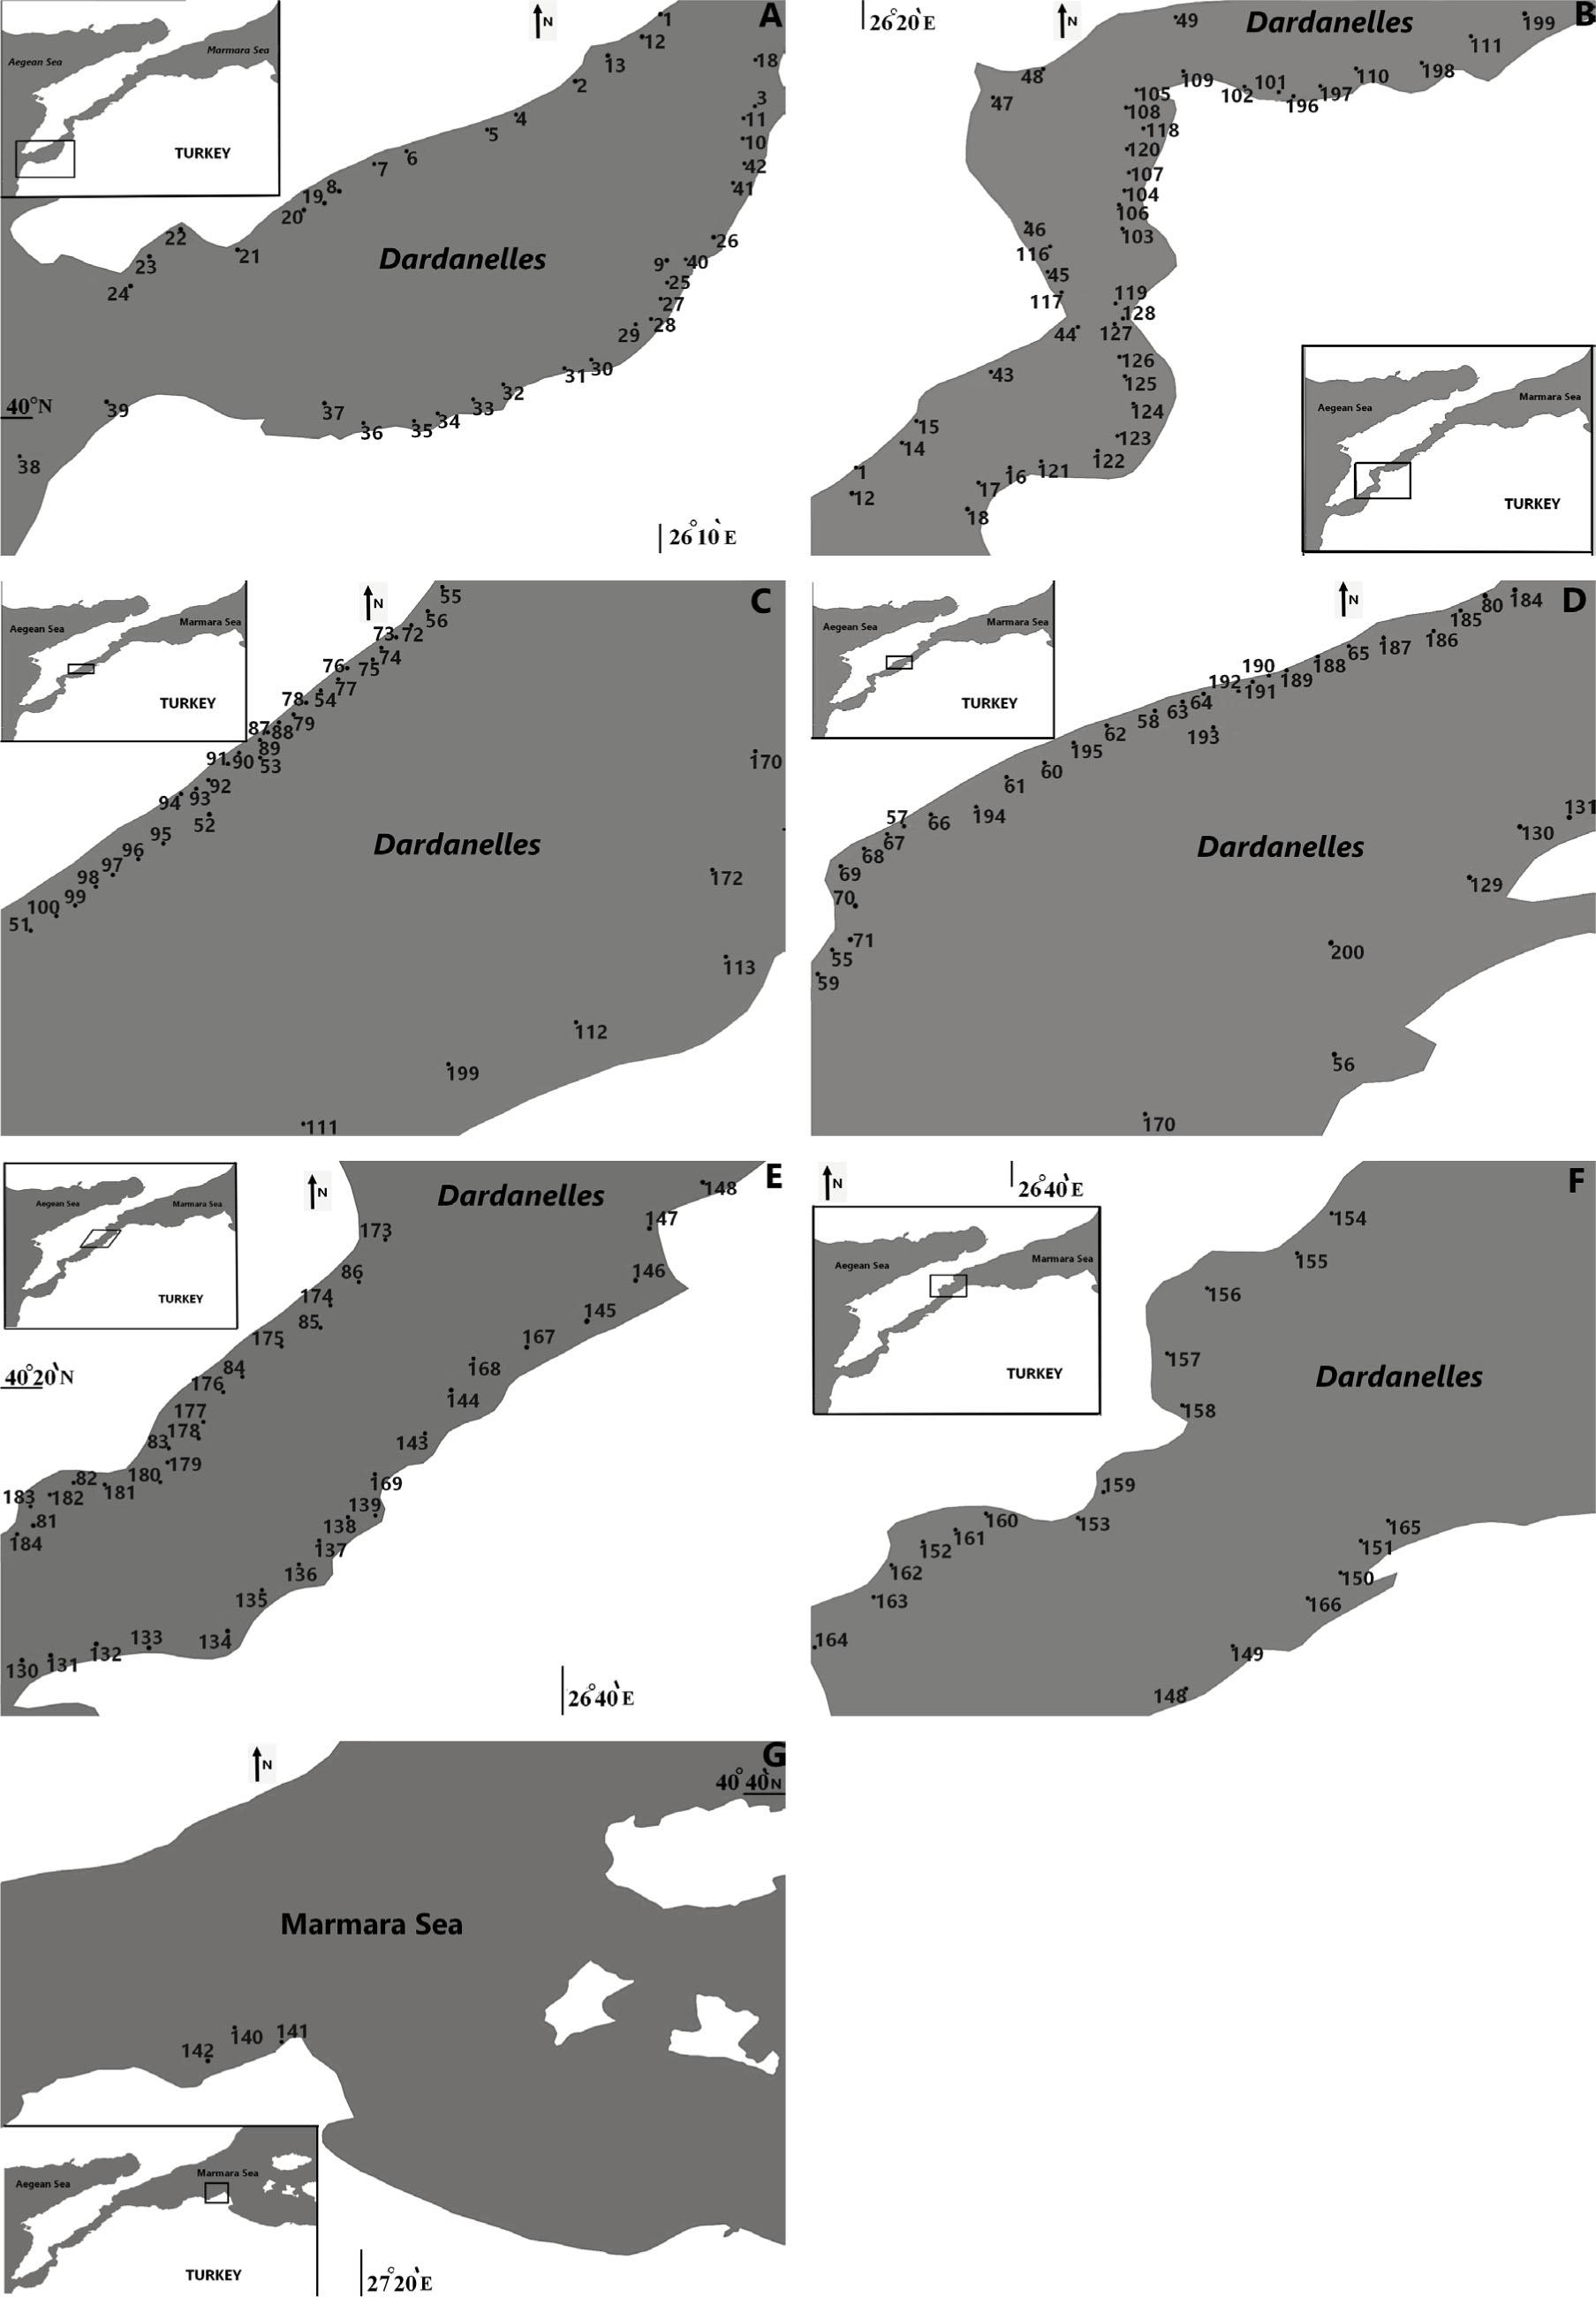
Figure 3
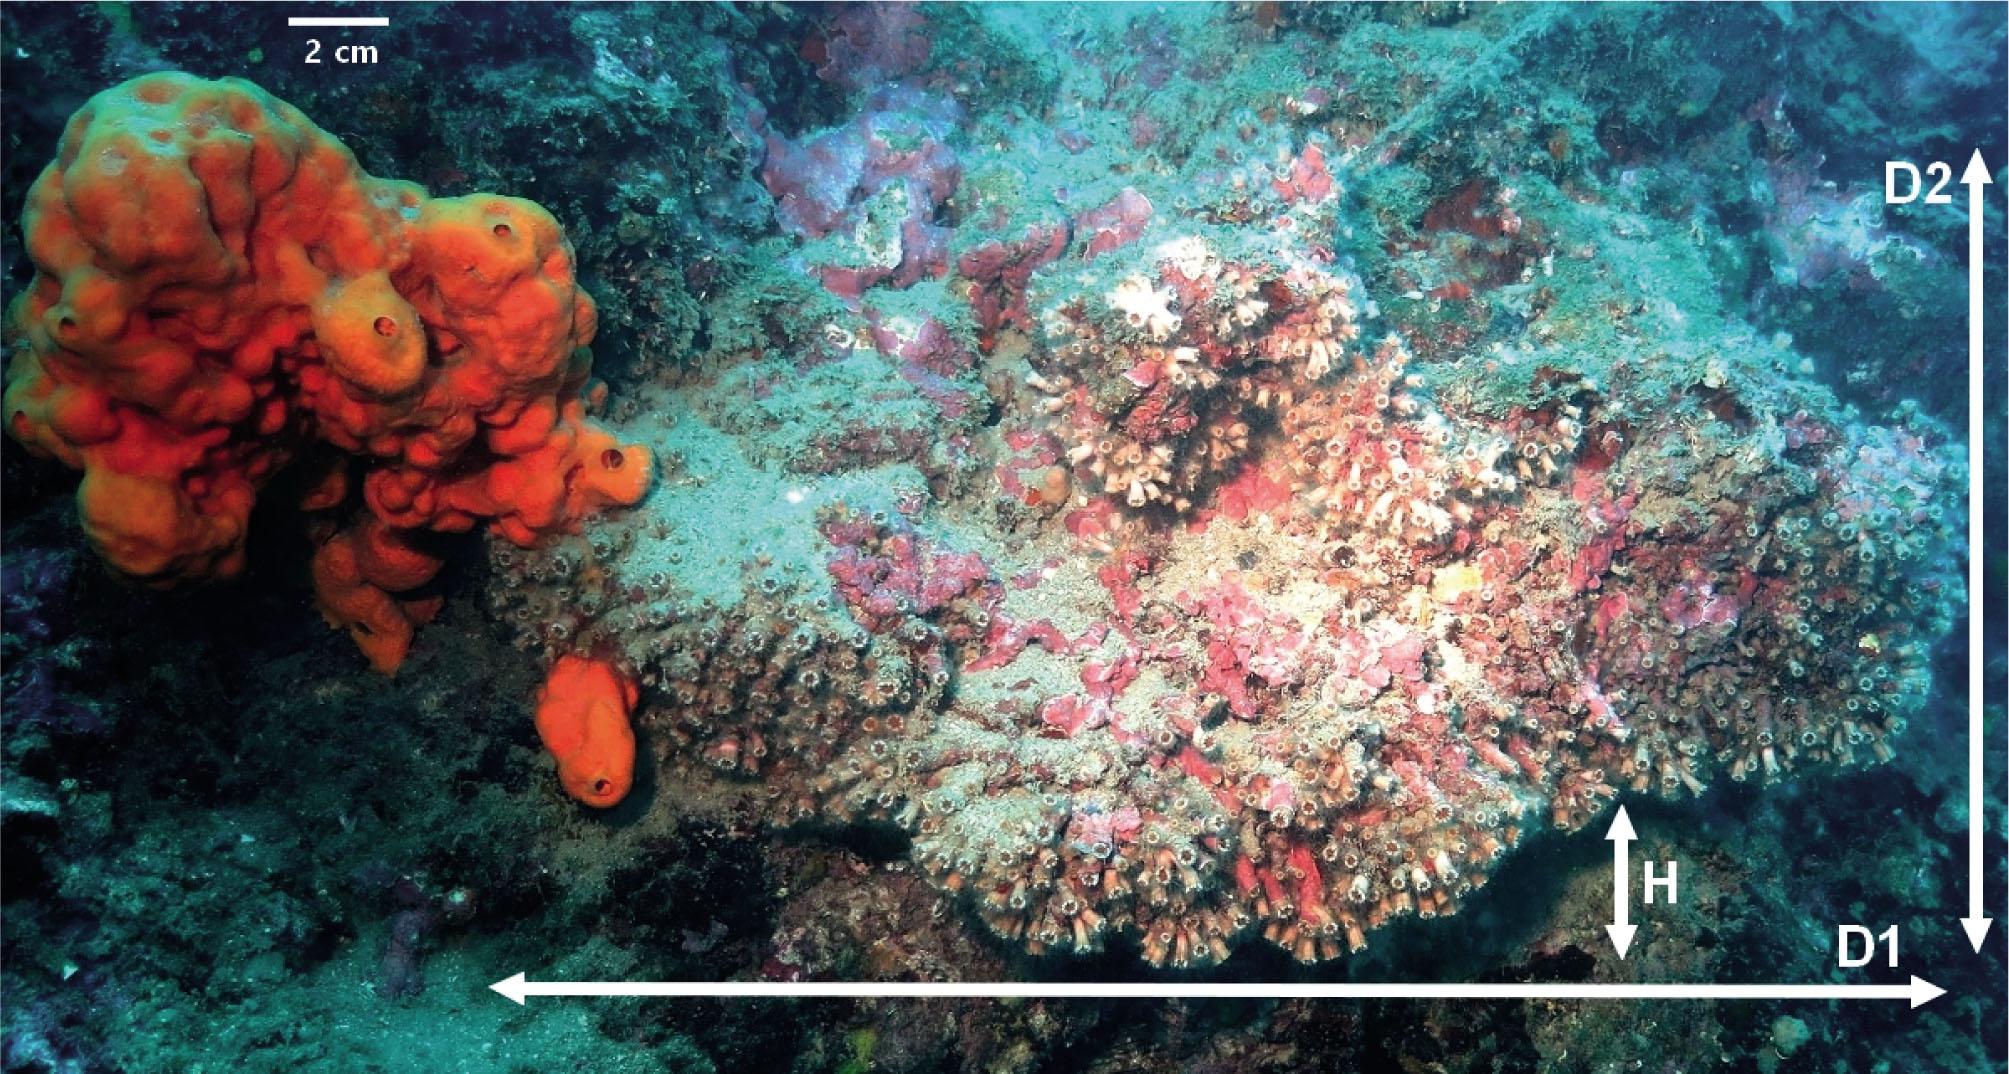
Figure 4

Figure 5
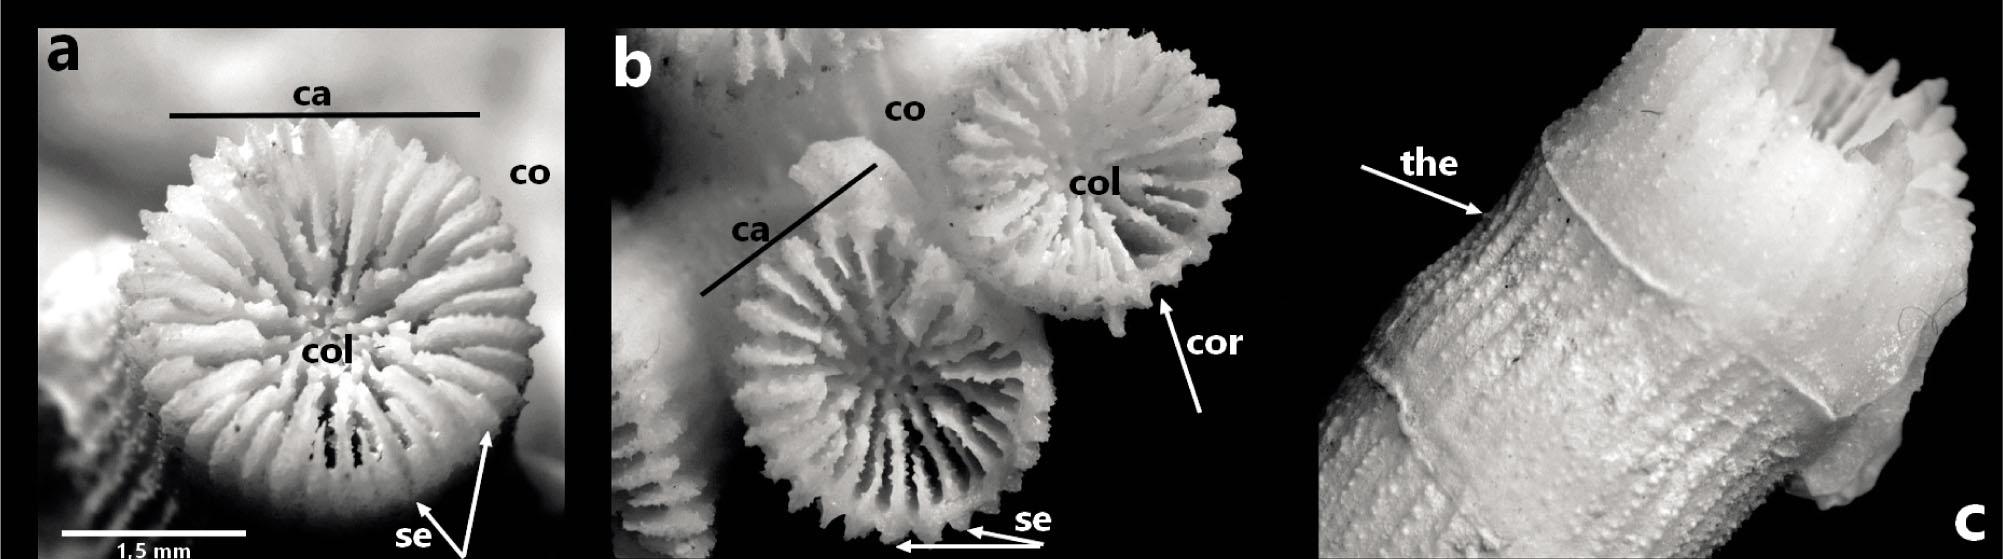
Figure 6

Figure 7
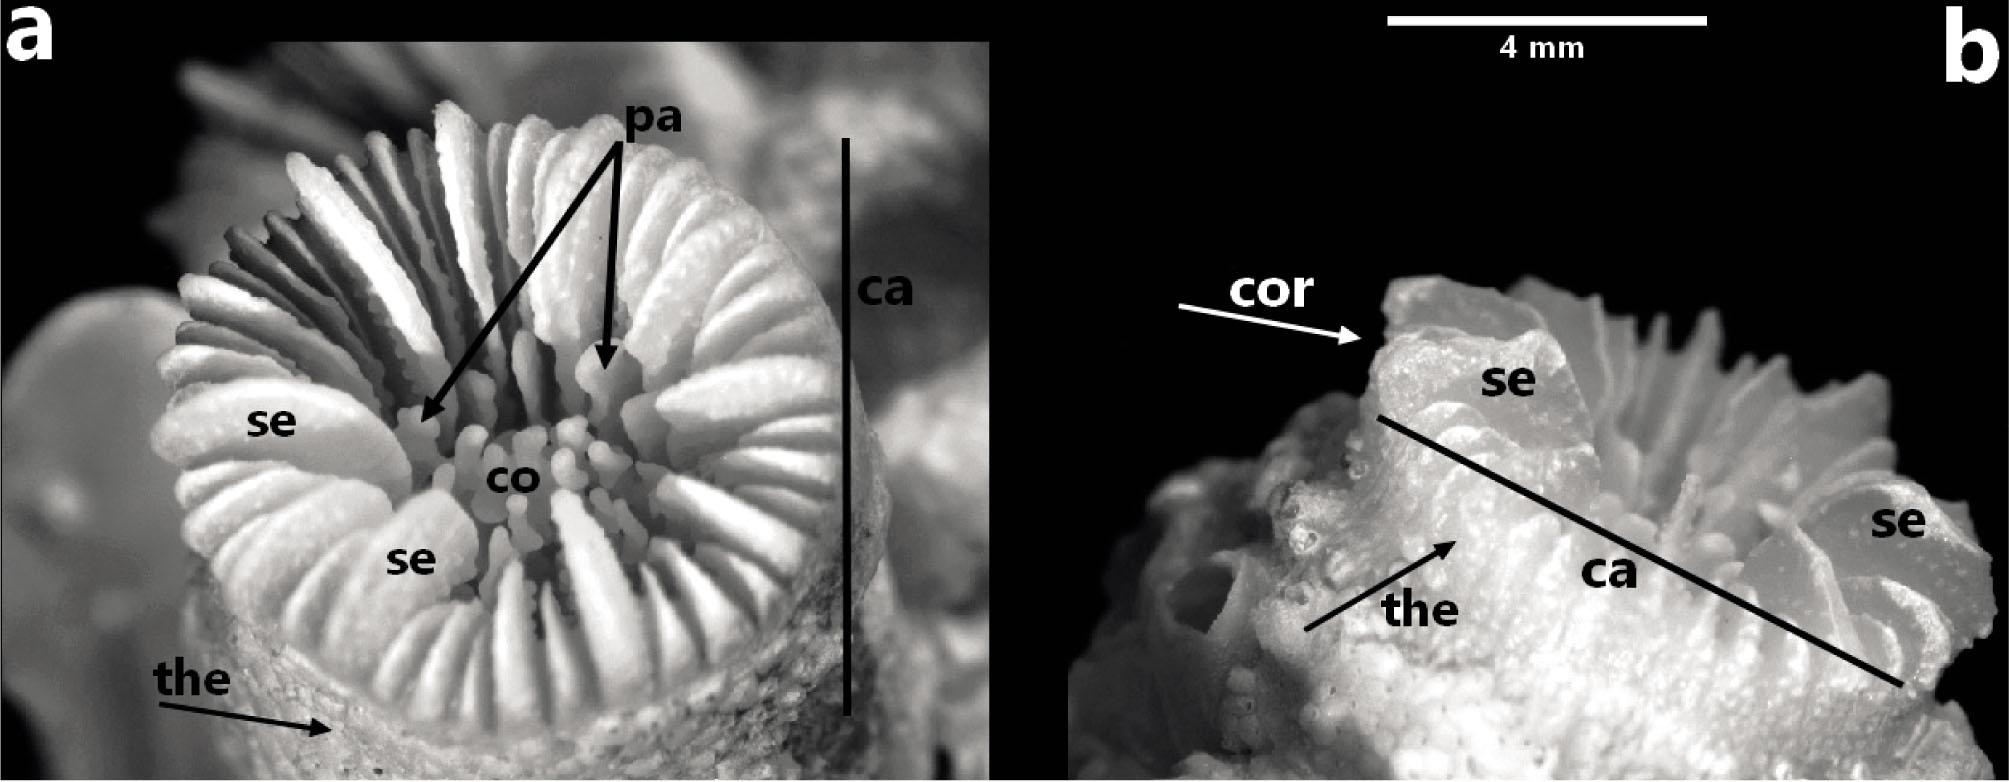
Figure 8
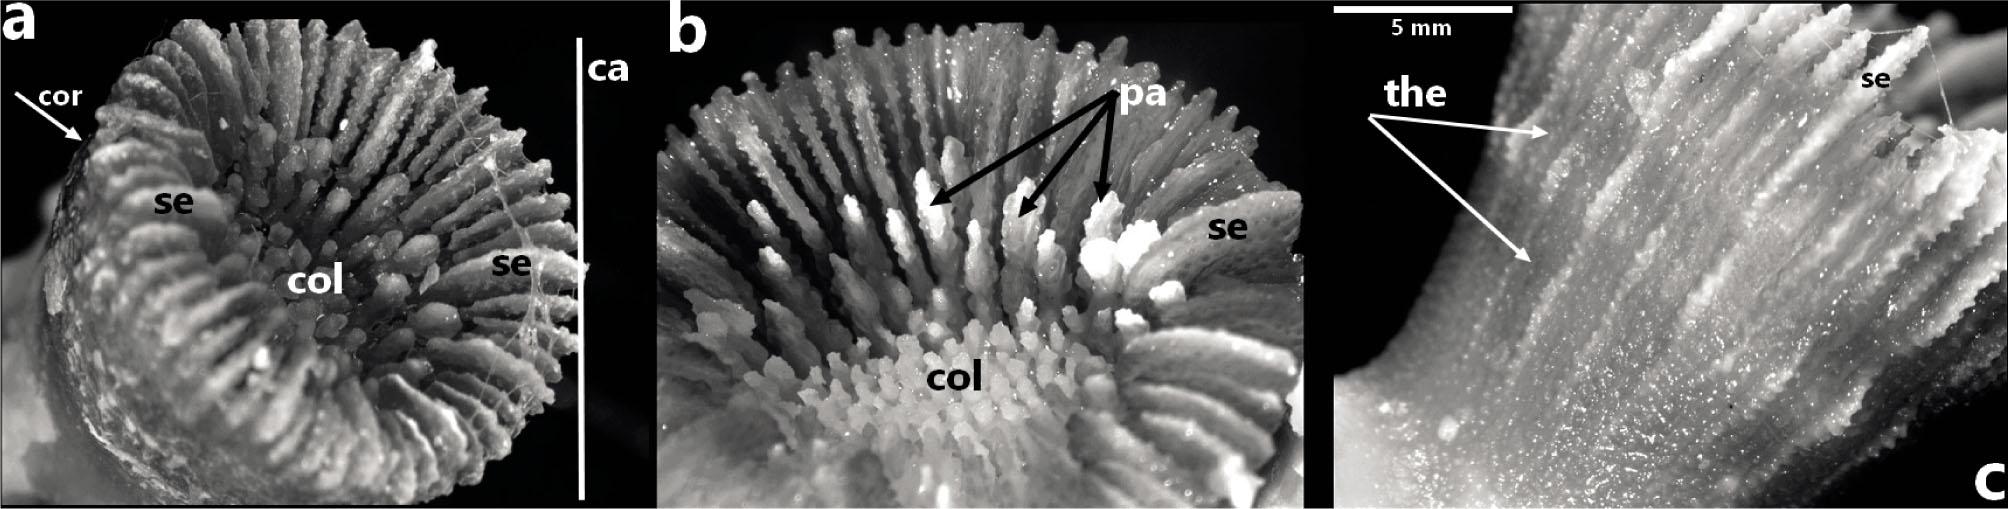
Figure 9
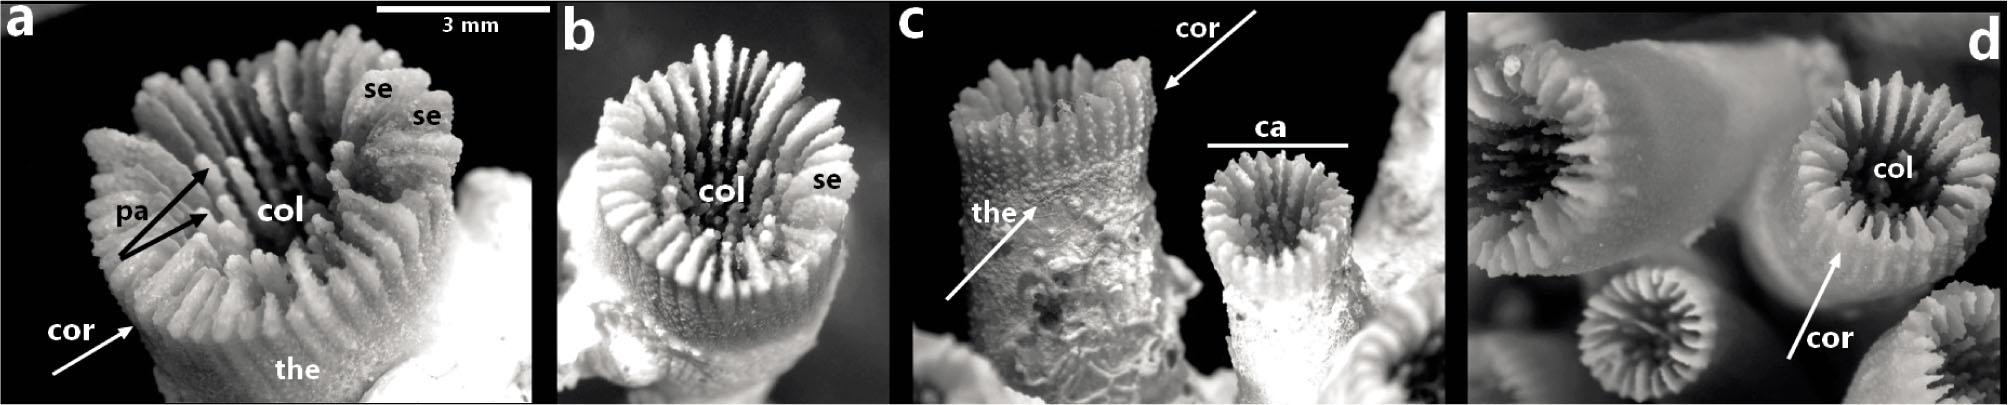
Figure 10
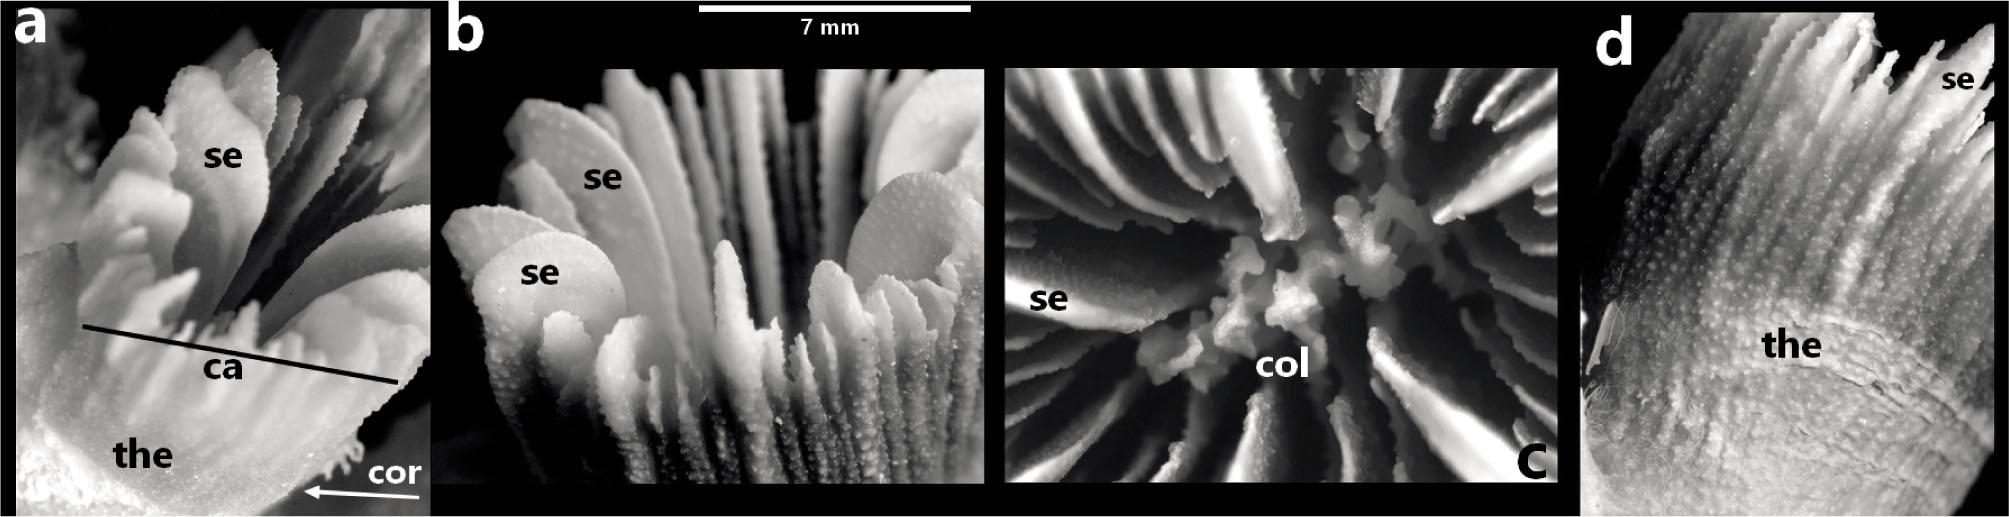
Figure 11
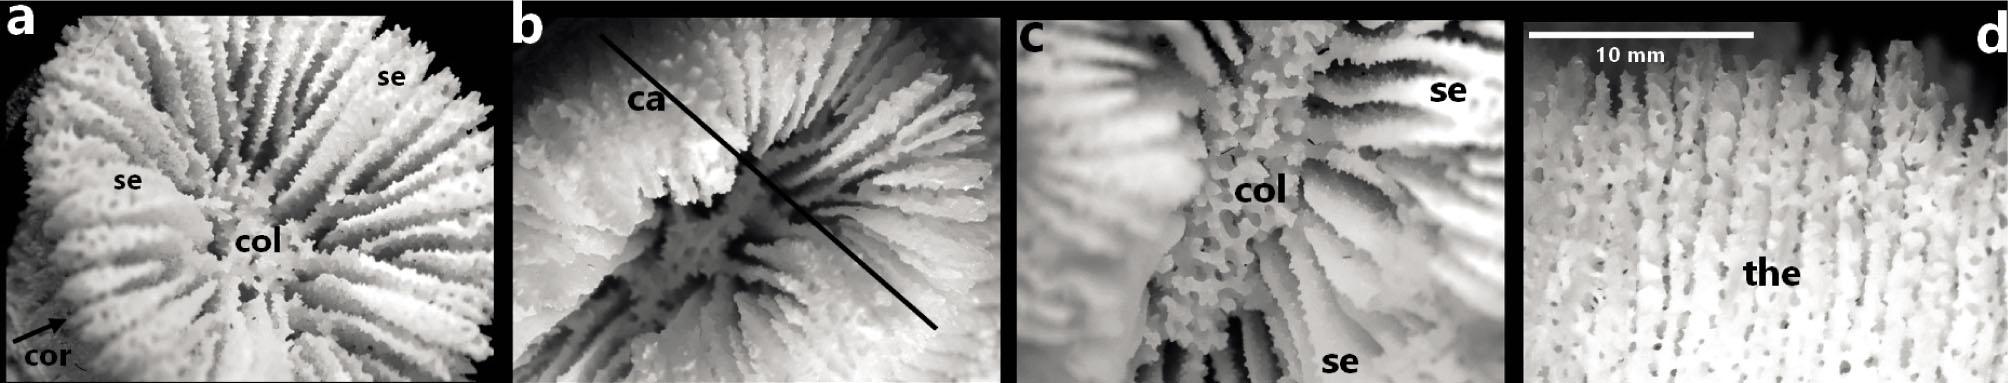
Figure 12
Figure 13
Figure 14
Figure 15
Figure 16
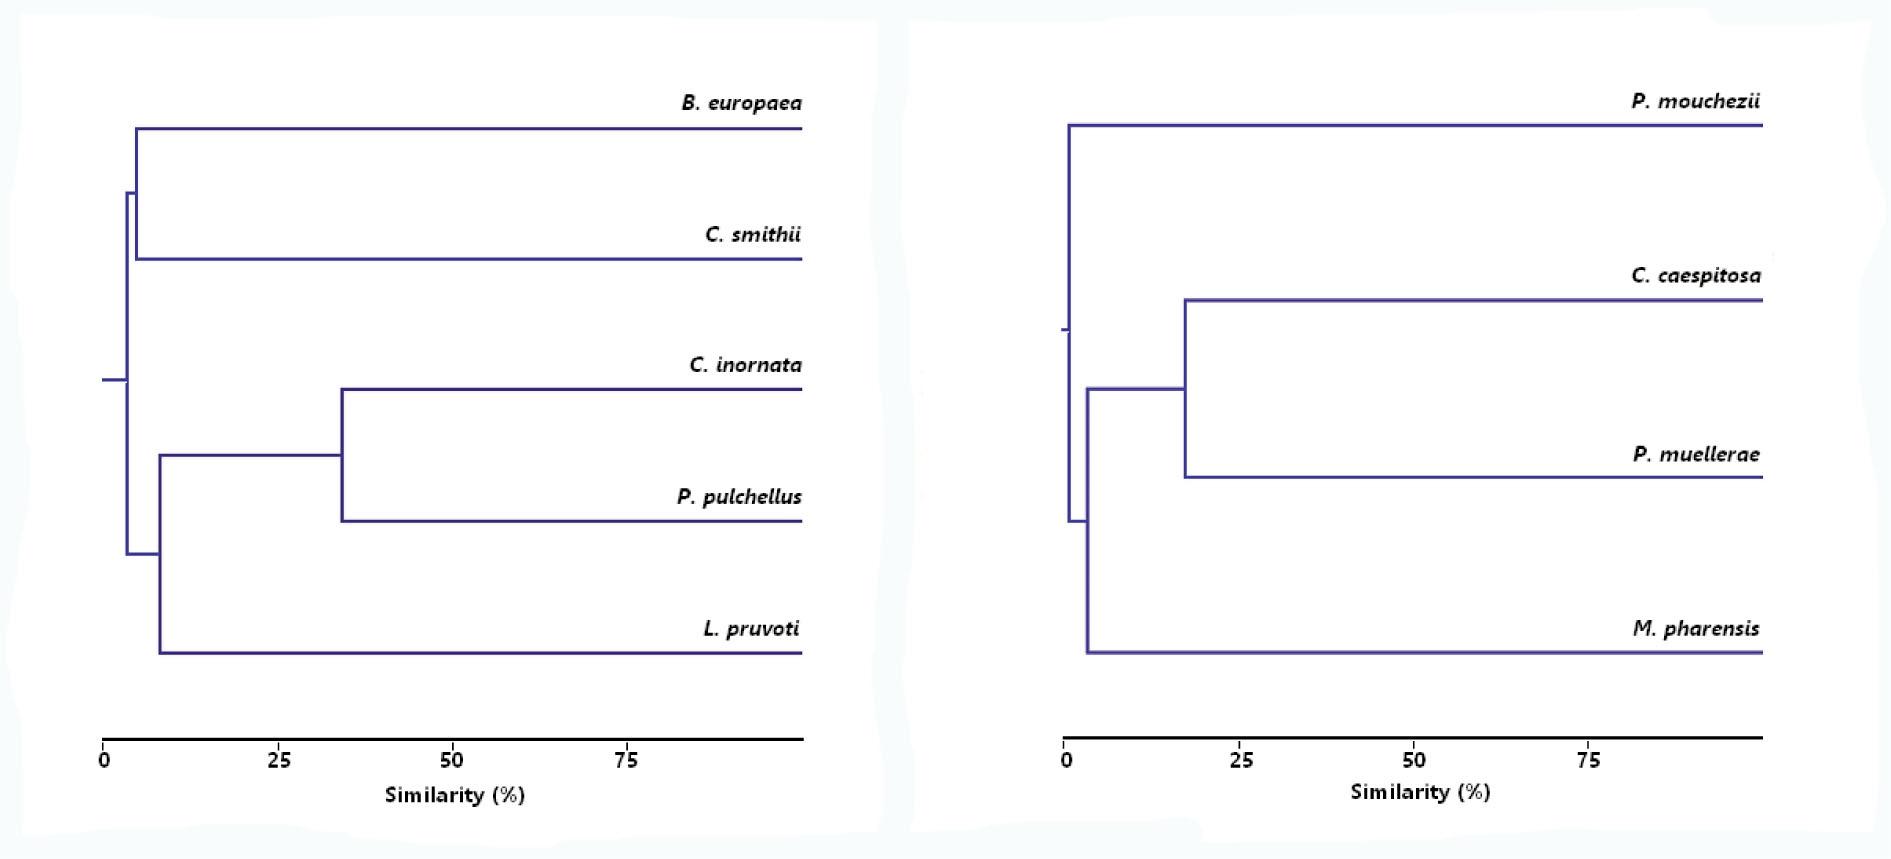
Figure 17
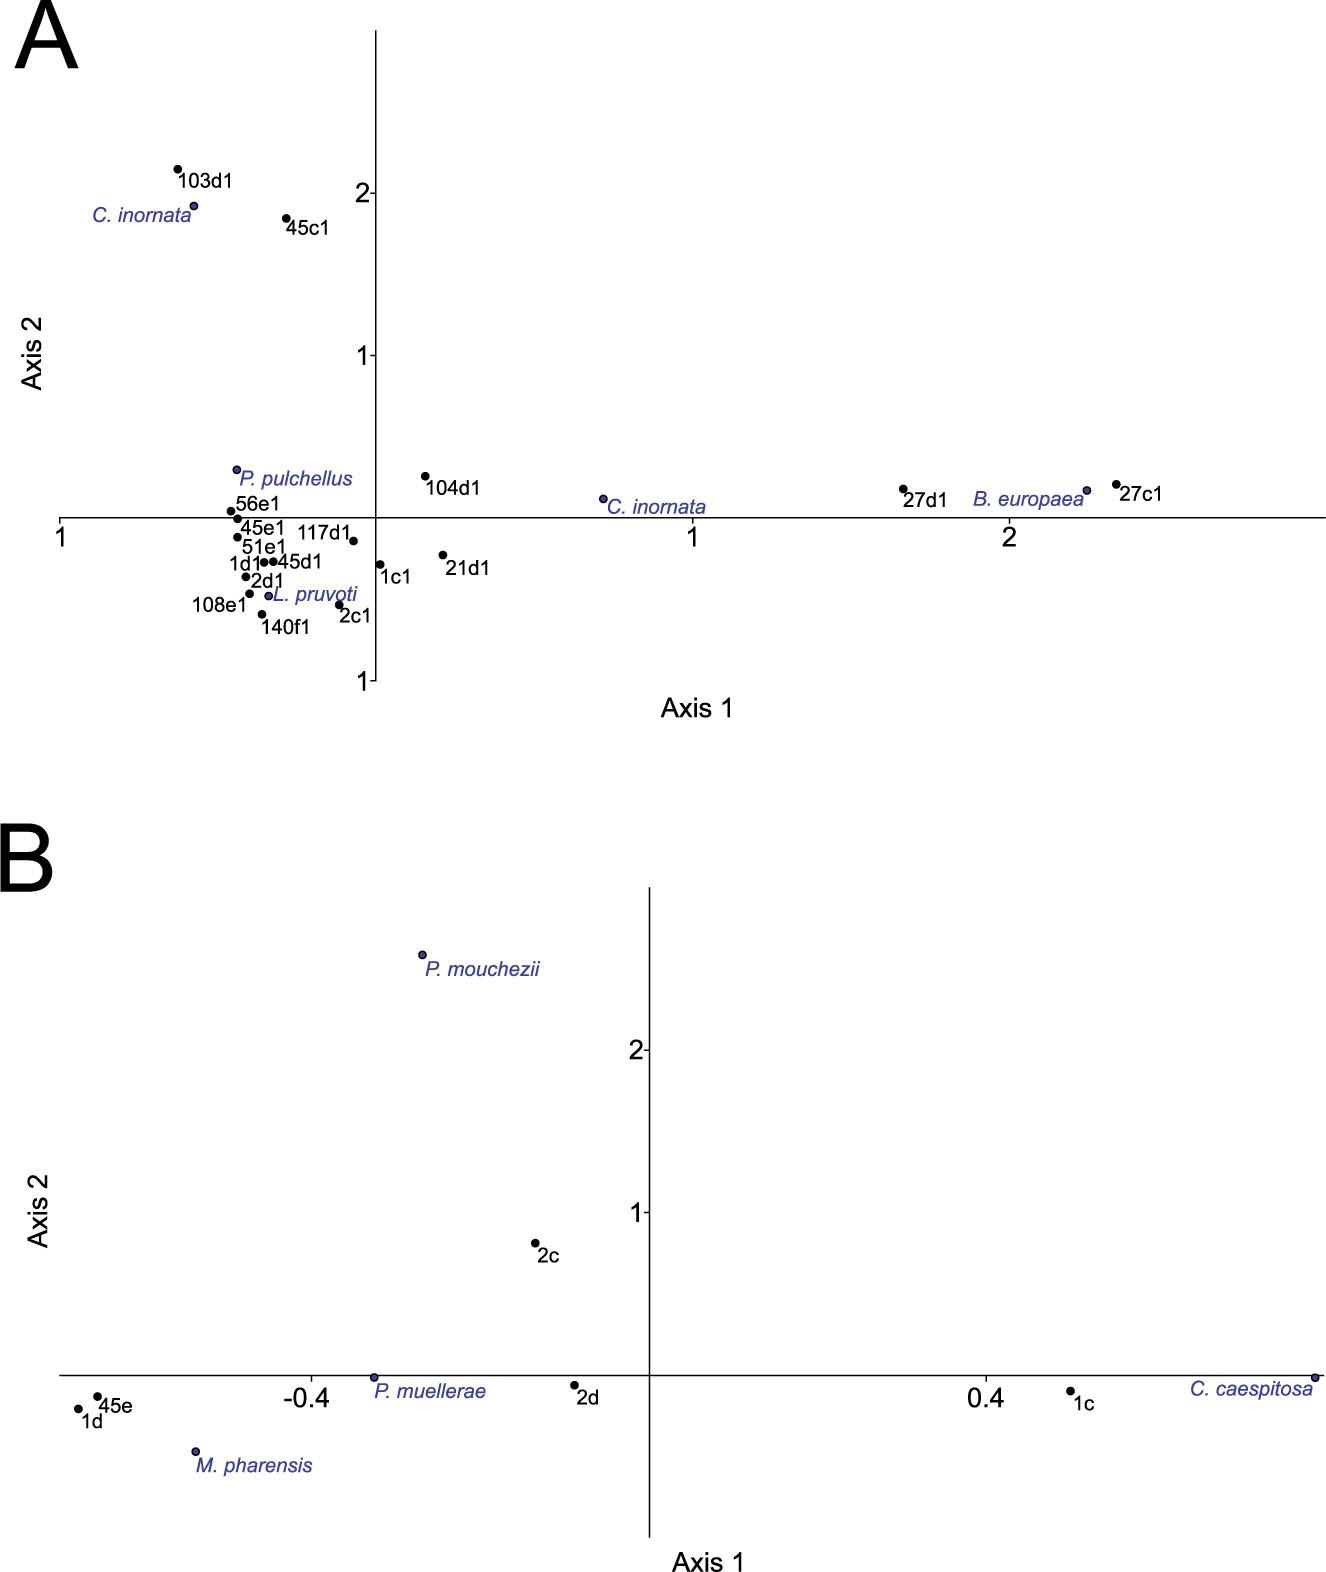
Figure 18
Rock-based percent cover of P_ muellerae at Station 45, C_ caespitosa at Station 1, P_ mouchezii at Station 2 and M_ pharensis at Stations 1 and 45
| Colony’s number | Cover Area (m2) | Surface Area of Rock (m2) | Percent Cover on Rock (%) | |||
|---|---|---|---|---|---|---|
| P. muellerae | ||||||
| p1 | 0.009 | 0.33 | 2.72 | |||
| p2 | 0.036 | 0.42 | 8.57 | |||
| p3 | 0.09 | 0.33 | 27.27 | |||
| p4 | 0.03 | 0.19 | 15.7 | |||
| p5 | 0.039 | 0.18 | 21.6 | |||
| p6 | 0.032 | 1.01 | 3.16 | |||
| p7 | 0.03 | 0.3 | 10 | |||
| p8 | 0.15 | 0.68 | 22.05 | |||
| p9 | 0.036 | 0.33 | 10.9 | |||
| p10 | 4.8 | 7.6 | 63.15 | |||
| p11 | 2.2 | 2.76 | 79.71 | |||
| p12 | 1.1 | 3 | 36.6 | |||
| p13 | 15.1 | 20 | 75.5 | |||
| p14 | 0.08 | 1.15 | 6.95 | |||
| p15 | 0.12 | 0.15 | 80 | |||
| p16 | 0.02 | 0.18 | 11.1 | |||
| p17 | 0.03 | 1.26 | 2.38 | |||
| p18 | 0.34 | 1.25 | 27.2 | |||
| p19 | 0.14 | 1.54 | 9.09 | |||
| p20 | 0.17 | 0.25 | 68 | |||
| p21 | 0.1 | 0.5 | 20 | |||
| p22 | 0.14 | 0.25 | 56 | |||
| p23 | 0.09 | 0.3 | 30 | |||
| p24 | 0.05 | 1.33 | 3.75 | |||
| p25 | 0.14 | 0.87 | 16.09 | |||
| p26 | 0.2 | 1.2 | 16.6 | |||
| p27 | 0.13 | 1.4 | 9.28 | |||
| p28 | 0.28 | 1.11 | 25.22 | |||
| p29 | 0.12 | 2.52 | 4.76 | |||
| p30 | 0.08 | 0.6 | 13.3 | |||
| p31 | 0.29 | 2.43 | 11.93 | |||
| p32 | 0.3 | 1.5 | 20 | |||
| p33 | 0.08 | 0.9 | 8.8 | |||
| p34 | 0.3 | 1.14 | 26.31 | |||
| p35 | 0.6 | 3.36 | 17.85 | |||
| p36 | 0.35 | 0.48 | 72.91 | |||
| p37 | 0.09 | 0.8 | 11.25 | |||
| C. caespitosa | ||||||
| c1 | 0.057 | 0.095 | 60 | |||
| c2 | 0.027 | 0.09 | 30 | |||
| c3 | 0.048 | 0.096 | 50 | |||
| c4 | 0.056 | 0.08 | 70 | |||
| c5 | 0.026 | 0.34 | 7.64 | |||
| c6 | 0.2 | 0.2 | 100 | |||
| c7 | 0.07 | 0.093 | 75.26 | |||
| c8 | 0.023 | 0.04 | 57.5 | |||
| c9 | 0.029 | 0.029 | 100 | |||
| c10 | 0.018 | 0.02 | 90 | |||
| c11 | 0.075 | 0.075 | 100 | |||
| c12 | 0.022 | 0.028 | 78.57 | |||
| c13 | 0.033 | 0.88 | 3.75 | |||
| c14 | 0.008 | 0.06 | 13.3 | |||
| c15 | 0.036 | 0.072 | 50 | |||
| c16 | 0.18 | 0.39 | 46.15 | |||
| c17 | 0.21 | 0.21 | 100 | |||
| c18 | 0.022 | 0.16 | 13.75 | |||
| P. mouchezii | ||||||
| pm1 | 0.2 | 0.6 | 33.3 | |||
| M. pharensis | ||||||
| m1 | 0.23 | 2.08 | 11.05 | |||
| m2 | 0.34 | 0.64 | 53.12 | |||
| m3 | 0.19 | 1.12 | 16.96 | |||
| m4 | 0.27 | 1.88 | 14.36 | |||
Colonial corals, morphological diameters and coral cover values assessed per station
| TNC | Covering Area | Total Biomass | Length | Width | Height | |
|---|---|---|---|---|---|---|
| (cm2) | (g) | (cm) | ||||
| Mean±SE (Range) | ||||||
| Madracis pharensis | ||||||
| Station 1 | 674.5±329.5 (345-1004) | 2850±550 (2300-3400) | 285.3±87.15 (198-372) | 77±1 (76-78) | 37.5±7.5 (30-45) | 6±1 (5-7) |
| Station 45 | 761±41 (720-802) | 2340±400 (1900-2700) | 70.09±12.31 (57-82) | 64±4 (60-68) | 36±4 (32-40) | 3±1 (2-4) |
| Cladocora caespitosa | ||||||
| Station 1 | 112±17 (16-300) | 630±150 (80-2100) | 4.979±0.384 (2.81-9.9) | 29.83±3.113 (17-61) | 19.28±2.15 (10-39) | 9.17±1.17 (2-19) |
| Station 2 | 214±84 (64-355) | 520±100 (350-710) | 2.873±0.576 (2.1-4) | 26.67±2.96 (21-31) | 19.23±1.86 (17-23) | 8.33±2.33 (4-12) |
| Station 3 | 251±19 (67-1000) | 2400±140 (570-6900) | 5.412±0.185 (2.64-10.14) | 56.77±1.59 (30-96) | 41.31±1.38 (19-72) | 8.4±0.35 (3-20) |
| Station 4* | 112 (112) | 300 (300) | 3.43 (3.43) | 26 (26) | 14 (14) | 5 (5) |
| Station 20 | 1518±1408 (110-2925) | 1240±1160 (80-2400) | 5.48±1.22 (4.26-6.69) | 31±32.5 (23-54) | 28±25.5 (10-46) | 14±14.1 (4-24) |
| Station 24* | 78 (78) | 800 (800) | 5.54 (5.54) | 30 (30) | 27 (27) | 8 (8) |
| Station 41* | 23 (23) | 100 (100) | 3.44 (3.44) | 15 (15) | 7 (7) | 3 (3) |
| Polycyathus muellerae | ||||||
| Station 1 | 73±12 (19-270) | 610±170 (100-4600) | 4.082±0.35 (1.9-8.6) | 20.69±2.18 (9-60) | 28.54±2.65 (13-78) | 5.11±0.5 (2-11) |
| Station 2 | 71±12 (32-136) | 240±50 (140-600) | 4.537±0.422 (1.8-5.75) | 10.44±1.21 (7-18) | 22.78±2.17 (18-34) | 5.67±1.08 (2-11) |
| Station 21* | 40 (40) | 100 (100) | 3.1 (3.1) | 8 (8) | 21 (21) | 3 (3) |
| Station 45 | 228±52 (30-1600) | 7540±4220 (90-151000) | 3.585±0.152 (1.94-5.6) | 47.7±9.74 (6-345) | 66.4±13.5 (15-440) | 6.56±0.61 (2-17) |
| Station 51* | 90 (90) | 700 (700) | 4.66 (4.66) | 30 (30) | 26 (26) | 6 (6) |
| Station 52* | 40 (40) | 100 (100) | 3.51 (3.51) | 10 (10) | 15 (15) | 2 (2) |
| Station 56* | 140 (140) | 1200 (1200) | 4.4 (4.4) | 30 (30) | 40 (40) | 4 (4) |
| Station 103 | 37±7 (23-55) | 20±3 (10-30) | 3.105±0.434 (2.17-4.21) | 4.75±0.47 (4-6) | 5.5±0.95 (4-8) | 3.5±0.28 (3-4) |
| Station 104* | 46 (46) | 200 (200) | 4.88 (4.88) | 10 (10) | 20 (20) | 4 (4) |
| Station 108 | 212±176 (36-388) | 950±850 (100-180) | 4.045±0.205 (3.84-4.25) | 19±5 (14-24) | 43.5±31.5 (12-75) | 7.5±4.5 (3-12) |
| Station 109* | 41 (41) | 400 (400) | 2.23 (2.23) | 22 (22) | 21 (21) | 4 (4) |
| Station 110* | 86 (86) | 900 (900) | 3.24 (3.24) | 22 (22) | 41 (41) | 4 (4) |
| Station 117 | 108±21 (10-423) | 510±100 (30-1700) | 4.66±0.219 | 16.29±2.33 | 19.95±1.99 | 4.04±0.51 |
| Station 140* | 12 (12) | 20 (20) | 1.68 (1.68) | 4 (4) | 7 (7) | 4 (4) |
| Phyllangia mouchezii | ||||||
| Station 2* | 210 (210) | 2000 (2000) | 17 (17) | 41 (0-41) | 55 (0-55) | 21 (0-21) |
Solitary corals, morphological diameters calculated per station
| TNI | Total Biomass | Length | Height | |
|---|---|---|---|---|
| (g) | (cm) | |||
| Mean±SE (Range) | ||||
| Caryophyllia smithii | ||||
| Station 6* | 18 (18) | 28.53 (28.53) | 0.65±0.15 (0.5-0.8) | 1.2±0.2 (1-1.4) |
| Station 27* | 18 (18) | 10.42 (10.42) | 0.34±0.05 (0.15-0.5) | 0.96±0.06 (0.6-1.2) |
| Station 103* | 18 (18) | 15.63 (15.63) | 0.59±0.03 (0.4-0.9) | 0.76±0.05 (0.5-1.2) |
| Station 140 | 96±128 (6-187) | 18.43±11.78 (10.1-26.76) | 1.87±0.11 (1.69-2.1) | 1.67±0.19 (1.4-1.8) |
| Station 141* | 31 (31) | 24.66 (24.66) | 1.74±0.09 (1.59-1.82) | 1.56±0.06 (1.5-1.7) |
| Station 142* | 131 (131) | 8.24 (8.24) | 1.92±0.11 (1.69-2.1) | 1.64±0.15 (1.5-1.8) |
| Caryophyllia inornata | ||||
| Station 1* | 6 (6) | 2.49±0.67 (2.01-2.97) | 0.65±0.15 (0.5-0.8) | 1.2±0.2 (1-1.4) |
| Station 45 | 16±9 (6-25) | 2.61±0.57 (1.98-3.09) | 0.34±0.05 (0.15-0.5) | 0.96±0.06 (0.6-1.2) |
| Station 103* | 137 (137) | 2.91 (2.91-2.91) | 0.59±0.03 (0.4-0.9) | 0.76±0.05 (0.5-1.2) |
| Station 117* | 6 (6) | 1.88 (1.88-1.88) | 0.6 (0.6-0.6) | 0.9 (0.9-0.9) |
| Paracyathus pulchellus | ||||
| Station 1* | 18 (8) | 8.8 (8.8) | 0.6±0.06 (0.6-0.8) | 1.1±0.5 (1-1.2) |
| Station 2* | 12 (12) | 8.21 (8-21) | 0.6±0.1 (0.5-0.7) | 1.05±0.05 (1.-1.1) |
| Station 45 | 8±5 (6-18) | 9.15±0.88 (7.89-10.11) | 0.87±0.14 (0.5-1.2) | 1.4±0.15 (1-1.7) |
| Station 51* | 6 (6) | 9.13±1.52 (8.05-10.2) | 1.05±0.05 (1-1.1) | 1.45±0.05 (1.4-1.5) |
| Station 52* | 6 (6) | 9 (6) | 1.8 (1.8) | 1.5 (1.5) |
| Station 56* | 12 (12) | 8.77 (6) | 0.9±0.3 (0.6-1.2) | 1.35±0.35 (1-1.7) |
| Station 103* | 18 (18) | 6 (6) | 0.8±0.1 (0.7-1) | 1.2±0.15 (1-1.5) |
| Station 104* | 6 (6) | 7.55 (7.55) | 0.5 (0.5) | 1 (1) |
| Station 108* | 6 (6) | 6.54 (6.54) | 0.7 (0.7) | 1.2 (1.2) |
| Station 117* | 6 (6) | 11.3 (11.3) | 0.7 (0.7) | 1.1 (1.1) |
| Balanophyllia europaea | ||||
| Station 1* | 12 (12) | 29.9 (29.9-29.9) | 1.65±0.25 (1.4-1.9) | 2.65±0.15 (2.5-2.8) |
| Station 2* | 6 (6) | 24 (24-24) | 1.4 (1.4-1.4) | 2.5 (2.5-2.5) |
| Station 3* | 6 (6) | 21.98 (21.98-21.98) | 0.6 (0.6-0.6) | 1.6 (1.6-1.6) |
| Station 9* | 6 (6) | 25 (25-25) | 1 (1-1) | 2.1 (2.1-2.1) |
| Station 10* | 6 (6) | 21.28 (21.28-21.28) | 1.9 (1.9-1.9) | 3 (3) |
| Station 11* | 12 (12) | 13.9 (13.9-13.9) | 0.75±0.05 (0.7-0.8) | 1.75±0.15 (1.6-1.9) |
| Station 18* | 12 (12) | 10.66 (10.66-10.66) | 0.75±0.05 (0.7-0.8) | 1.35±0.15 (1.2-1.5) |
| Station 20* | 6 (6) | 33.95 (33.95) | 0.7 (0.7) | 1.6 (1.6) |
| Station 23* | 6 (6) | 28.3 (28.3) | 1.8 (1.8) | 2.3 (2.3) |
| Station 24* | 12 (12) | 20 (20) | 1.4±0.3 (1.1-1.7) | 2.5±0.1 (2.4-2.6) |
| Station 26* | 6 (6) | 24.41 (24.41) | 1.1 (1.1) | 1.9 (1.9) |
| Station 27 | 122±116 (6-237) | 32.97±4.53 (28.44-37.5) | 1.32±0.07 (0.5-2.4) | 2.54±0.1 (1.2-3.9) |
| Station 30* | 12 (12) | 12.65 (12.65) | 0.7±0.1 (0.6-0.8) | 1.3±0.1 (1.2-1.4) |
| Station 35* | 12 (12) | 14.2 (14.2) | 1.15±0.05 (1.1-1.2) | 2.2±0.3 (1.9-2.5) |
| Station 38* | 18 (18) | 12.47 (12.47) | 1.4±0.11 (1.2-1.6) | 2.43±0.32 (1.8-2.9) |
| Station 39* | 18 (18) | 11.98 (11.98) | 1.73±0.12 (1.5-1.9) | 2.5±0.2 (2.2-2.9) |
| Station 40* | 18 (18) | 10.1 (10.1) | 1.36±0.03 (1.3-1.4) | 2.36±0.06 (2.3-2.5) |
| Station 41* | 6 (6) | 15.45 (15.45) | 1.1 (1.1) | 1.8 (1.8) |
| Station 42* | 6 (6) | 15 (15) | 1.3 (1.3) | 1.9 (1.9) |
| Station 43* | 6 (6) | 14.64 (14.64) | 0.8 (0.8) | 1.9 (1.9) |
| Station 44* | 6 (6) | 12.08 (12.08) | 1.3 (1.3) | 2.2 (1.9) |
| Station 103* | 6 (6) | 42 (42) | 1.6 (1.6) | 2.5 (2.5) |
| Station 117* | 6 (6) | 16.76 (16.76) | 2.3 (2.3) | 2.2 (2.2) |
| Station 119* | 6 (6) | 11.4 (11.4) | 1.1 (1.1) | 2 (2) |
| Leptopsammia pruvoti | ||||
| Station 1 | 87±6 (81-93) | 7.79±0.63 (7.16-8.42) | 1.57±0.04 (1.2-1.5) | 1.09±0.02 (0.8-1.4) |
| Station 2 | 49±12 (37-62) | 4.21±0.1 (4.11-4.32) | 1.59±0.06 (1.2-1.5) | 1.08±0.03 (0.8-1.4) |
| Station 21* | 6 (6) | 4.19 (4.19-4.19) | 1.5 (1.5) | 1.1 (1.1) |
| Station 45 | 124±56 (68-181) | 11.67±3.03 (6.64-14.7) | 1.41±0.02 (1.1-1.4) | 2.41±0.12 (1.5-3.9) |
| Station 51* | 6 (6) | 11.18 (11.18) | 1.5 (1.5) | 1.1 (1.1) |
| Station 52* | 6 (6) | 12.43 (12.43) | 1.3 (1.3) | 1.5 (1.5) |
| Station 56* | 6 (6) | 9.86 (9.86) | 1.5 (1.5) | 3 (3-3) |
| Station 104* | 6 (6) | 8.89 (8.89) | 1.4 (1.5) | 1.4 (1.4) |
| Station 108* | 6 (6) | 18.85 (18.85) | 1.4 (1.4) | 3.1 (3.1) |
| Station 109* | 6 (6) | 12.71 (12.71) | 1.5 (1.5) | 1.1 (1.1) |
| Station 110* | 6 (6) | 10.65 (10.65) | 1.4 (1.4) | 1.8 (1.8) |
| Station 117* | 50 (50) | 12.5 (12.5) | 1.22±0.1 (1-1.5) | 1.66±0.13 (1.3-2) |
| Station 140* | 850 (850) | 4.22 (4.22) | 0.48±0.02 (0.4-0.6) | 0.67±0.03 (0.5-0.9) |
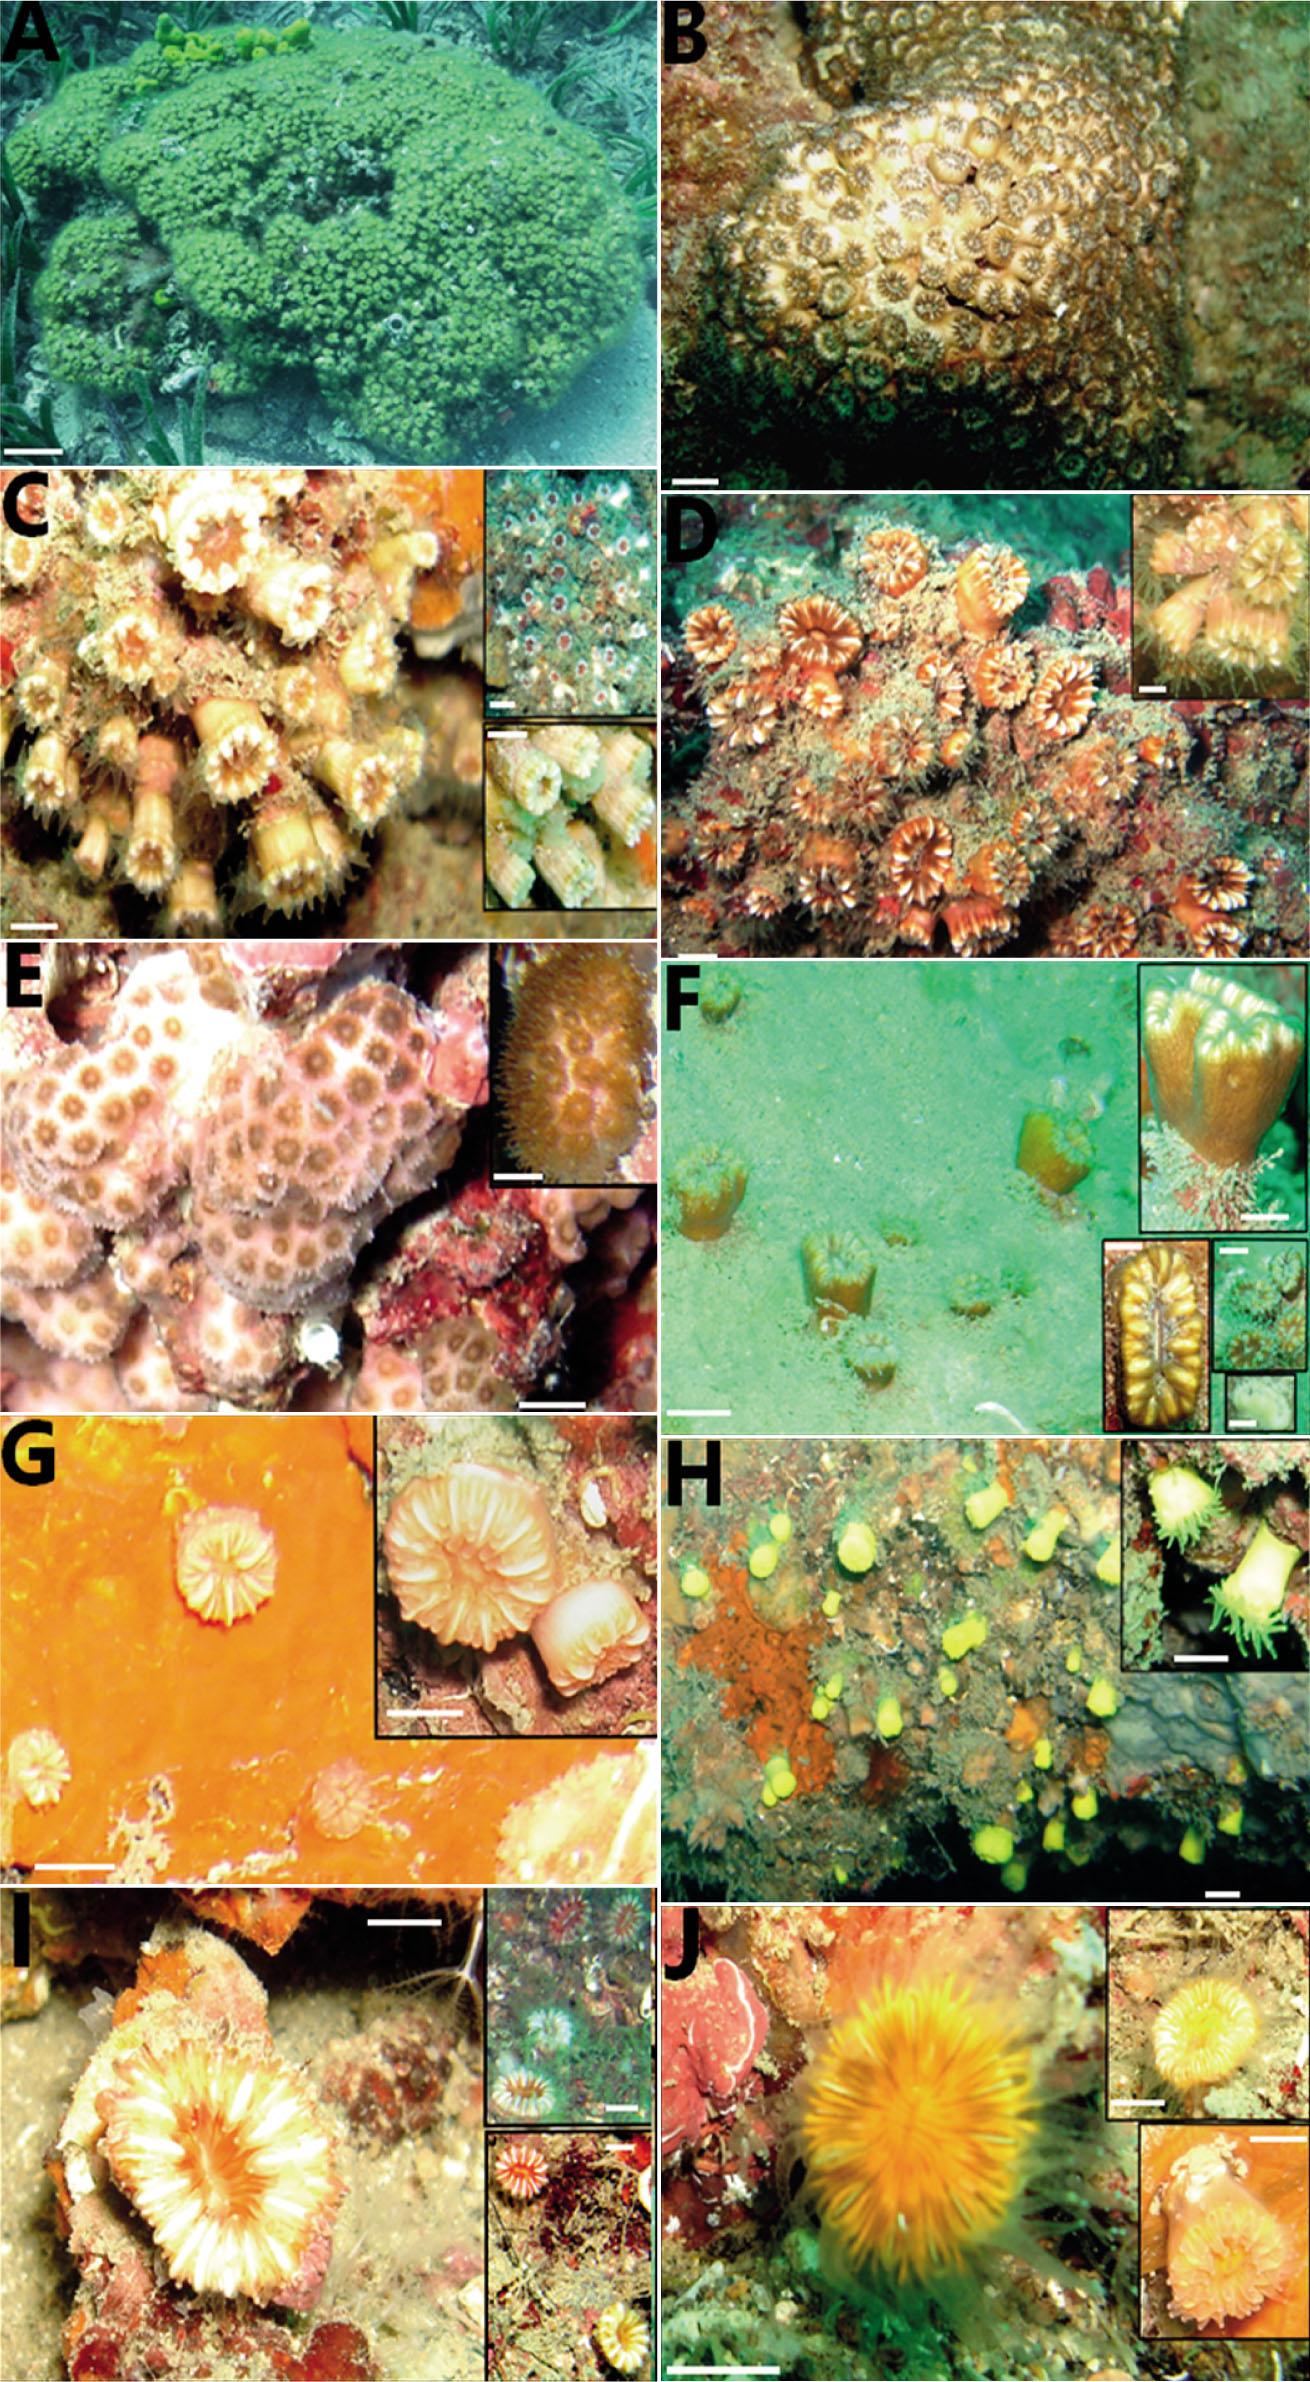
List of scleractinian corals from the Turkish coasts with the updated distributional data
| Species | BS | M | AE | MS | D | Habitat | DR |
|---|---|---|---|---|---|---|---|
| Phylum: Cnidaria | |||||||
| Class: Anthozoa | |||||||
| Family: Pocilloporidae | |||||||
| Madracis pharensis 1 Heller, 1868; | - | FL1 | FL2 | - | FL3-PR | H | VII |
| Family: Faviidae | |||||||
| Cladocora caespitosa 2 Linnaeus, 1767; | - | FL4 | FL5-PR | - | FL6-PR | H | II |
| Family: Caryophylliidae | |||||||
| Caryophyllia smithii 3 Stokes & Broderip, 1828; | - | FL7 | FL7* | FL8-PR | FL10-PR | H | IV |
| Caryophyllia cyathus 10 Ellis and Solander, 1786; | - | - | - | FL23 | - | H | 70-300 m** |
| Coenocyathus anthophyllites 11 Milne-Edwards and Haime, 1848; | - | - | - | FL10 | - | H | 65-250 m** |
| Hoplangia durotrix 13 Gosse, 1860; | - | - | FL22 | - | - | H | 0-150 m** |
| Caryophyllia inornata 4 Duncan, 1878; | - | FL11 | FL12 | - | PR | H | IX |
| Paracyathus pulchellus 5 Philippi, 1842; | - | - | - | FL13 | PR | H | VIII |
| Polycyathus muellerae 6 Abel, 1959; | - | FL14 | FL15 | PR | PR | H,S | V |
| Phyllangia mouchezii 7 Lacaze-Duthiers, 1897; | - | FL16 | FL17 | - | PR | H | III |
| Desmophyllum dianthus 12 Esper, 1794; | - | - | - | FL24 | - | H | 8-2460 m** |
| Family: Dendrophylliidae | |||||||
| Alanophyllia europaea 8 Risso, 1826; | - | FL18 | FL19 | - | FL19-PR | H,R | I |
| B. Leptopsammia pruvoti 7 Lacaze-Duthiers, 1897; | - | FL21 | FL22* | - | PR | H | VI |
| Dendrophyllia ramea 9 Linnaeus, 1758; | - | - | - | FL10 | - | H | 40-150 m** |
| Oculina patogonica 14 De Angelis, 1908; | - | FL25 | - | - | - | H | 0-10 m** |
Coral cover determined in terms of the rocky substrate range at the stations with the highest species abundance
| Station/tars (m2) | species/cover area (m2) | |||
|---|---|---|---|---|
| M. pharensis | C. caespitosa | P. muellerae | P. mouchezii | |
| Sta 1 – 800 | 0.63 | 1.14 | 1.58 | - |
| Sta 2 – 410 | - | 0.15 | 0.22 | 0.2 |
| Sta 3 – 350 | - | 18.11 | - | - |
| Sta 20 – 200 | - | 0.24 | - | - |
| Sta 45 – 1120 | 0.48 | - | 27.89 | - |
| Sta 108 – 208 | - | - | 0.19 | - |
| Sta 117 – 110 | - | - | 1.07 | - |