
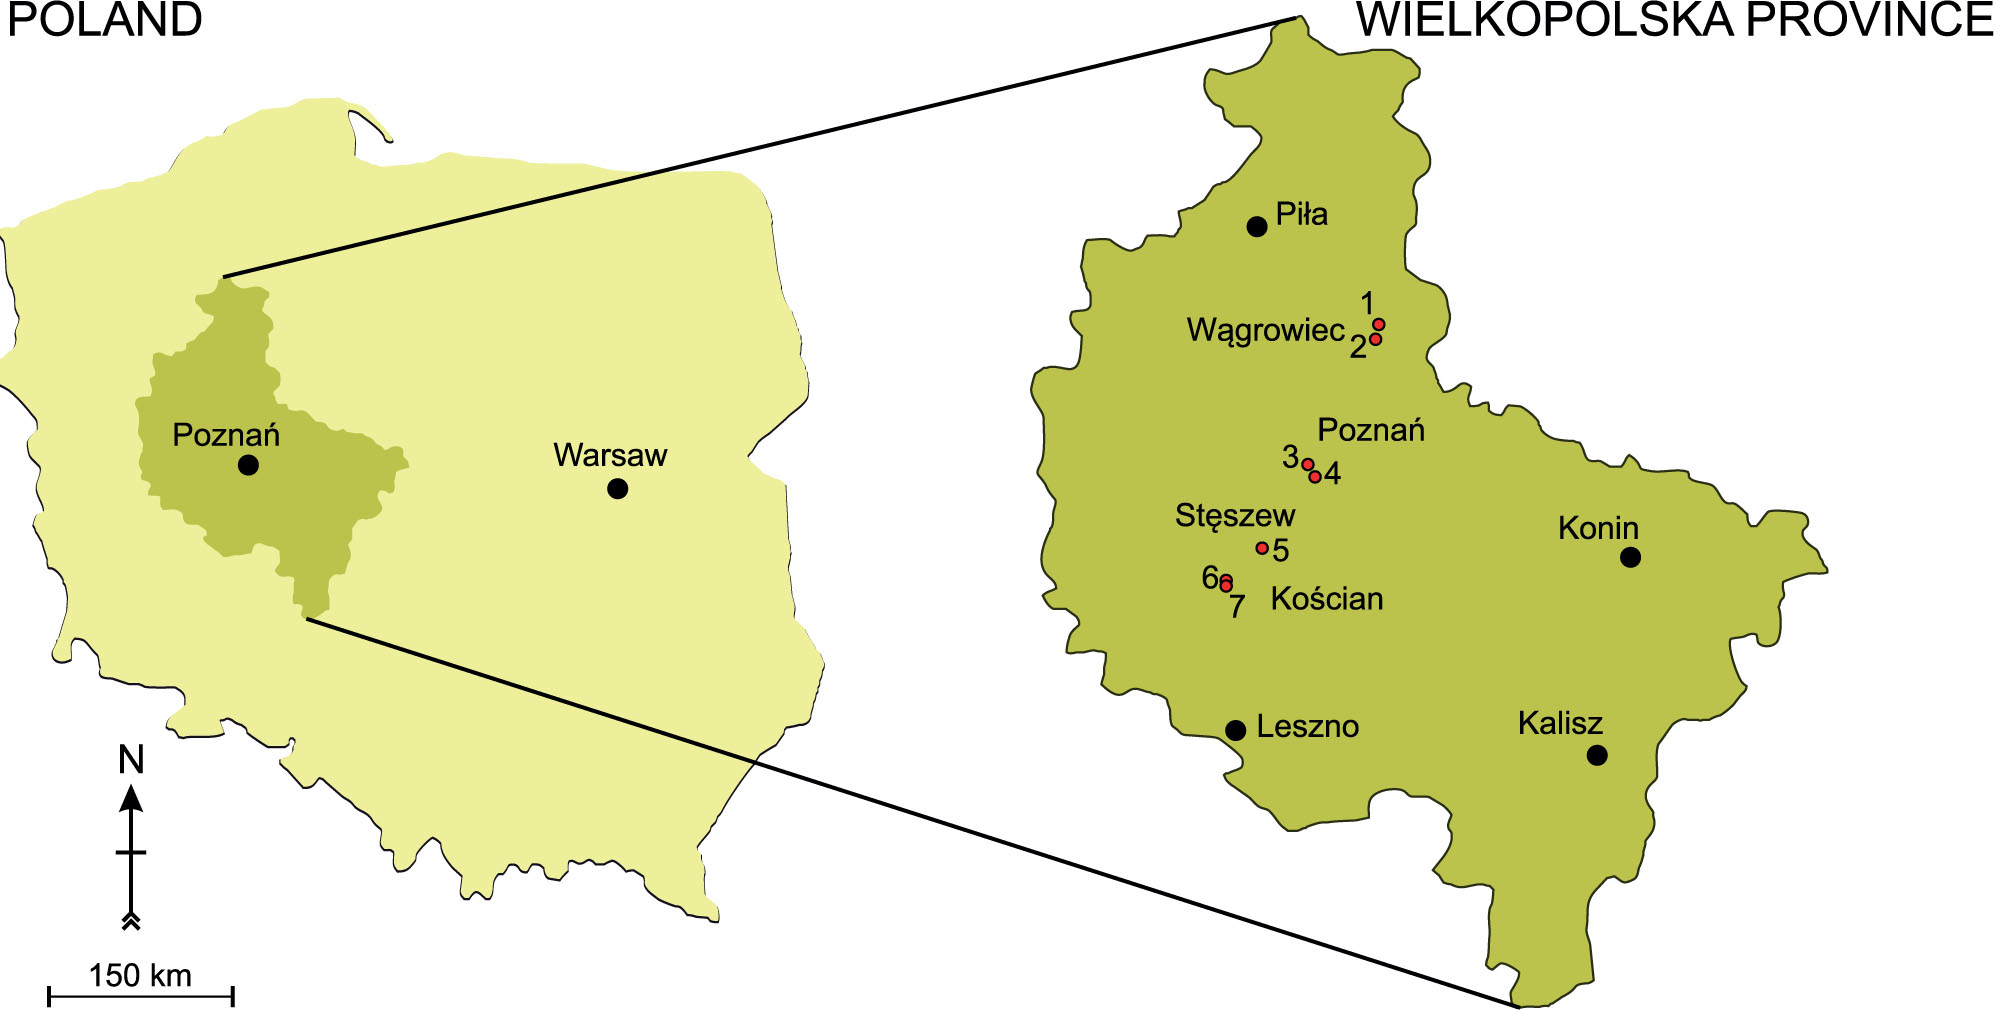
Figure 1
Location of the study sites: 1 – Lake Oporzyńskie, 2 – Nielba river, 3 – Pond in Poznań, 4 – Malta Reservoir, 5 – Samica Stęszewska river, 6 – Pond in Konojad, 7 – Mogilnica river
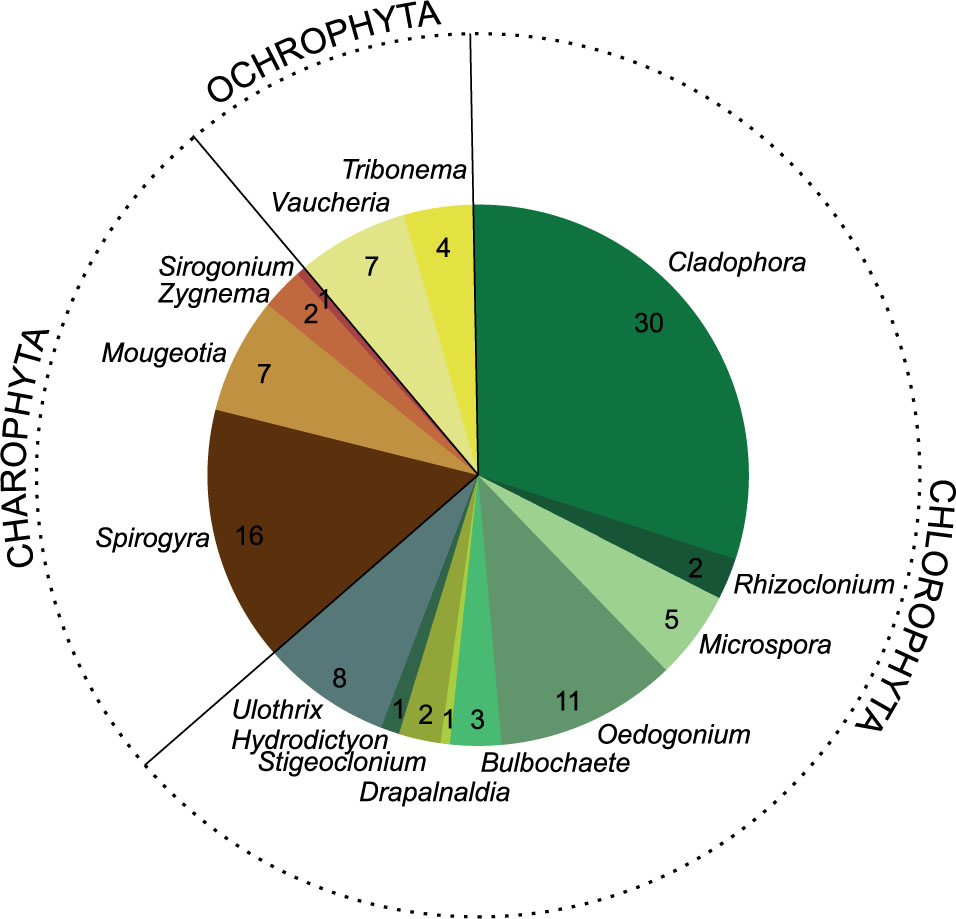
Figure 2
Floristic diversity of filamentous algae in freshwater ecosystems in Poland (numbers indicate the percentage contribution)
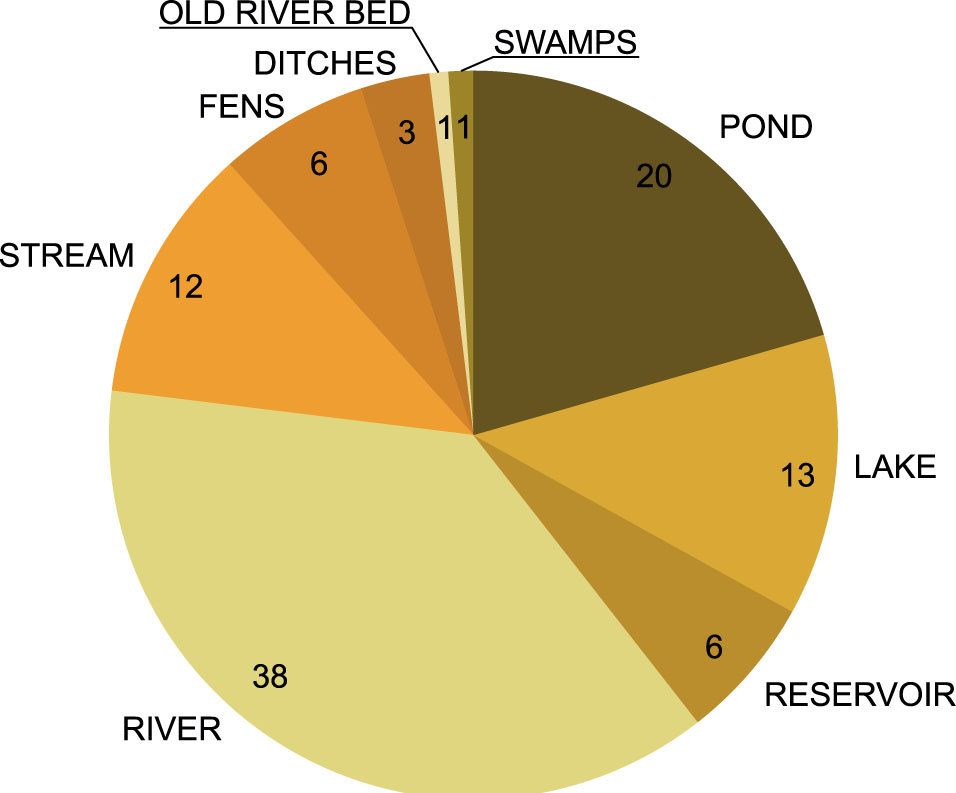
Figure 3
Types of ecosystems, in which filamentous algae were noted (numbers indicate the percentage contribution)
Table 1
Characteristics of various filamentous algae patches at the study sites
| dominant taxon | length and width of cells in µm (min-max) | shape of chloroplast | diameter of pyrenoids (µm) | accompanying filamentous algae | forms | color | sites |
|---|---|---|---|---|---|---|---|
| Cladophora glomerata | 223-634 47-131 | reticulate | 3-12 | Rhizoclonium sp. Vaucheria sp. | attached to the bottom and stones | dark green | Nielba river |
| Cladophora glomerata | 84-388 27-82 | reticulate | 4-10 | absent | long filaments, attached to the bottom | dark green | Samica Stęszewska river |
| Cladophora glomerata | 116-756 28-133 | reticulate | 3-6 | Rhizoclonium sp. Stigeoclonium nanum Oedogonium spp. Vaucheria sp. | attached, free-floating | dark green | Mogilnica river |
| Cladophora glomerata | 132-225 26-50 | reticulate | 5-7 | Oedogonium sp. Tribonema vulgare | free-floating, dense mat | bright green | Lake Oporzyńskie |
| Cladophora rivularis | 97-301 36-130 | parietal | 4-9 | Cladophora sp. Oedogonium capillare Ulothrix variabilis Tribonema aequale Tribonema vulgare Spirogyra spp., Mougeotia sp. Microspora sp. | cotton-wool-like thick mat | bright green | Pond in Konojad (agriculture) |
| Cladophora fracta | 50-135 17-25 | parietal | 3-7 | Cladophora glomerata Spirogyra spp. Mougeotia sp. | dense mat in littoral zone (4 m from the shore), soft to the touch | yellow green | Malta Reservoir |
| Cladophora fracta | 48-146 21-30 | parietal | 3-6 | Spirogyra spp. Mougeotia spp. Zygnema spp. Sirogonium sp. Cladophora sp. | mat mainly slippery to the touch | yellow green | Pond in Poznań (artificial) |
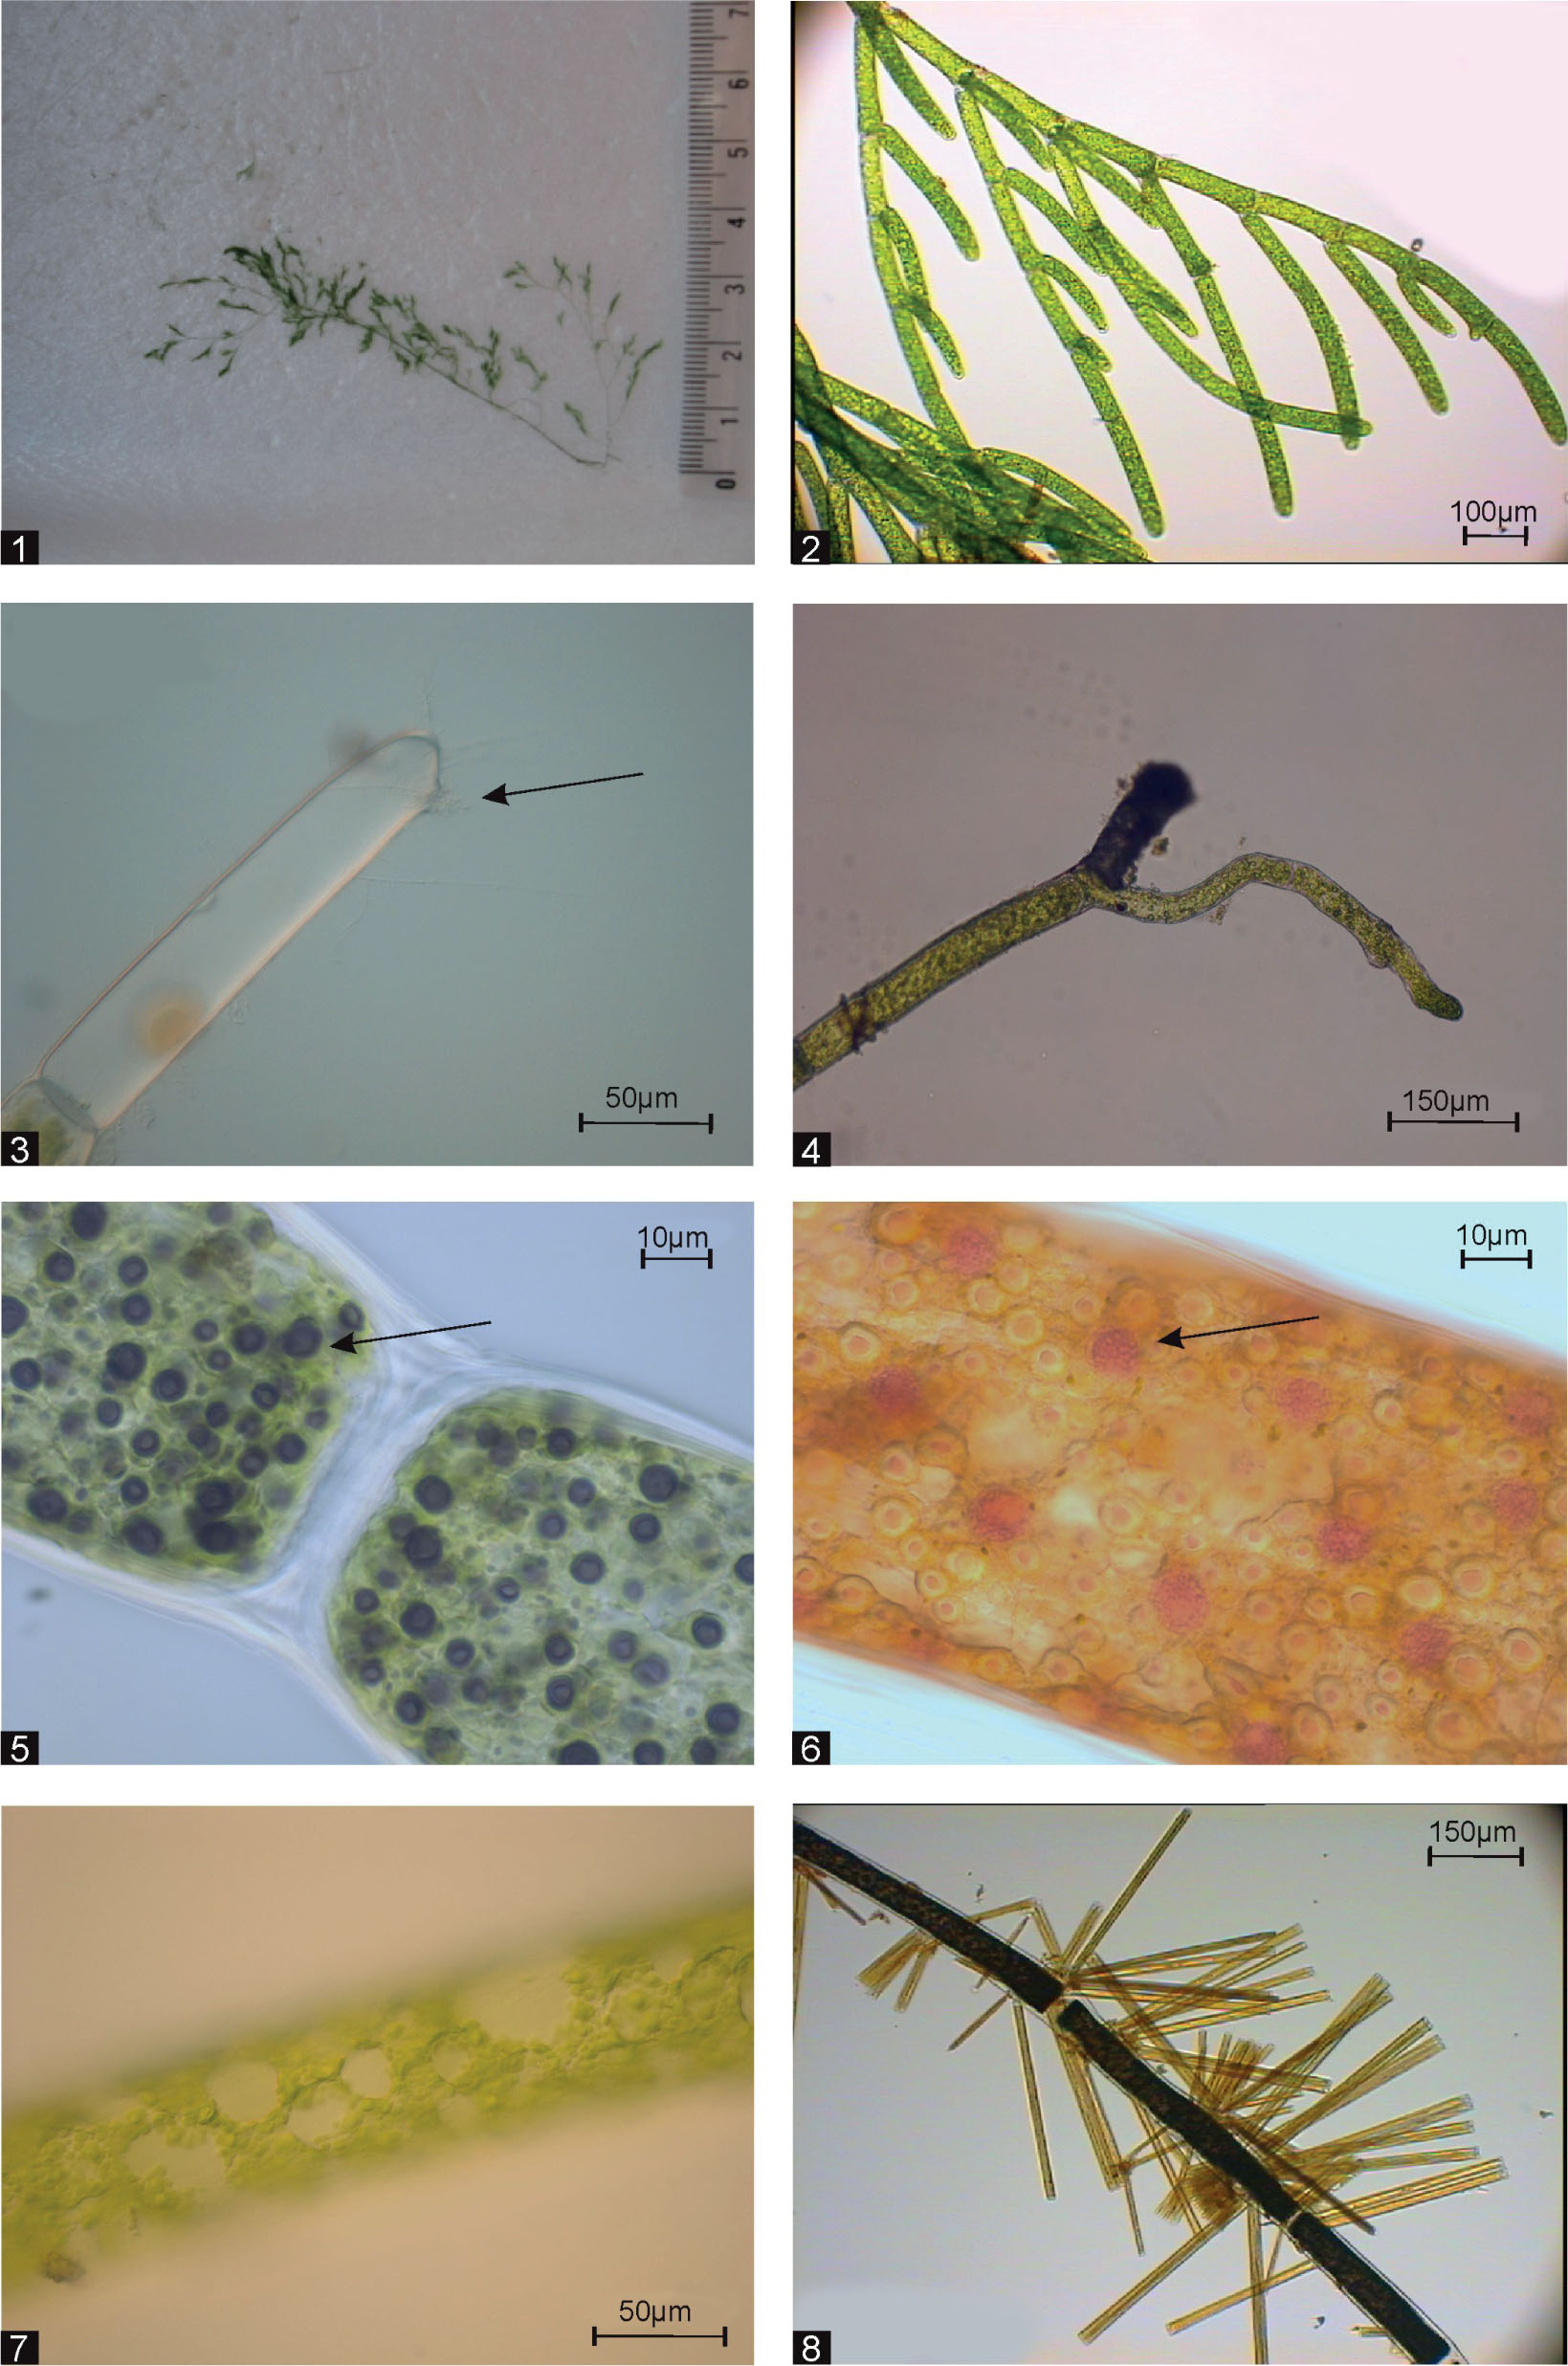
Figure 4
Photos of Cladophora glomerata: 1 – the overall view of young thalli; 2 – the number of thalli branched in the apical part; 3 – apical cell with a hole; 4 – basal cell; 5 – stained pyrenoids; 6 – stained nuclei; 7 – reticulate chloroplast; 8 – diatoms on the surface of cell wall
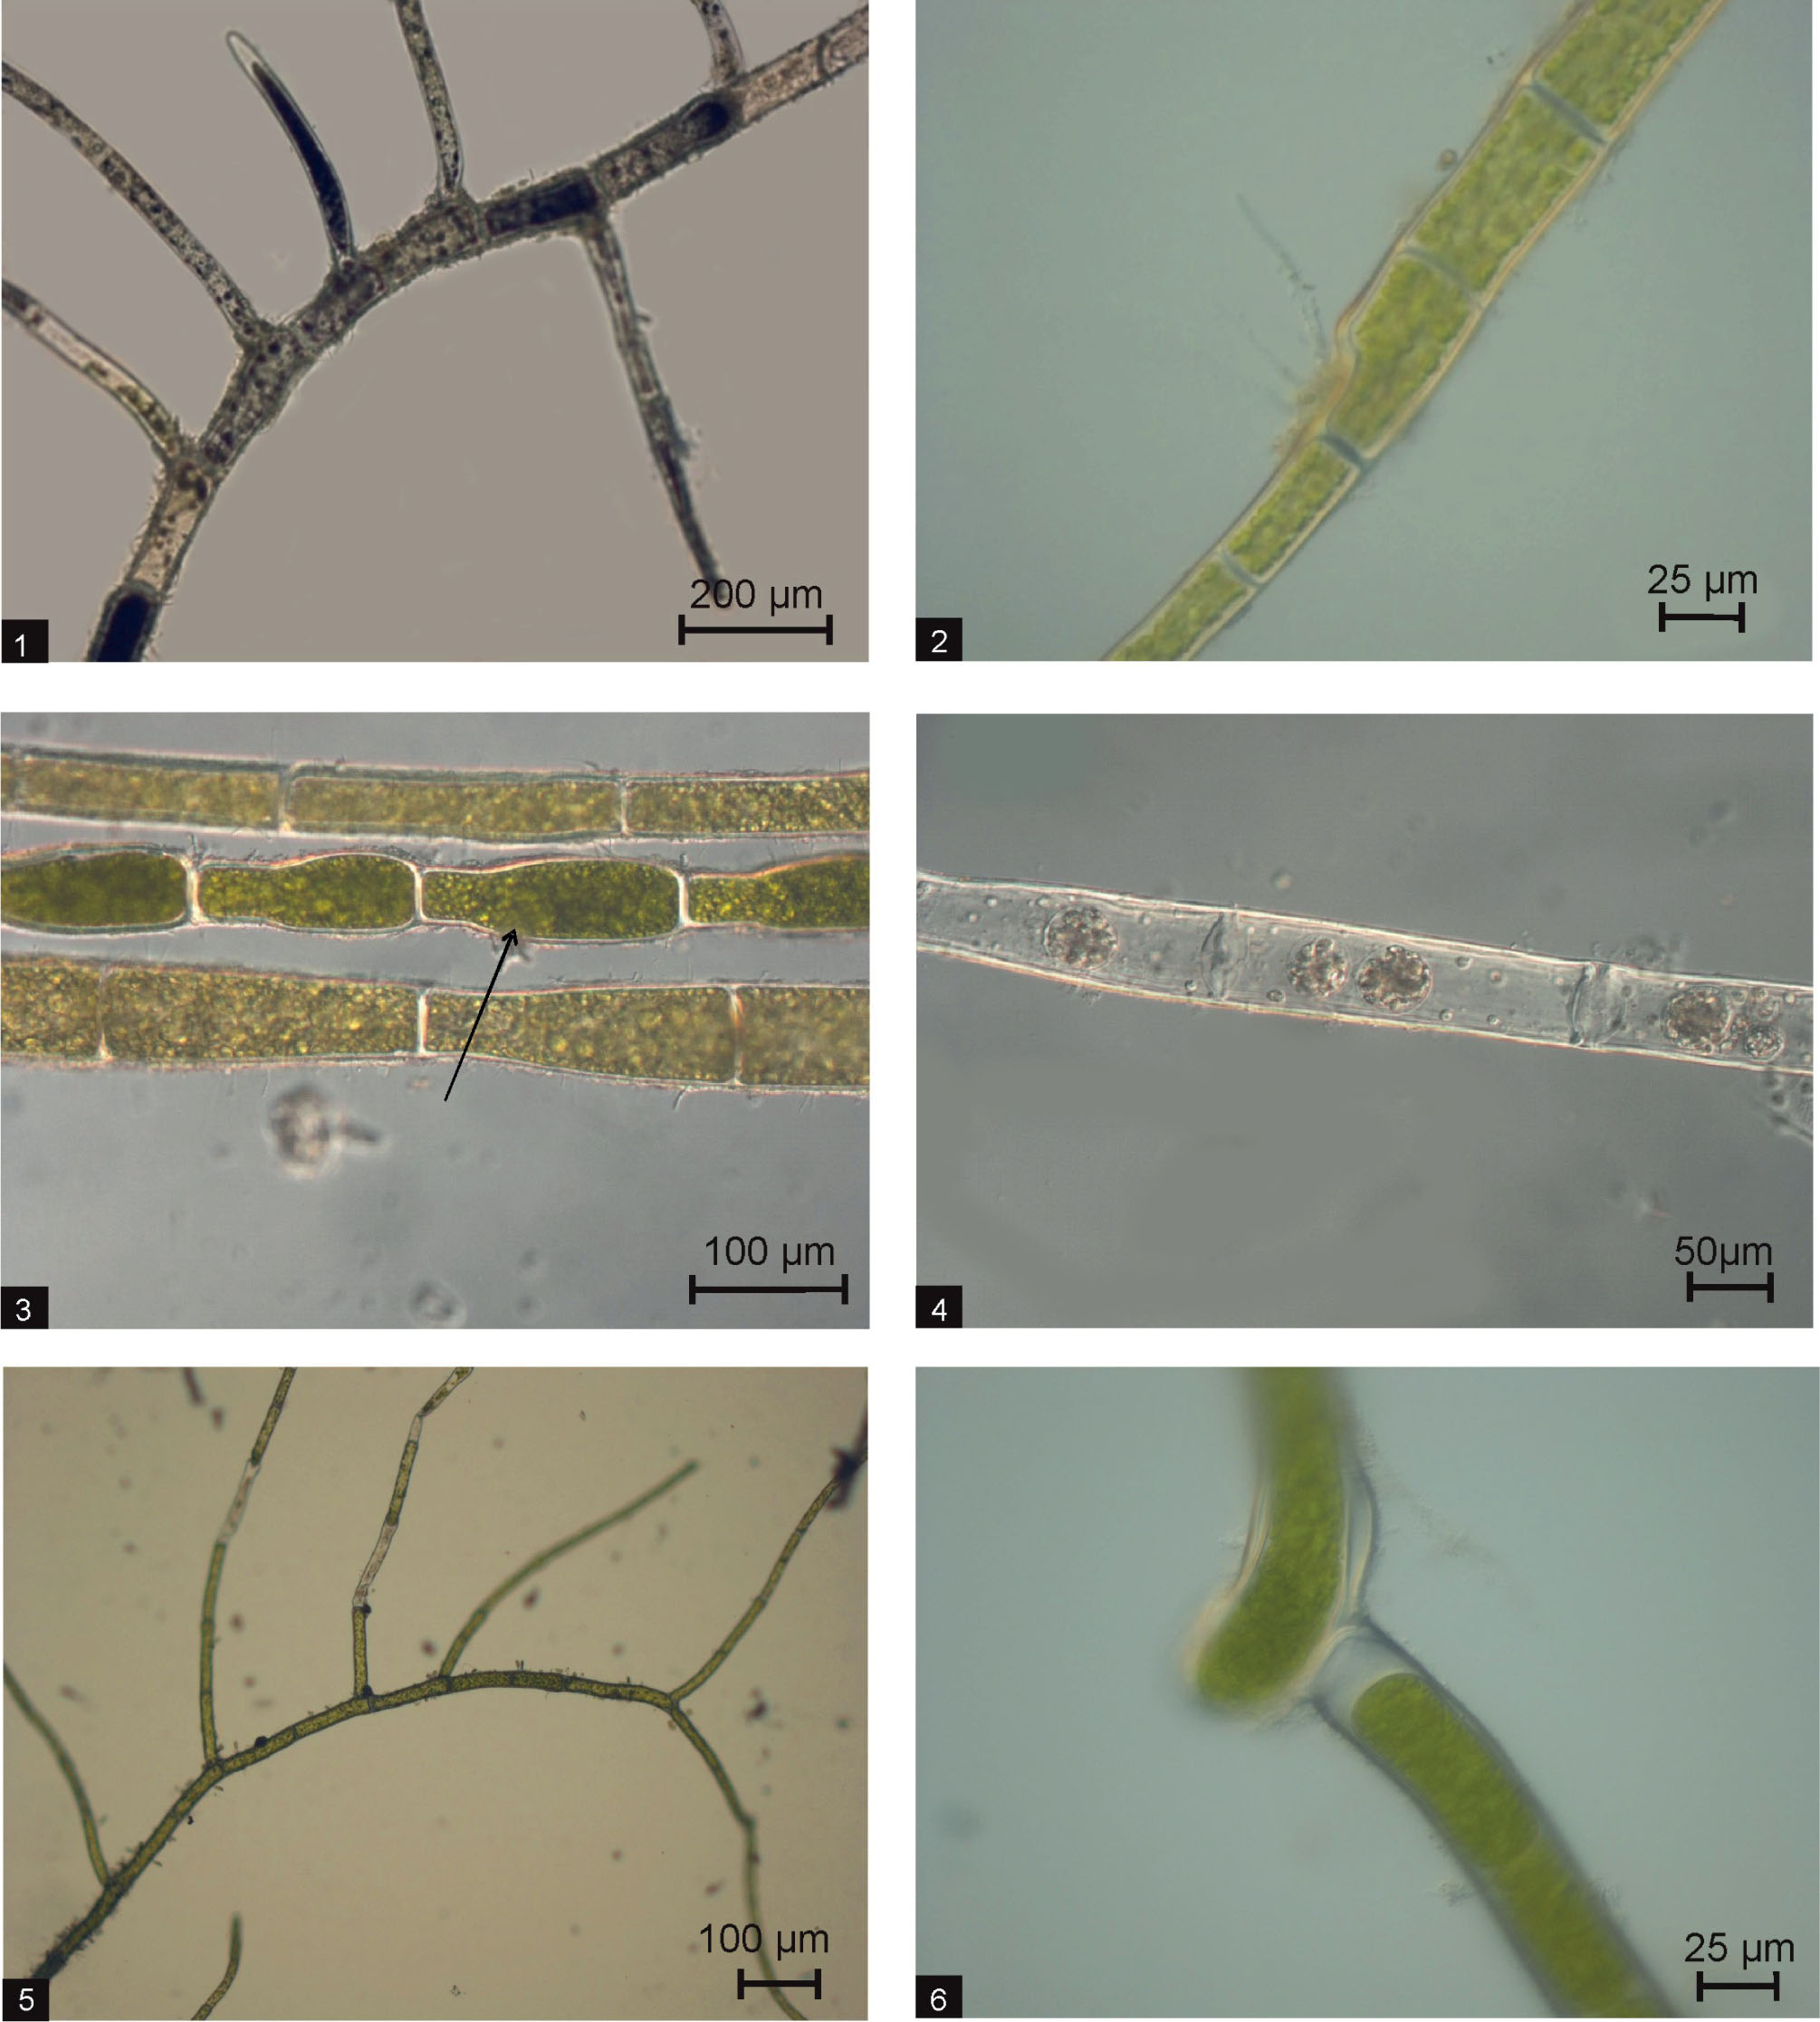
Figure 5
Photos of Cladophora rivularis (1-4): 1 – branches diverge at right angles; 2 – morphometric variability; 3 – akinete; 4 – zoospores; and Cladophora fracta (5-6): 5 – slender filaments with branches at an obtuse angle; 6 – fragmentation of the thallus
Table 2
Mean values of physicochemical factors of water for the surveyed sites (L.O. – Lake Oporzyńskie, M.R. – Malta Reservoir, P.P. – pond in Poznań, P.K. – pond in Konojad, N.R. – Nielba river, S.S.R. – Samica Stęszewska river, M.R. – Mogilnica river
| Parameters | Unit | L.O. n=46 | M.Res. n=12 | P.P. n=17 | P.K. n=59 | N.R. n=10 | S.S.R. n=10 | M.R. n=33 |
|---|---|---|---|---|---|---|---|---|
| Temp. | °C | 19.3 | 23.7 | 22.1 | 21.4 | 21.0 | 18.9 | 20.4 |
| pH | 8.4 | 8.6 | 8.3 | 8.8 | 7.9 | 7.5 | 7.9 | |
| Depth | cm | 120 | 41.5 | 35 | 51 | 94 | 44 | 43 |
| Color | PtCo | 74 | 21 | 12.8 | 18.8 | 22 | 28 | 38 |
| Turb. | FAU | 3.5 | 4.2 | 3.3 | 5.2 | 4.5 | 0.3 | 5.4 |
| EC | µS cm-1 | 551 | 658 | 387 | 946 | 779 | 532 | 838 |
| TDS | mg l-1 | 259 | 442 | 198 | 532 | 538 | 516 | 491 |
| N-NO3 | 0.50 | 0.20 | 0.36 | 0.26 | 0.82 | 0.16 | 0.85 | |
| NH4 | 0.57 | 0.25 | 0.59 | 0.81 | 0.82 | 0.28 | 0.73 | |
| SO4 2- 4 | 69 | 81 | 46 | 109 | 140 | 67 | 63 | |
| NaCl | 114 | 121 | 59 | 309 | 101 | 86 | 116 | |
| Cl- | 63 | 73 | 36 | 105 | 61 | 52 | 70 | |
| PO43- 4 | 0.23 | 0.22 | 0.27 | 0.27 | 0.23 | 0.24 | 1.13 | |
| DO | % | 111 | 93 | 99 | 100 | 87 | 91 | 73 |
| Chl a | µg l-1 | 25.2 | 7.2 | 4.95 | 1.86 | 3.2 | 6.4 | 8.25 |
Table 3
Results of the forward selection of environmental parameters (Monte Carlo permutation test in CCA, P<0.005 are statistically significant)
| Parameter | λ | P | F |
|---|---|---|---|
| Cl- | 0.67 | 0.001 | 18.41 |
| P-PO4 | 0.36 | 0.001 | 10.41 |
| TDS | 0.25 | 0.001 | 7.71 |
| N-NO3 | 0.17 | 0.001 | 5.28 |
| Chl a | 0.15 | 0.001 | 5.09 |
| Depth | 0.15 | 0.001 | 4.98 |
Table 4
Pearson’s correlation coefficients between CCA ordination scores (the first three axes) for filamentous algae and environmental factors (n = 187; p<0.05 are statistically significant and given in bold)
| CCA AXIS 1 Eigenvalue: 0.79 | CCA AXIS 2 Eigenvalue: 0.66 | CCA AXIS 3 Eigenvalue: 0.23 | |
|---|---|---|---|
| AXIS 1 | - | 0.03 | -0.51 |
| AXIS 2 | 0.03 | - | 0.04 |
| AXIS 3 | -0.51 | 0.04 | - |
| Depth | -0.10 | -0.49 | 0.00 |
| Chl a | 0.61 | 0.20 | -0.44 |
| Temp. | -0.01 | 0.21 | 0.18 |
| pH | -0.50 | -0.19 | 0.57 |
| DO | -0.30 | -0.27 | 0.38 |
| EC | -0.11 | -0.78 | -0.01 |
| TDS | 0.20 | -0.74 | -0.20 |
| N-NO3 | 0.33 | 0.14 | -0.33 |
| P-PO4 | 0.54 | 0.04 | -0.66 |
| SO4 2- 4 | -0.36 | -0.85 | 0.19 |
| Color | 0.40 | -0.14 | -0.54 |
| Turb. | 0.39 | -0.13 | -0.25 |
| Cl- | -0.25 | -0.86 | 0.05 |
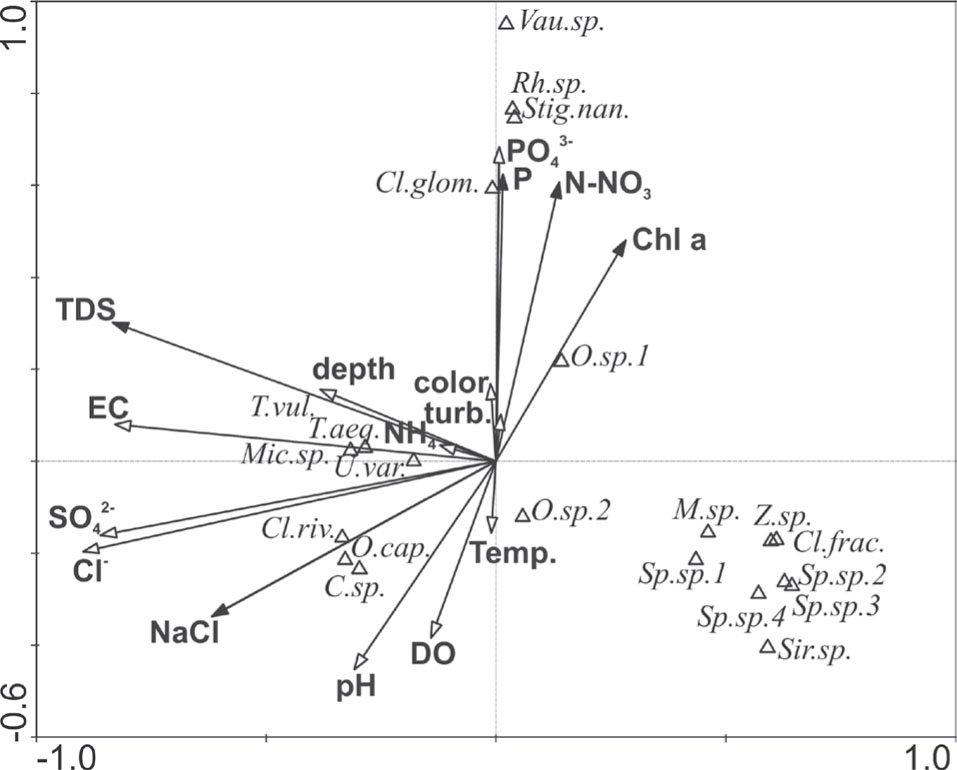
Figure 6
Canonical correspondence analysis (CCA) diagram showing the correlation between species distribution and environmental variables. All axes were found to be highly significant (p<0.005; Monte Carlo Simulation). Vau. sp. – Vaucheria sp., Rh. sp. – Rhizoclonium sp., Stig. nan. – Stigeoclonium nanum, Cl. glom. – Cladophora glomerata, O. sp.1 – Oedogonium sp. 1, Cl. glob. – Cladophora globulina, O. sp. 2 – Oedogonium sp. 2, M. sp. – Mougeotia sp., Z. sp. – Zygnema sp., Cl. frac. – Cladophora fracta, Sp.sp.1. Spirogyra sp. 1, Sp.sp.2 – Spirogyra sp. 2, Sp.sp.3. – Spirogyra sp. 3, Sp.sp.4. – Spirogyra sp. 4, Sir. sp. – Sirogonium sp., C. sp. – Cladophora sp., O.cap. – Oedogonium capillare, Cl.riv. – Cladophora rivularis, Mic. sp. – Microspora sp., U. var. – Ulothrix variabilis, T. vul. – Tribonema vulgare, T. aeg. – Tribonema aequale