
Figure 1
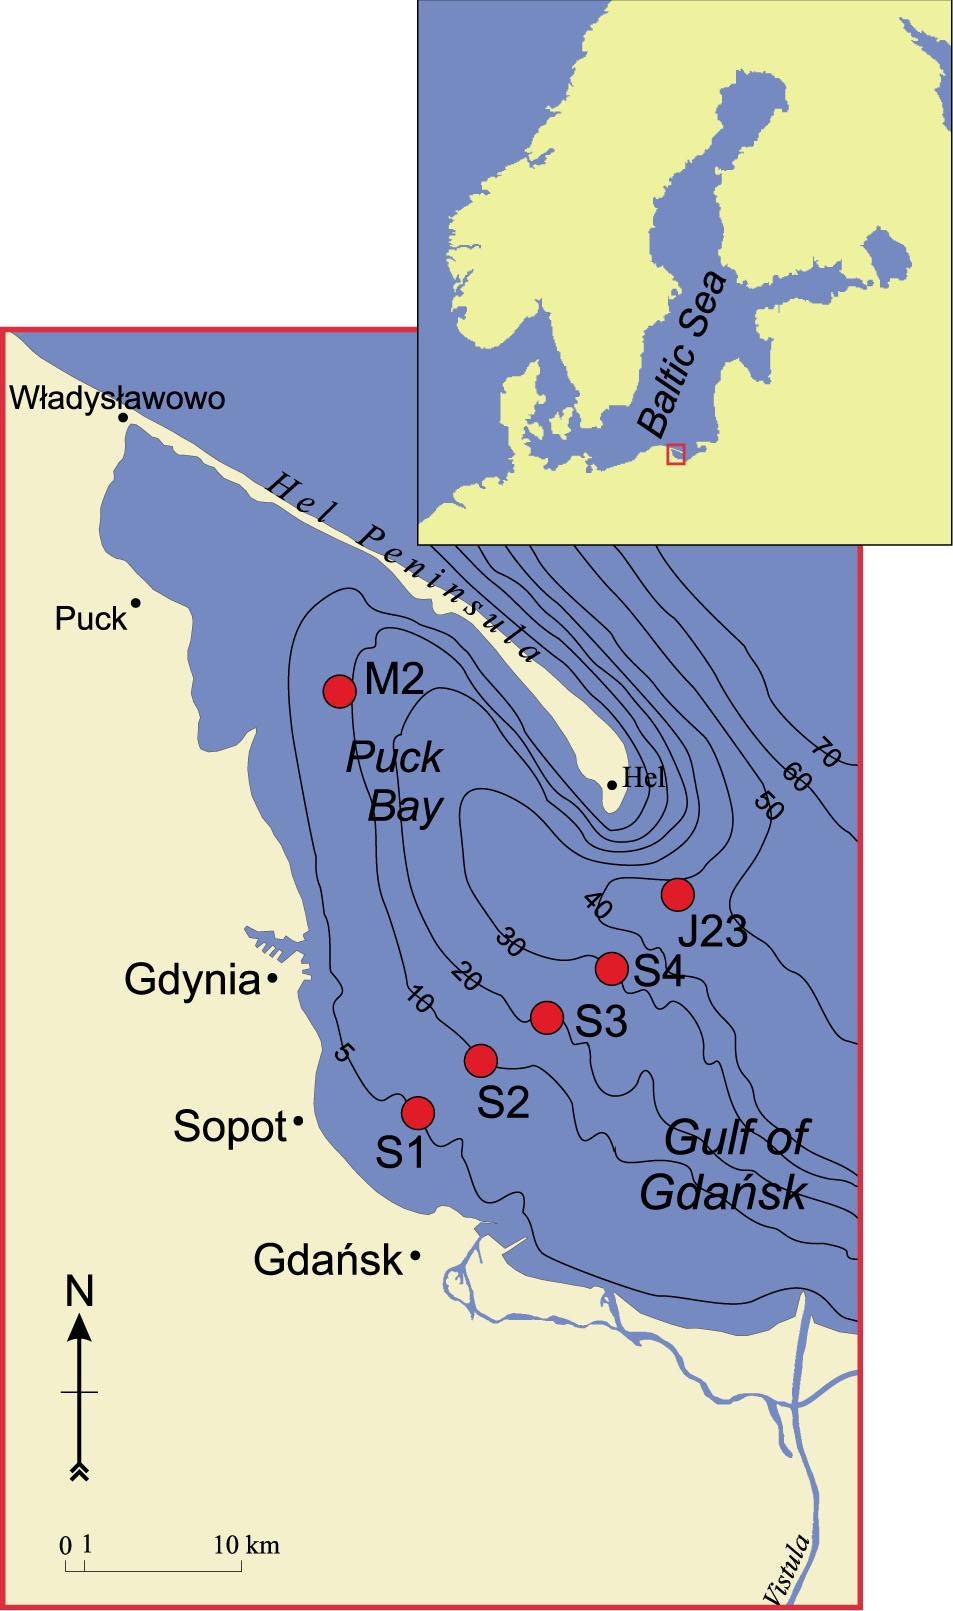
Figure 2

Figure 3
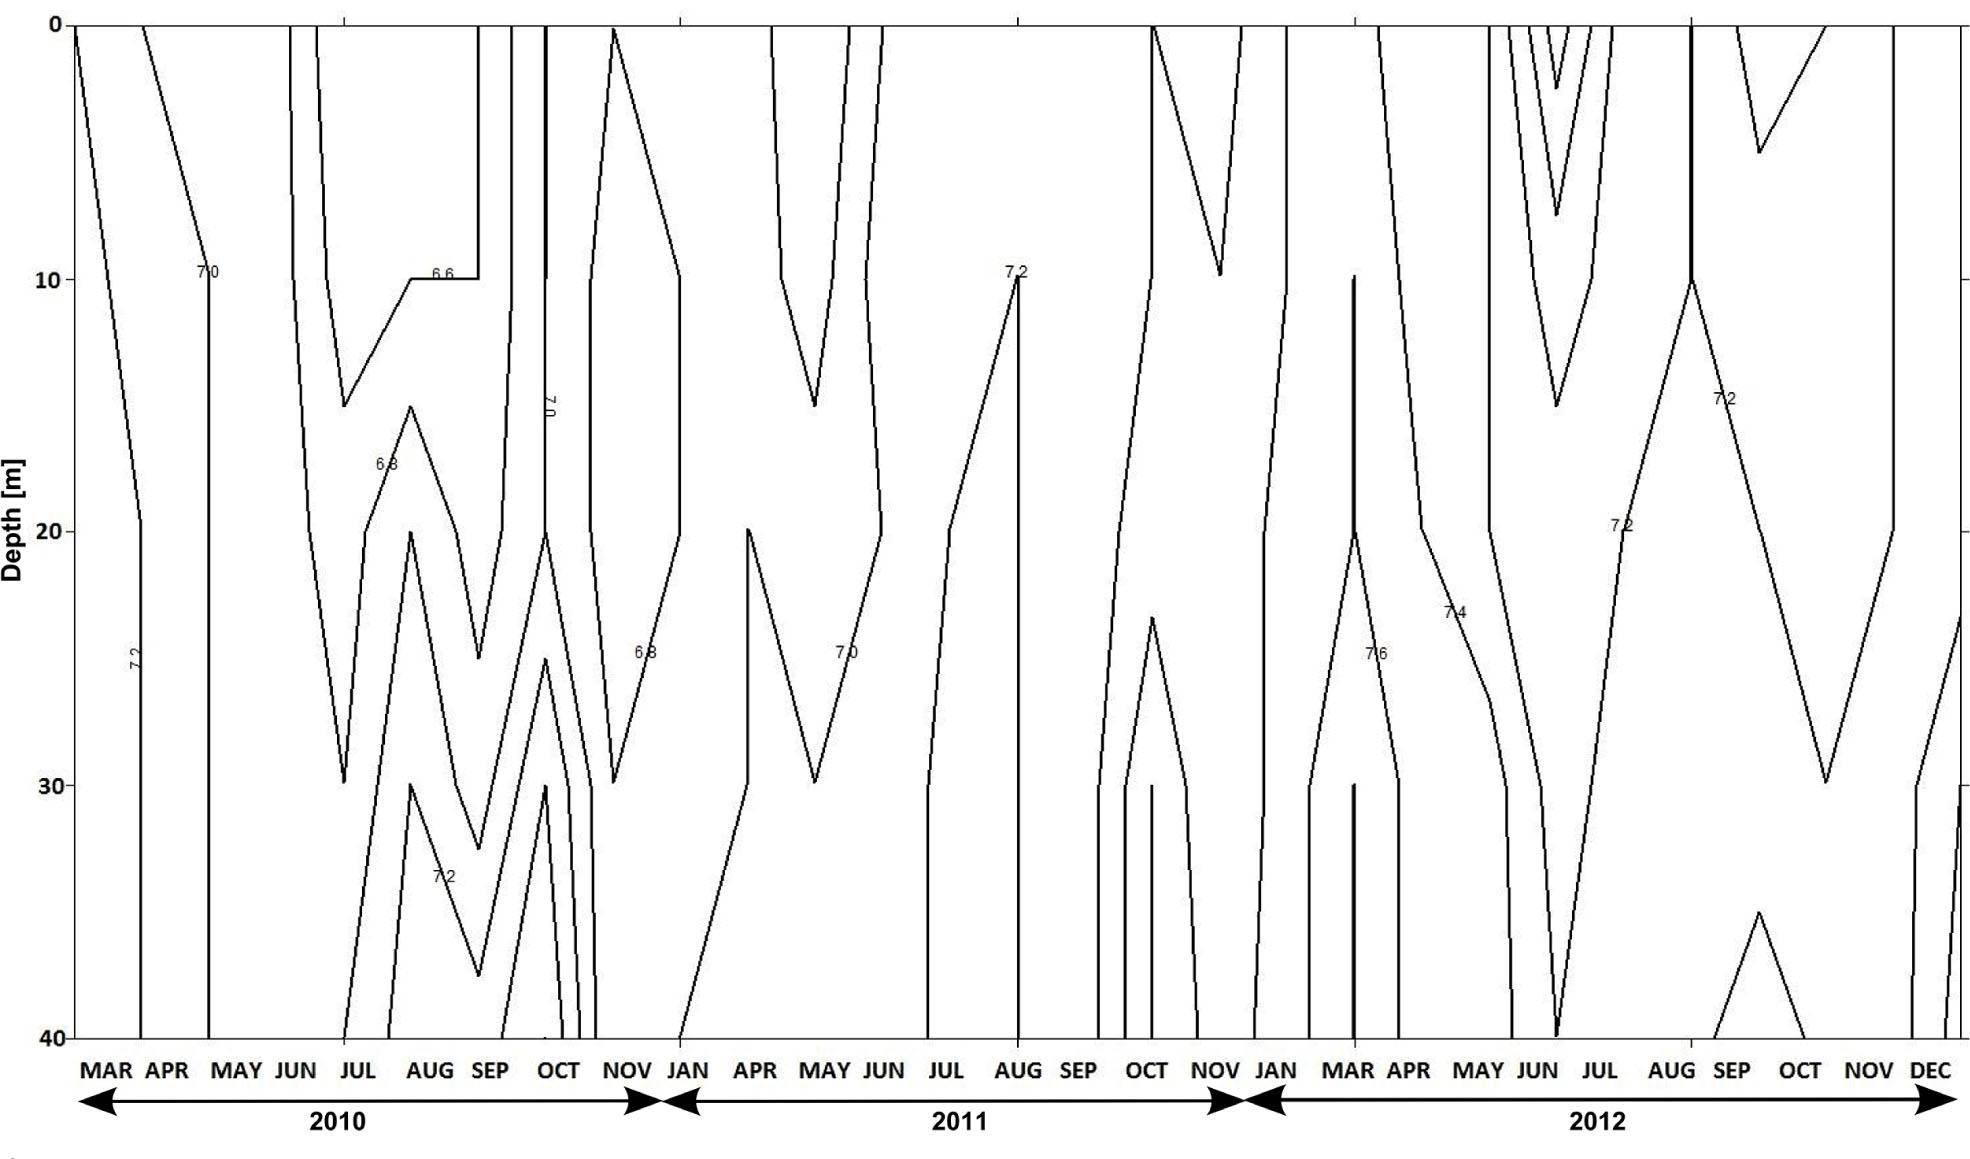
Figure 4
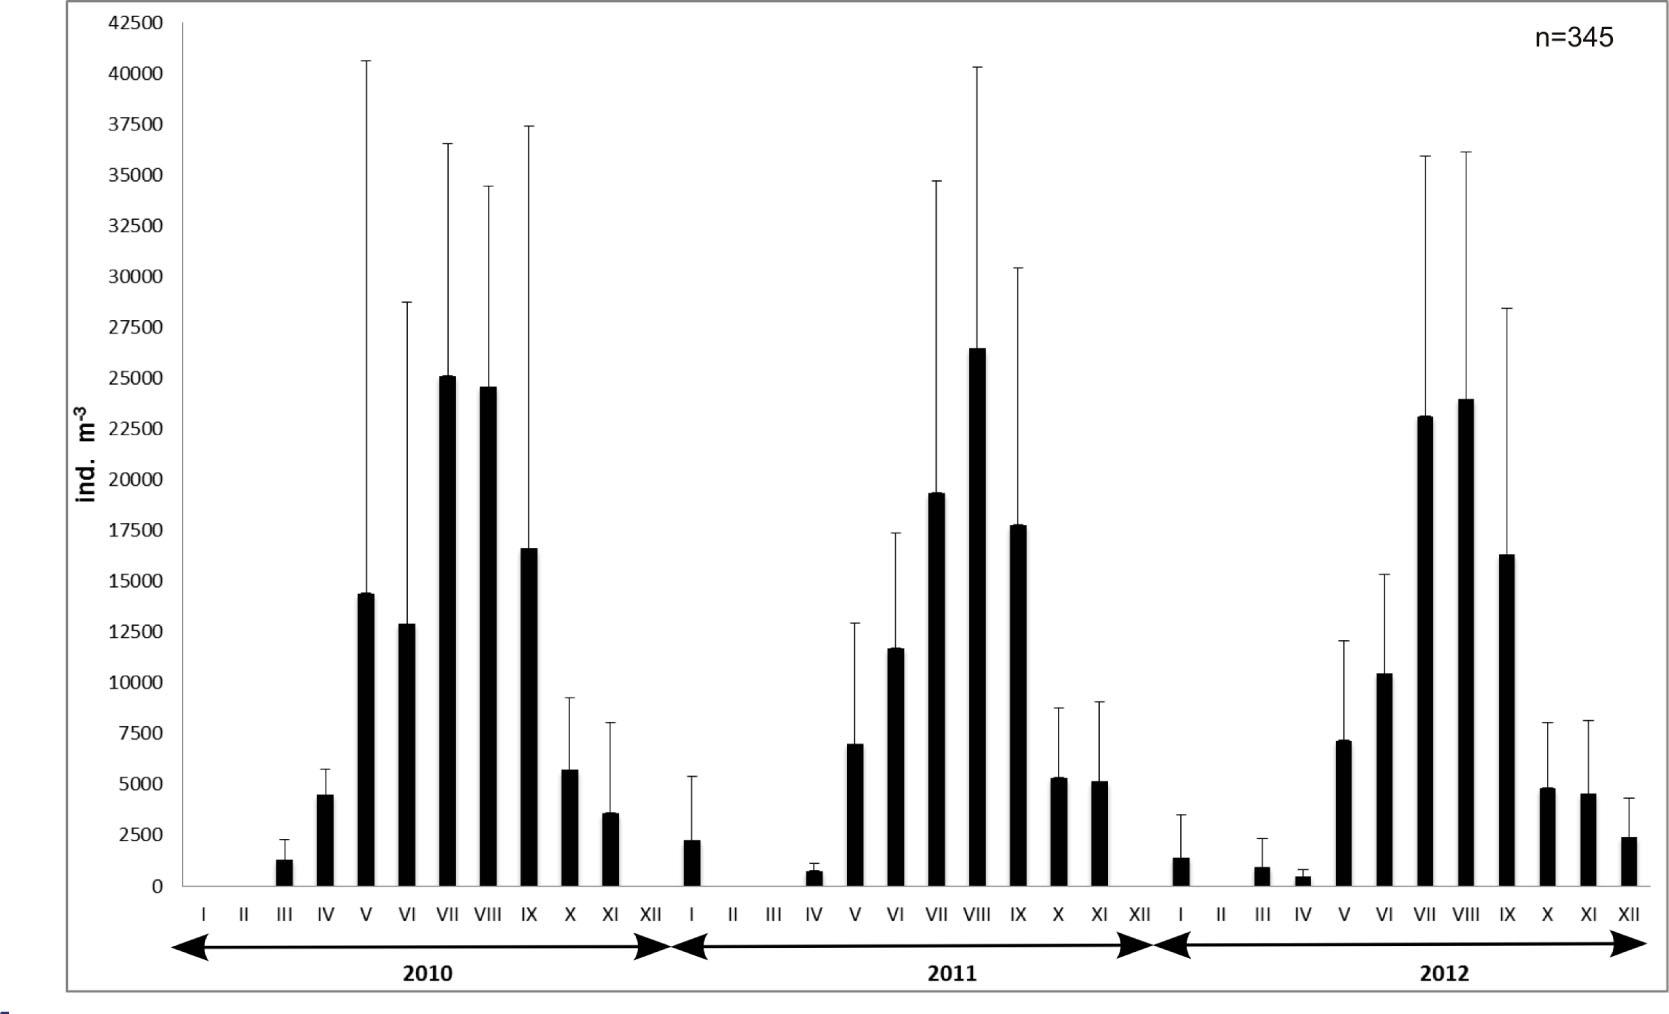
Figure 5

Figure 6

Figure 7

Figure 8
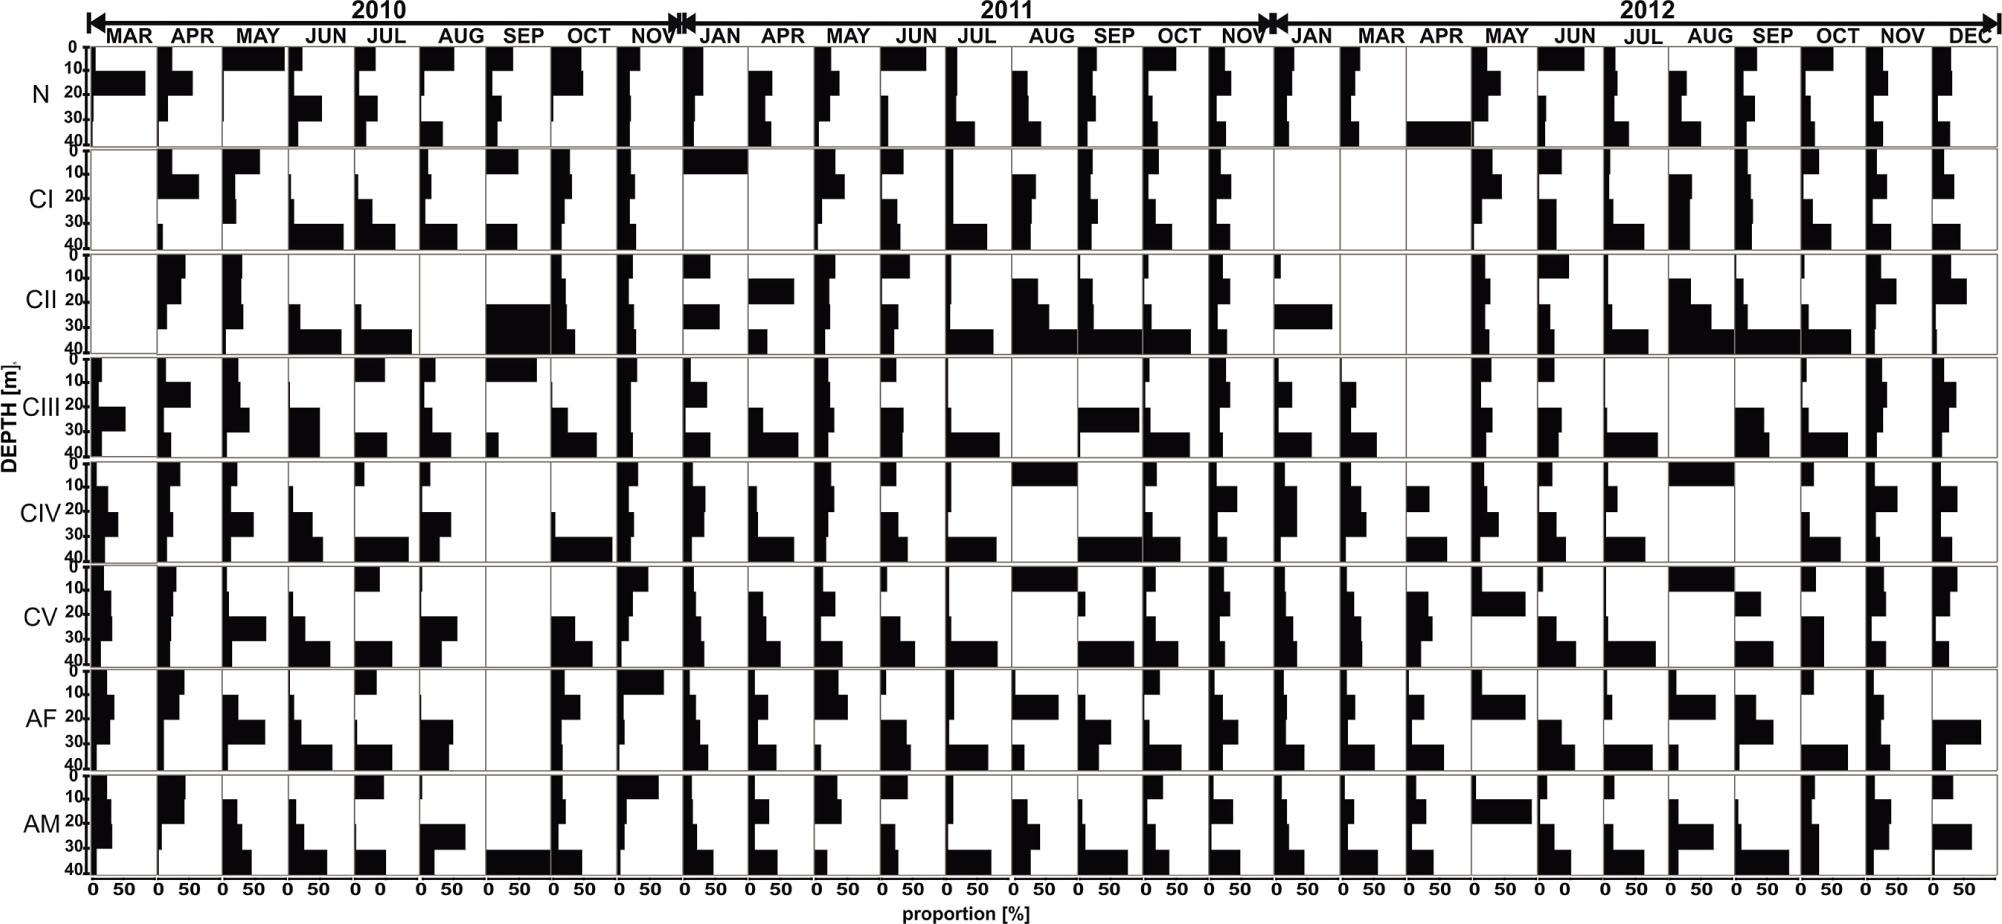
Figure 9
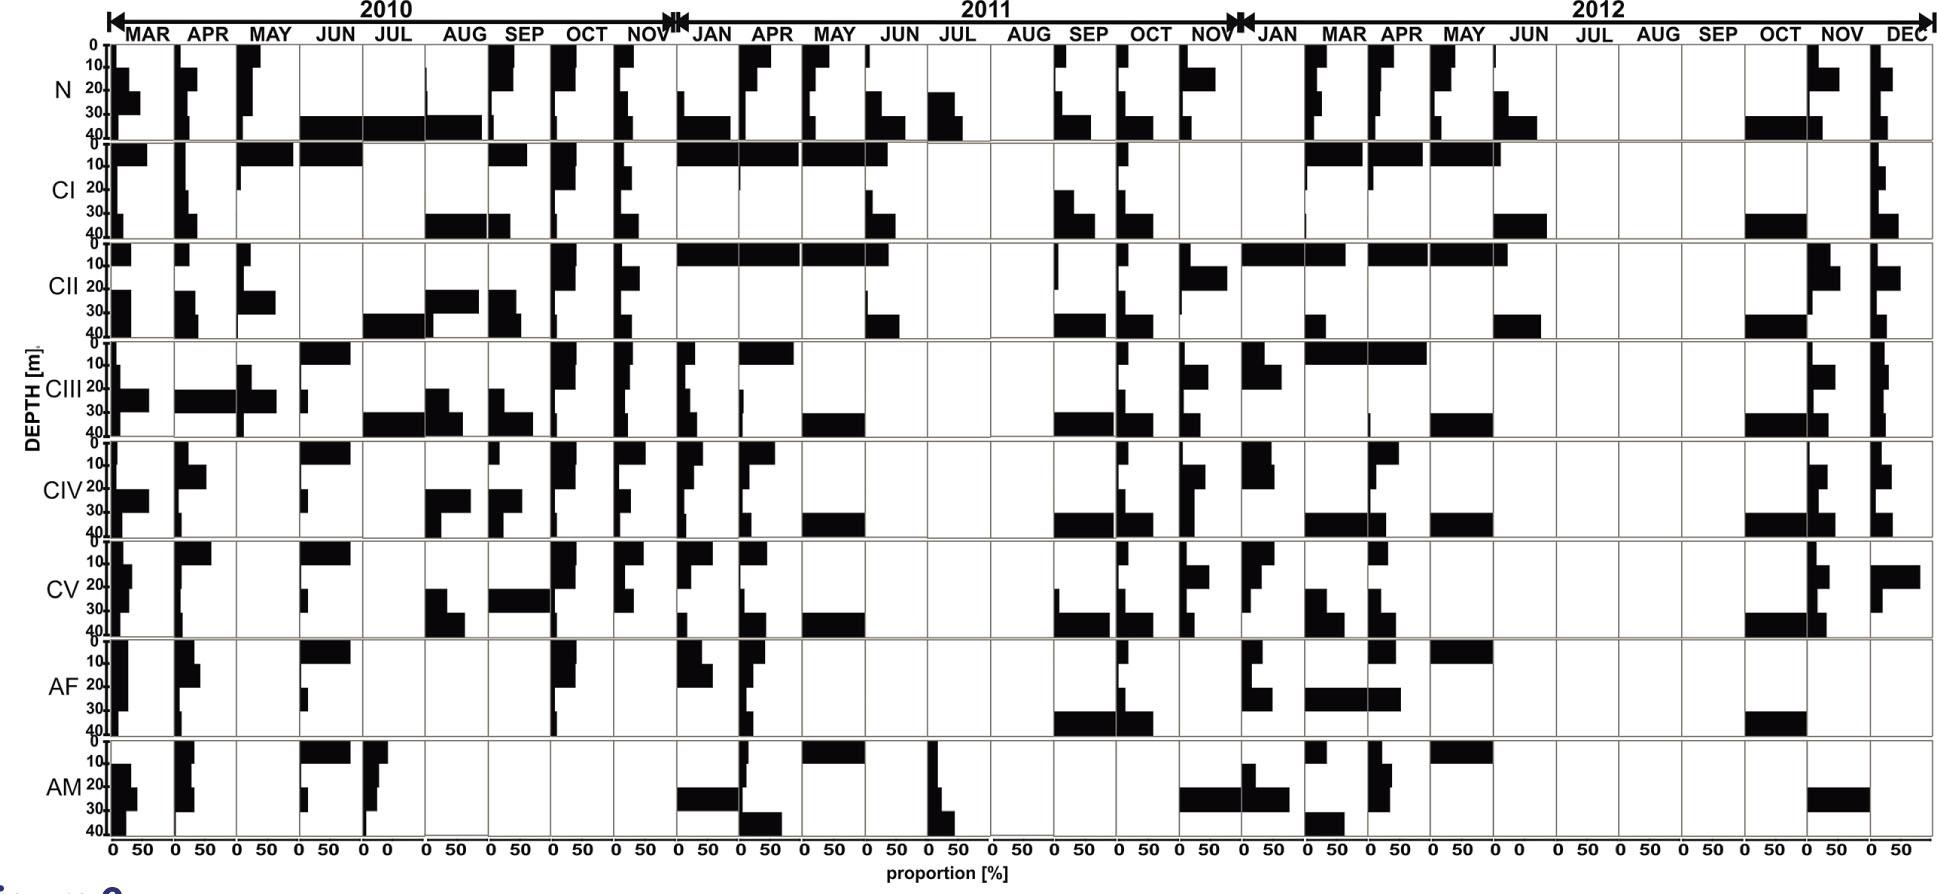
Figure 10

Figure 11

Values of the Pearson correlation coefficient for the temperature and abundance of the development stages of Acartia spp_, Temora longicornis and Pseudocalanus sp_ (*bold - p<0_05)
| N | CI | CII | CIII | CIV | CV | Female | Male | |
|---|---|---|---|---|---|---|---|---|
| Acartia spp. | 0.38* | 0.36* | 0.23* | 0.18* | 0.16* | 0.14 | 0.25* | 0.23* |
| Temora longicornis | 0.20* | 0.05 | -0.02 | -0.03 | -0.02 | 0.10 | 0.13 | 0.18* |
| Pseudocalanus sp. | -0.35 | -0.30 | -0.45* | -0.52* | -0.48* | -0.37 | -0.35 | -0.46* |
Values of the Pearson correlation coefficient for the temperature and production rates of the development stages of Acartia spp_, Temora longicornis and Pseudocalanus sp_ (*bold - p<0_05)
| N | CI | CII | CIII | CIV | CV | |
|---|---|---|---|---|---|---|
| Acartia spp. | -0.76* | 0.84* | 0.80* | 0.84* | 0.78* | 0.81* |
| Temora longicornis | -0.87* | 0.34 | 0.10 | 0.14 | 0.23 | 0.29 |
| Pseudocalanus sp. | -0.22 | 0.18 | 0.71 | 0.70 | 0.30 | -0.56 |