
Figure 1
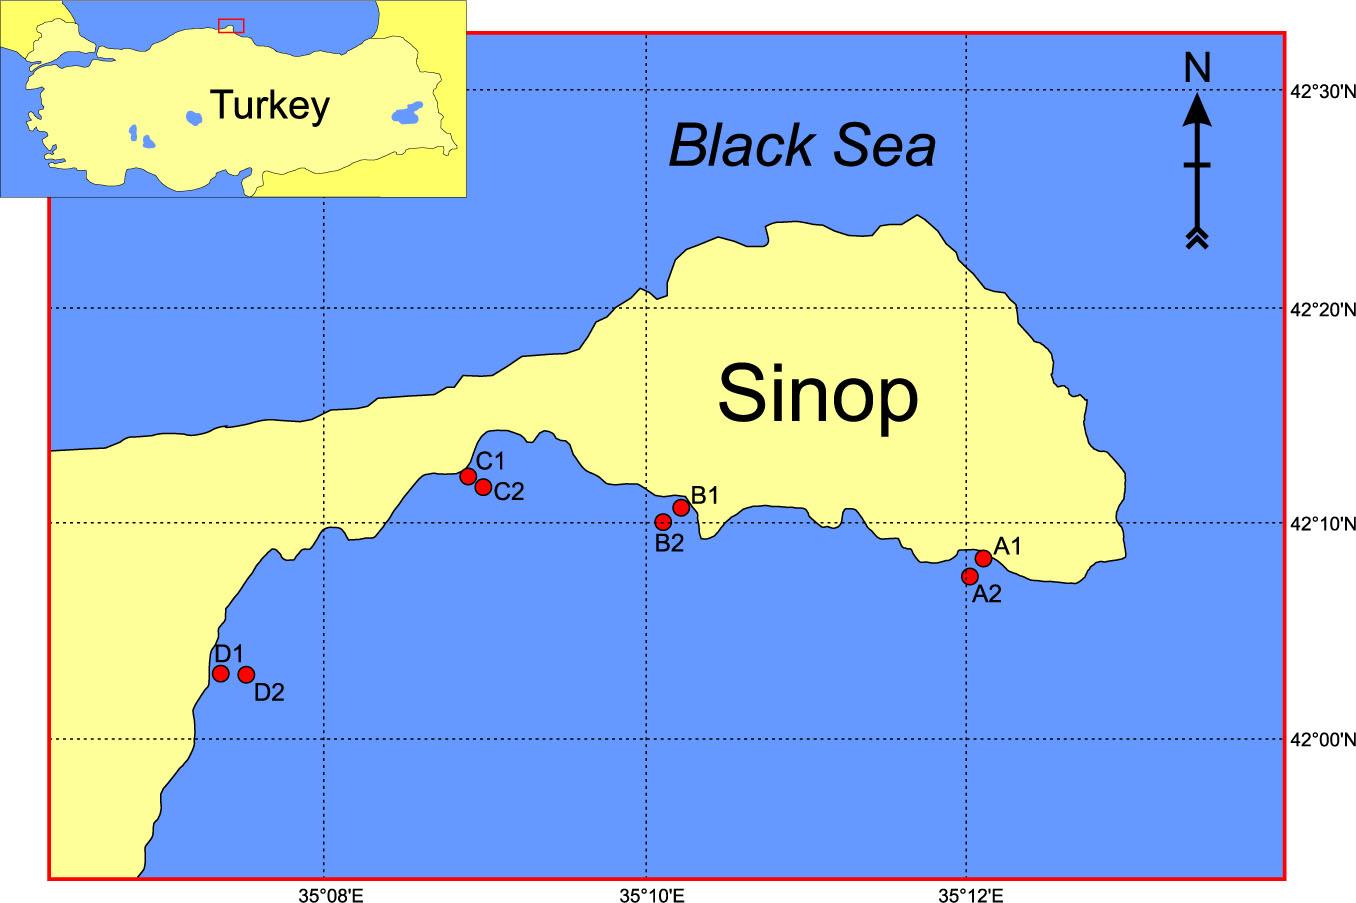
Figure 2
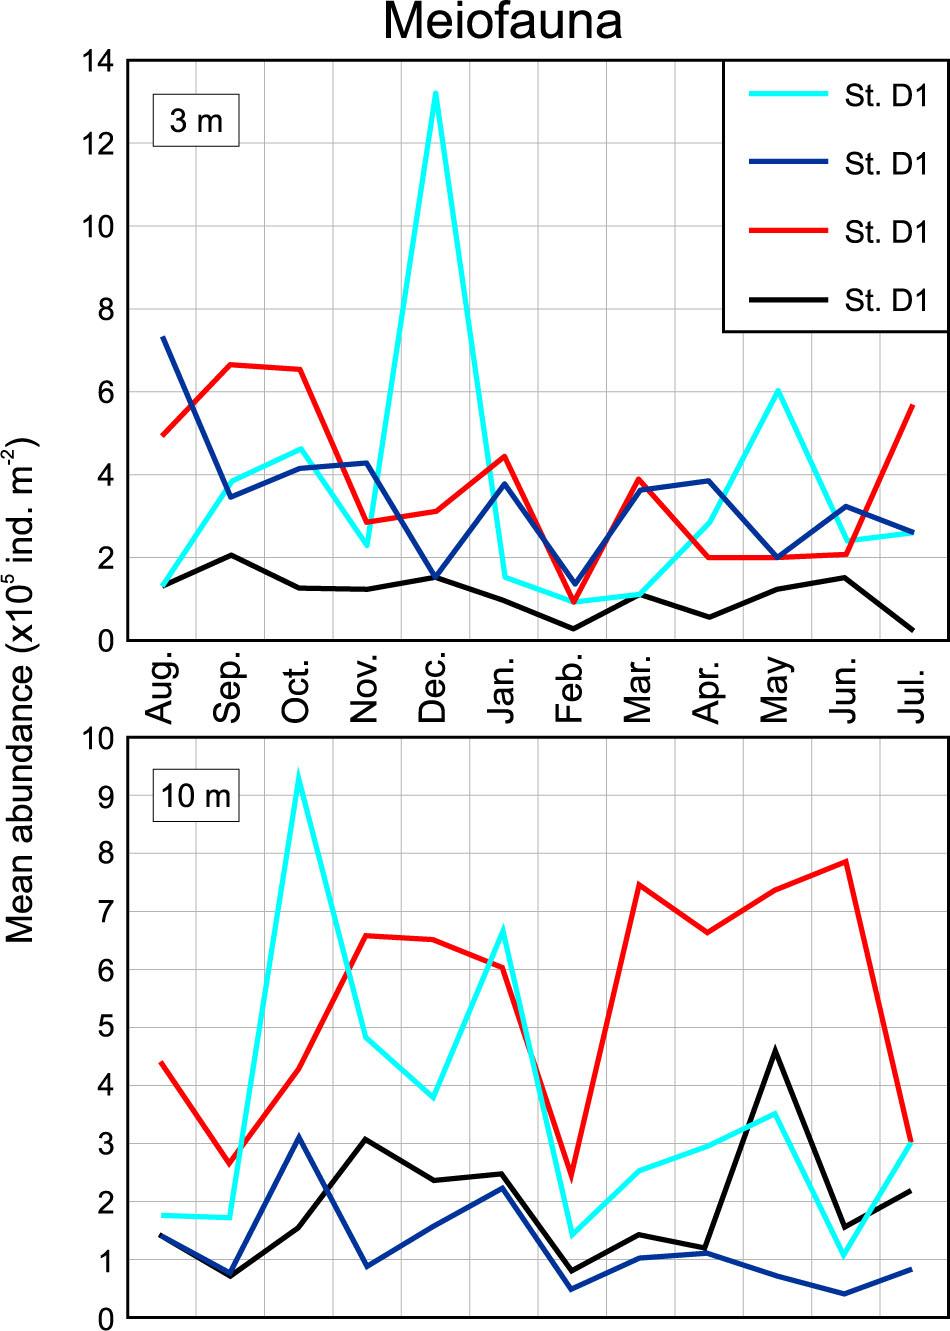
Figure 3
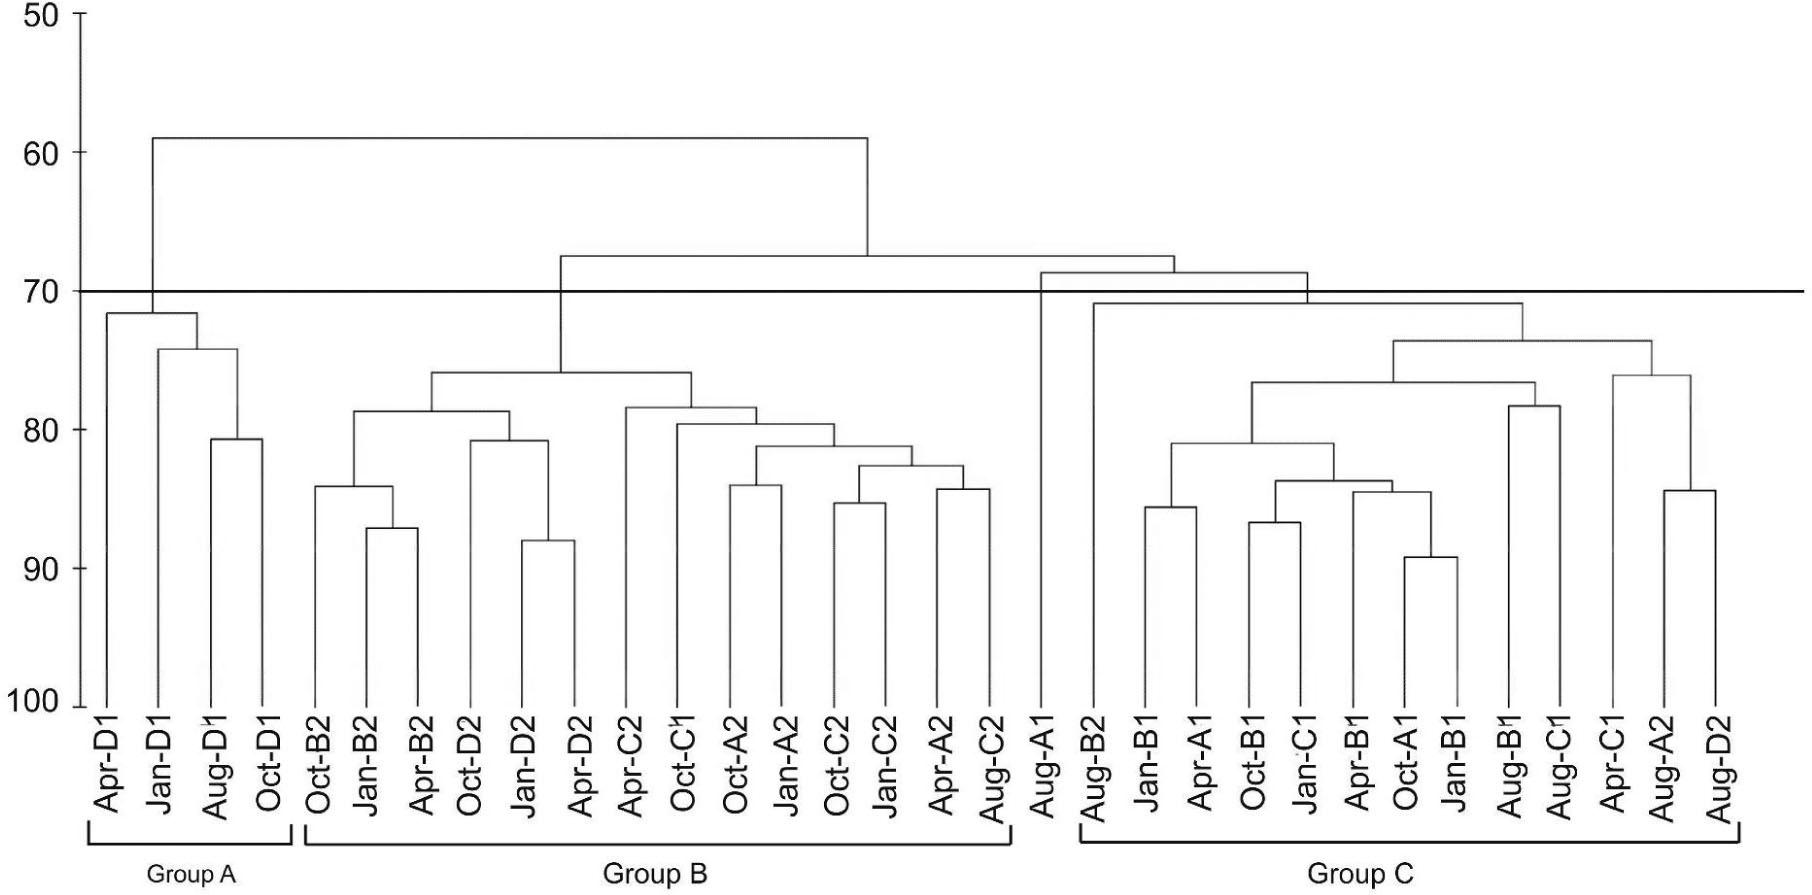
Figure 4
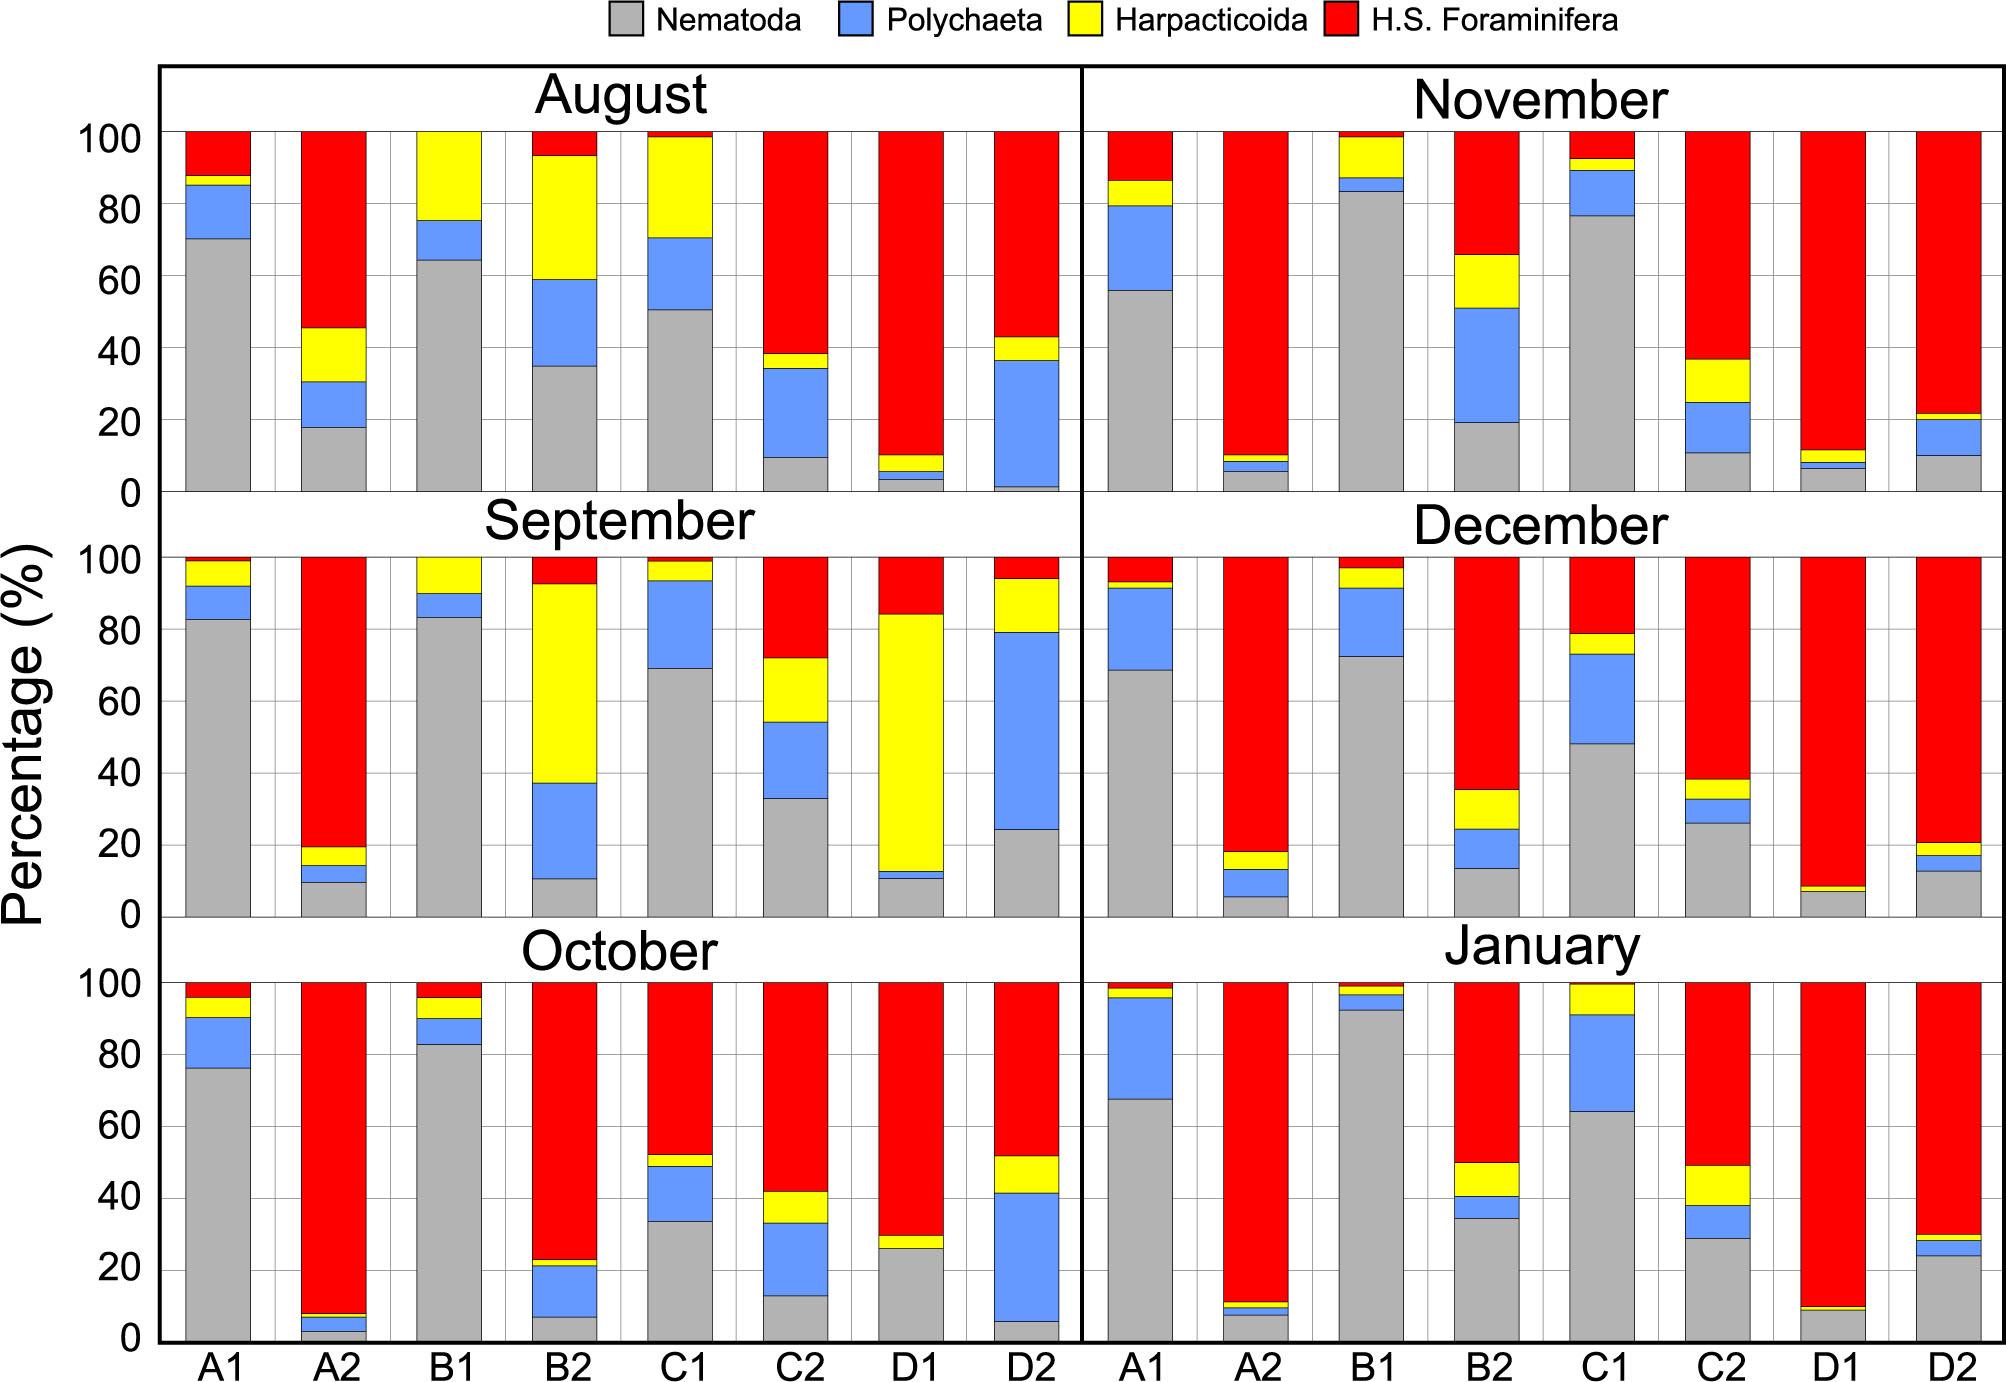
Figure 5
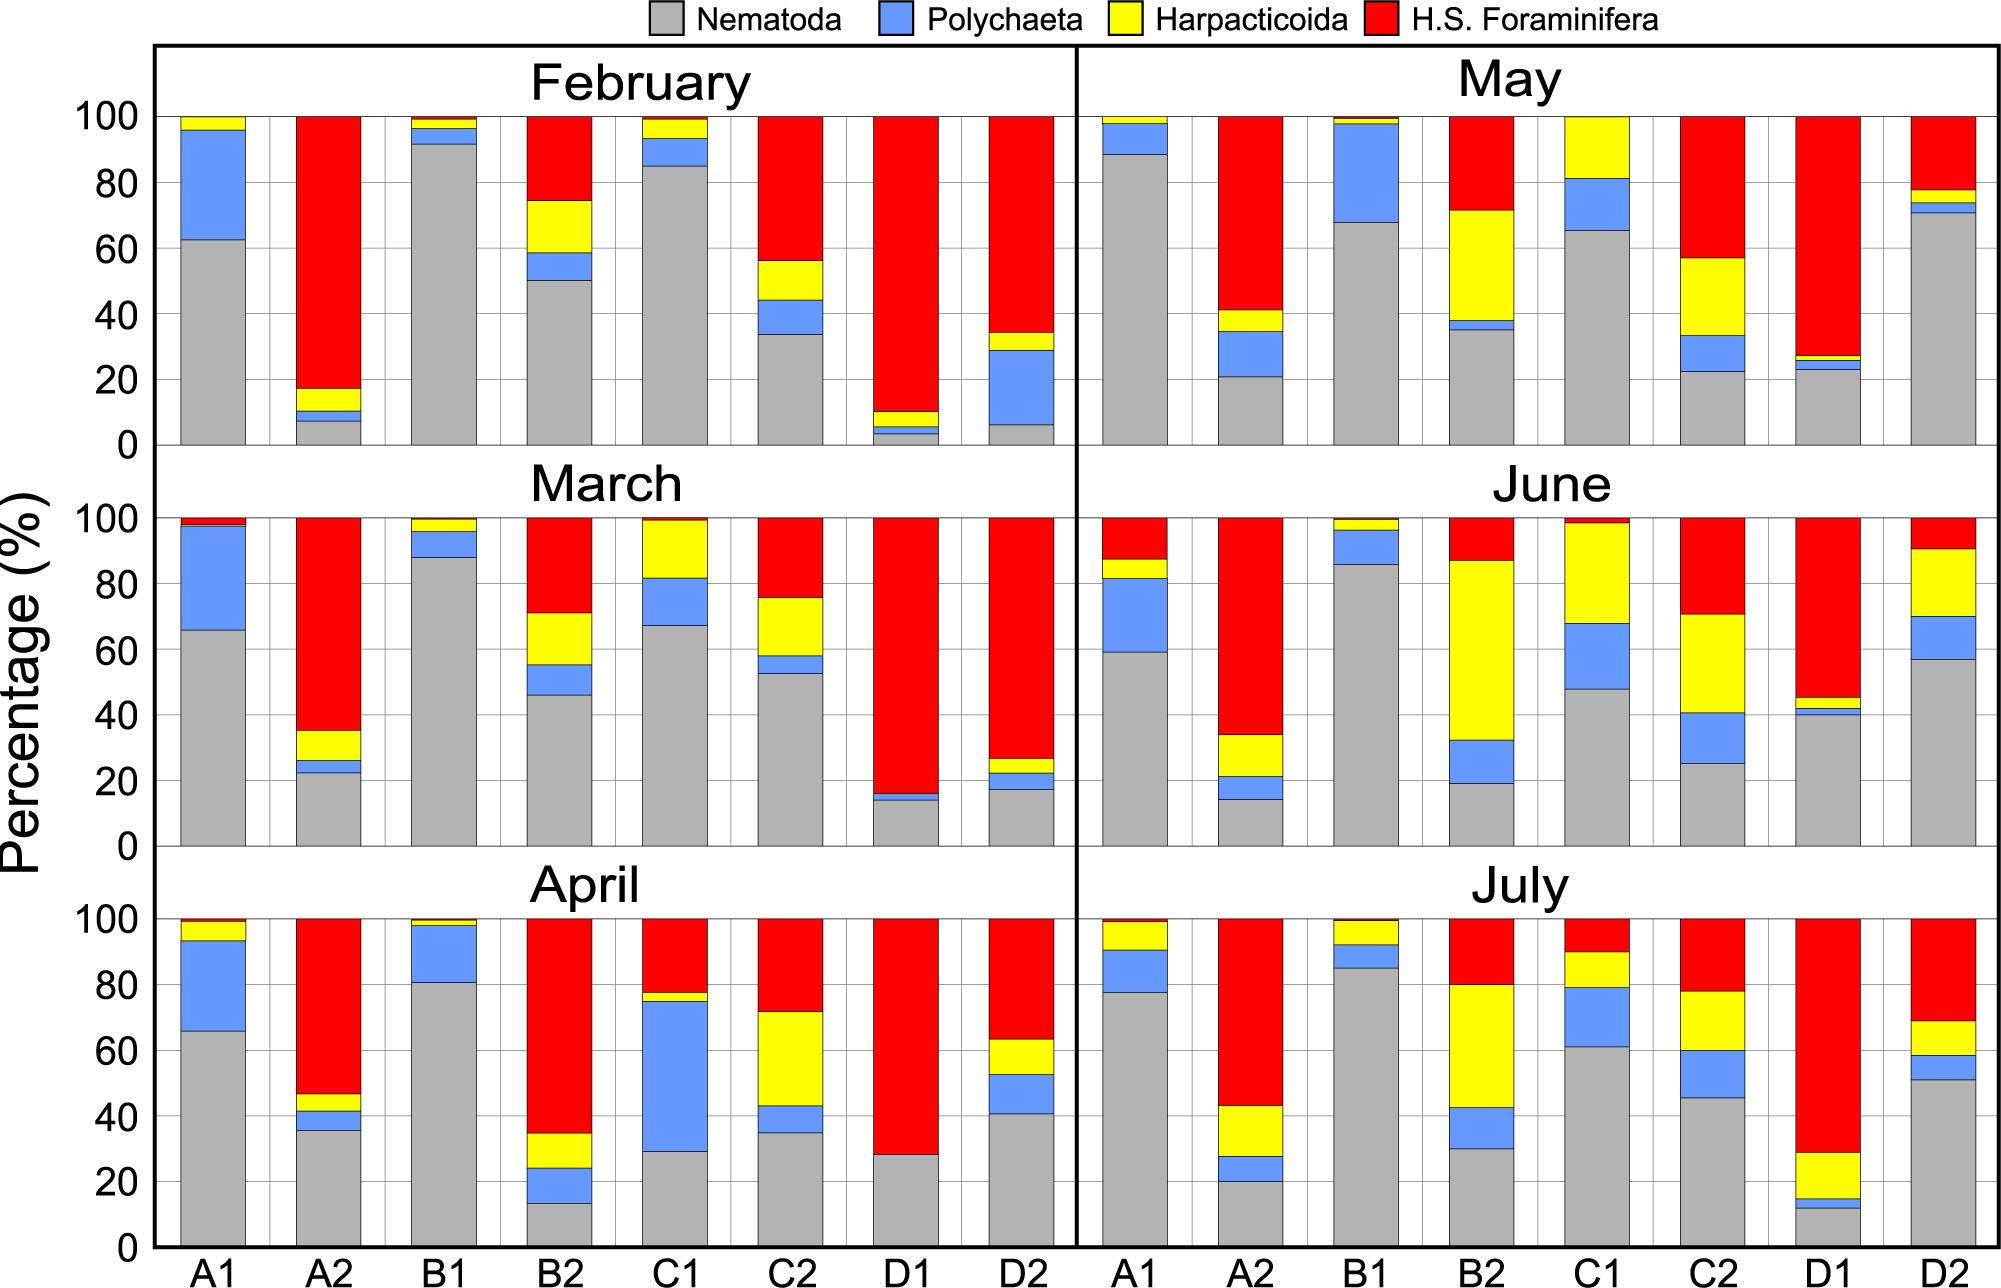
Figure 6
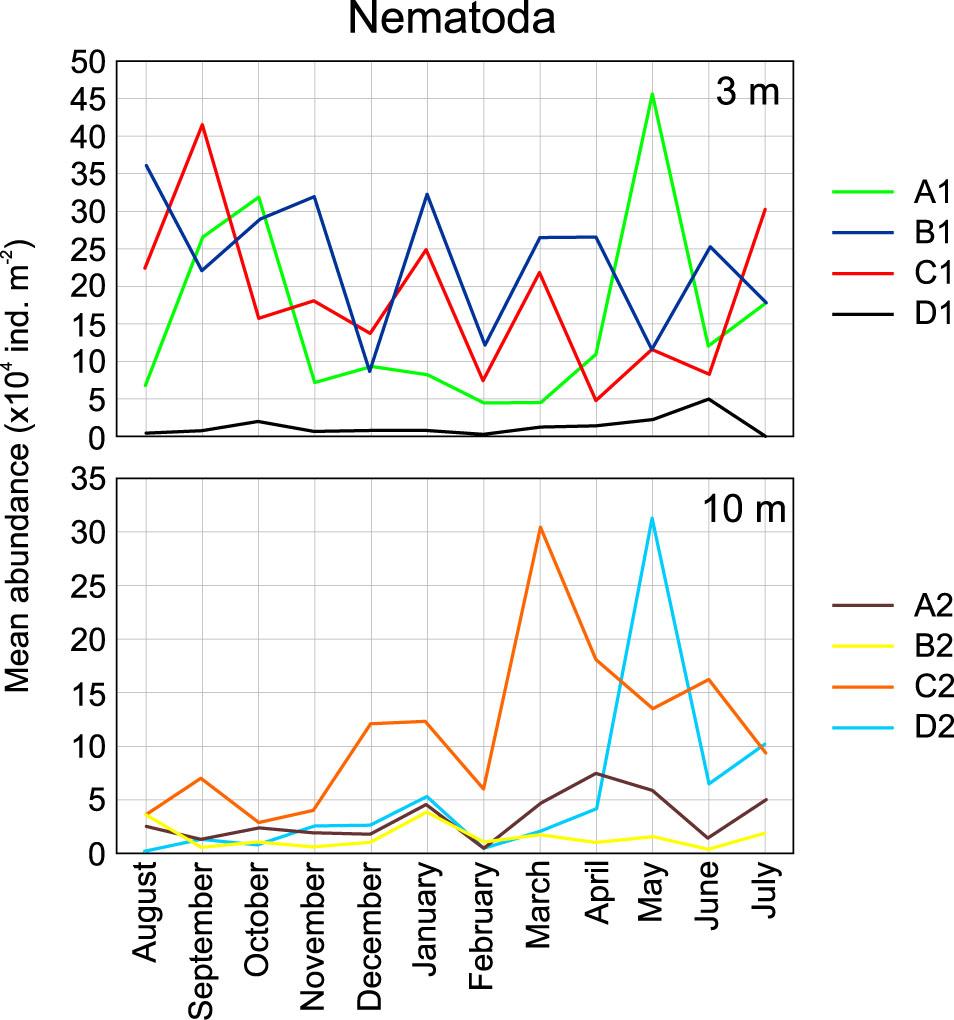
Figure 7
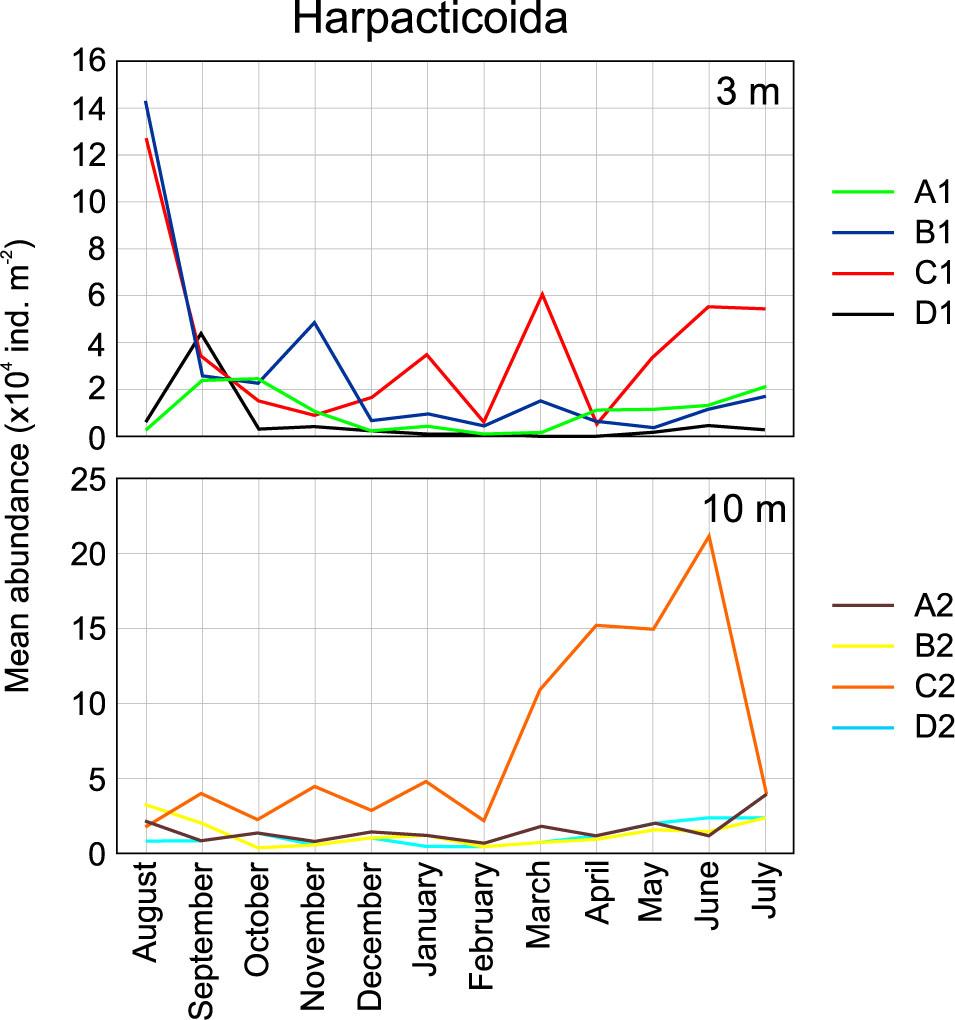
Figure 8
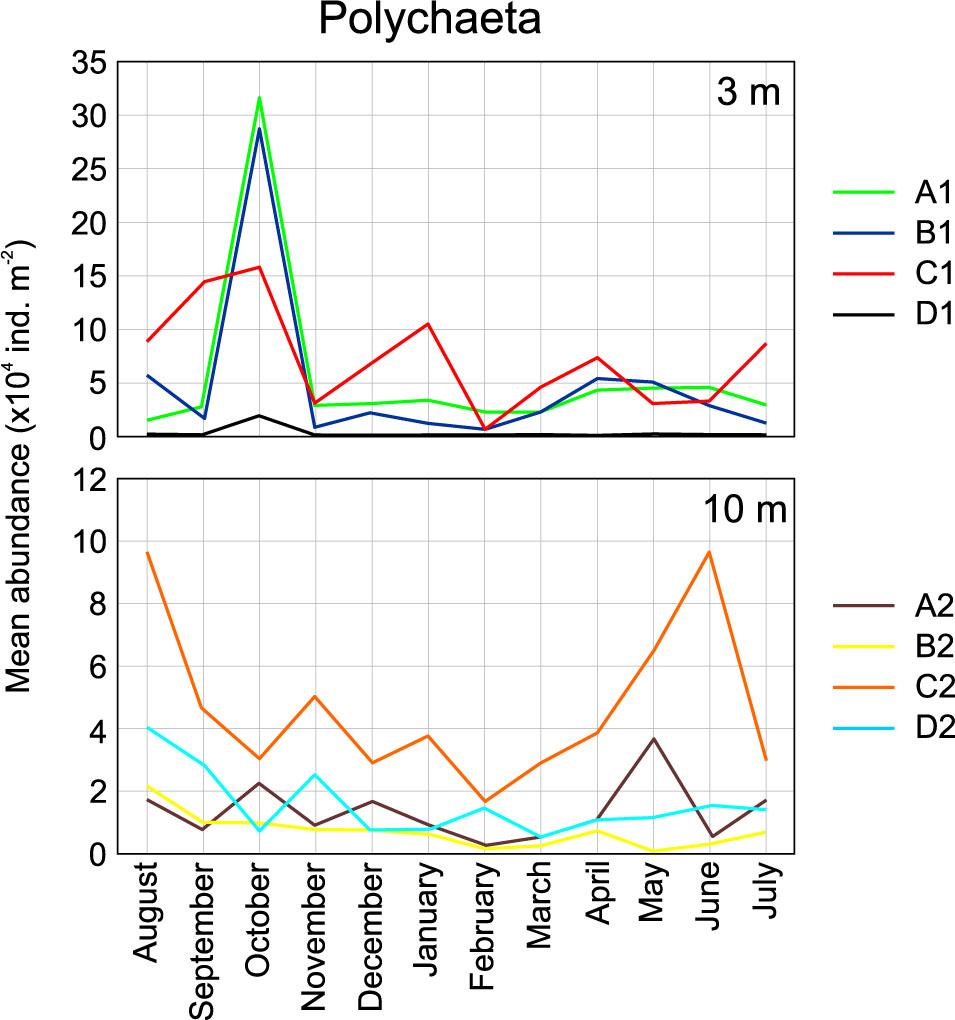
Figure 9
Results of ANOSIM of the Bray-Curtis similarity for the meiofaunal community structure
| Global R | P(%) | |
|---|---|---|
| Aug-A1, Group C | 0.718 | 7.1 |
| Aug-A1, Group B | 1 | 6.7 |
| Aug-A1, Group B | 1 | 20 |
| Group C, Group B | 0.727 | 0.1 |
| Group C, Group A | 0.953 | 1.2 |
| Group B, Group A | 0.832 | 0.3 |
Correlation values between mean abundance of meiobenthic taxa and the environmental parameters
| Major taxa | pH | DO | po% | vfg | vcs | cs | fs | vfs | csi | T (°C) | R (Mv) | PO4 | OM (%) | NO2 | NO3 |
|---|---|---|---|---|---|---|---|---|---|---|---|---|---|---|---|
| Nematoda | -0.18 | 0.03 | -0.06 | -0.14 | -0.09 | 0.81 | -0.03 | -0.48 | -0.33 | 0.10 | 0.43 | -0.02 | -0.14 | 0.09 | 0.21 |
| Harpacticoida | 0.40 | 0.02 | -0.35 | 0.38 | 0.40 | 0.01 | -0.20 | -0.25 | -0.23 | 0.18 | -0.13 | 0.26 | 0.03 | 0.16 | 0.48 |
| Polychaeta | 0.27 | 0.12 | -0.19 | 0.14 | 0.23 | 0.47 | -0.04 | -0.52 | -0.30 | 0.16 | 0.03 | 0.12 | 0.05 | 0.06 | 0.41 |
| Foraminifera H.S. | 0.26 | 0.10 | -0.29 | 0.47 | 0.70 | -0.55 | -0.10 | -0.01 | 0.13 | -0.14 | -0.36 | -0.08 | 0.05 | -0.05 | 0.05 |
| Foraminifera S.S. | 0.01 | 0.07 | 0.12 | -0.17 | -0.15 | 0.51 | 0.17 | -0.35 | -0.22 | 0.21 | -0.01 | 0.02 | 0.16 | -0.06 | 0.17 |
| Bivalvia | 0.17 | 0.49 | 0.15 | -0.13 | -0.03 | 0.08 | 0.28 | -0.25 | -0.05 | 0.17 | 0.15 | 0.11 | -0.13 | -0.28 | 0.28 |
| Gastropoda | 0.19 | 0.24 | -0.06 | 0.18 | 0.53 | -0.39 | 0.16 | -0.03 | -0.05 | -0.02 | -0.38 | 0.03 | 0.28 | -0.14 | 0.31 |
| Ostracoda | 0.39 | -0.06 | -0.56 | 0.55 | 0.81 | -0.35 | -0.35 | -0.12 | 0.03 | -0.13 | -0.35 | 0.02 | 0.07 | 0.15 | 0.18 |
| Turbellaria | -0.31 | -0.18 | 0.10 | -0.33 | -0.28 | 0.87 | 0.12 | -0.44 | -0.38 | 0.02 | 0.31 | -0.08 | -0.07 | 0.16 | 0.05 |
| Nemertea | 0.09 | 0.48 | -0.11 | -0.02 | 0.18 | 0.36 | 0.00 | -0.34 | -0.14 | 0.14 | 0.29 | -0.08 | 0.13 | -0.35 | 0.09 |
| Oligochaeta | -0.31 | -0.03 | 0.16 | -0.20 | -0.08 | 0.35 | 0.26 | -0.37 | -0.09 | -0.34 | 0.08 | -0.50 | -0.28 | -0.17 | -0.16 |
| Acari | 0.05 | -0.36 | -0.01 | -0.21 | -0.17 | 0.17 | 0.16 | -0.07 | -0.15 | -0.31 | -0.09 | 0.03 | -0.10 | 0.47 | 0.21 |
| Amphipoda | -0.03 | 0.06 | 0.03 | -0.01 | 0.24 | 0.01 | -0.17 | 0.08 | -0.18 | 0.25 | 0.09 | 0.18 | -0.13 | -0.22 | 0.33 |
| Insecta | 0.06 | 0.37 | -0.13 | 0.11 | 0.44 | 0.00 | 0.04 | -0.18 | -0.18 | 0.13 | 0.14 | -0.04 | 0.00 | -0.32 | 0.15 |
| Ciliophora | -0.10 | -0.13 | 0.02 | -0.28 | -0.29 | 0.60 | 0.18 | -0.31 | -0.32 | 0.11 | 0.22 | 0.11 | 0.00 | 0.28 | 0.19 |
| Echinodermata | -0.03 | 0.31 | -0.12 | -0.03 | 0.19 | 0.19 | -0.05 | -0.15 | -0.02 | 0.09 | 0.24 | -0.01 | -0.13 | -0.21 | 0.10 |
| Hydrozoa | 0.12 | -0.07 | -0.52 | 0.38 | 0.67 | -0.22 | -0.31 | -0.12 | 0.24 | -0.22 | -0.01 | -0.11 | 0.17 | 0.13 | -0.13 |
| Kinorhyncha | 0.23 | 0.12 | -0.46 | 0.27 | 0.69 | -0.14 | -0.27 | -0.14 | 0.21 | -0.10 | -0.13 | -0.11 | 0.10 | -0.03 | -0.04 |
| Tanaidacea | 0.03 | 0.20 | 0.01 | 0.04 | 0.44 | -0.10 | -0.13 | 0.09 | 0.01 | 0.15 | -0.08 | -0.06 | -0.08 | -0.36 | 0.11 |
| Tardigrada | 0.42 | -0.01 | -0.62 | 0.51 | 0.74 | -0.18 | -0.38 | -0.19 | -0.02 | -0.05 | -0.29 | 0.10 | 0.16 | 0.22 | 0.25 |
| Cnidaria | 0.20 | -0.31 | -0.27 | 0.27 | 0.14 | 0.09 | -0.21 | -0.13 | -0.14 | -0.17 | -0.16 | 0.06 | 0.01 | 0.45 | 0.14 |
| Nauplia | -0.16 | -0.27 | 0.04 | -0.05 | -0.13 | 0.37 | -0.08 | -0.12 | -0.12 | -0.09 | -0.01 | 0.03 | -0.12 | 0.30 | -0.17 |
| Cumacea | 0.08 | 0.24 | 0.01 | -0.03 | 0.03 | 0.29 | -0.04 | -0.16 | -0.21 | 0.53 | 0.23 | 0.22 | 0.70 | -0.12 | 0.13 |
| Pycnogonida | 0.11 | 0.00 | -0.24 | 0.32 | 0.26 | -0.10 | -0.19 | -0.08 | -0.10 | 0.15 | -0.19 | 0.21 | -0.12 | 0.03 | 0.15 |
| Phoronidae | 0.35 | 0.22 | -0.25 | 0.44 | -0.01 | -0.17 | -0.20 | 0.01 | -0.01 | 0.13 | -0.16 | 0.23 | 0.01 | -0.22 | -0.04 |