Figure 1
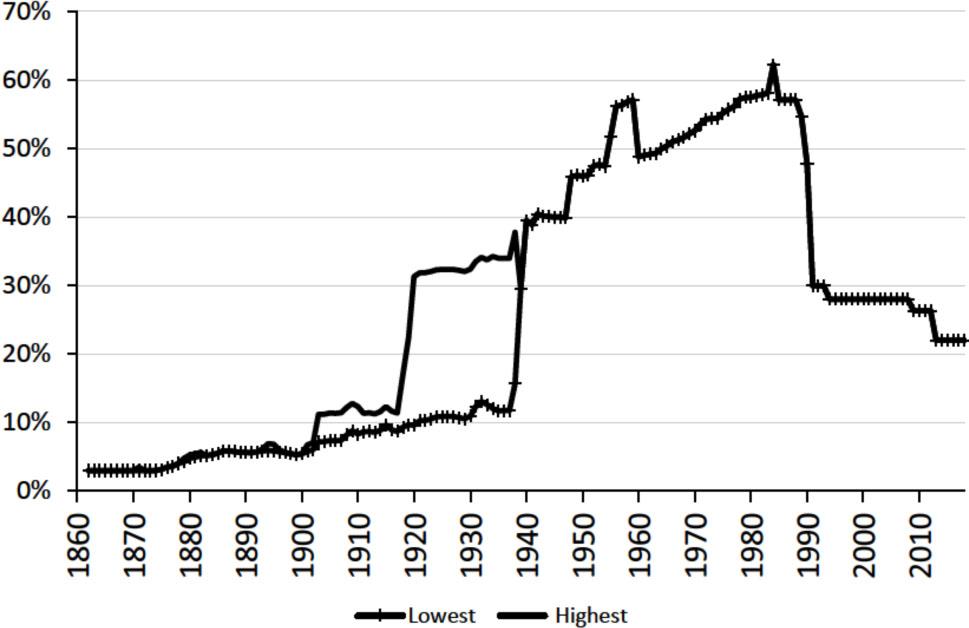
Figure 2
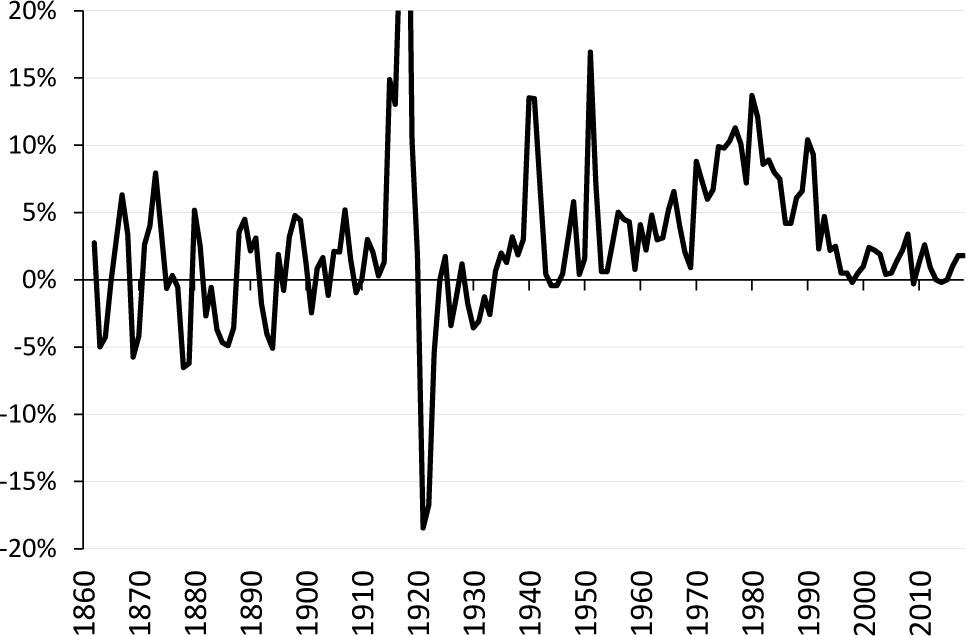
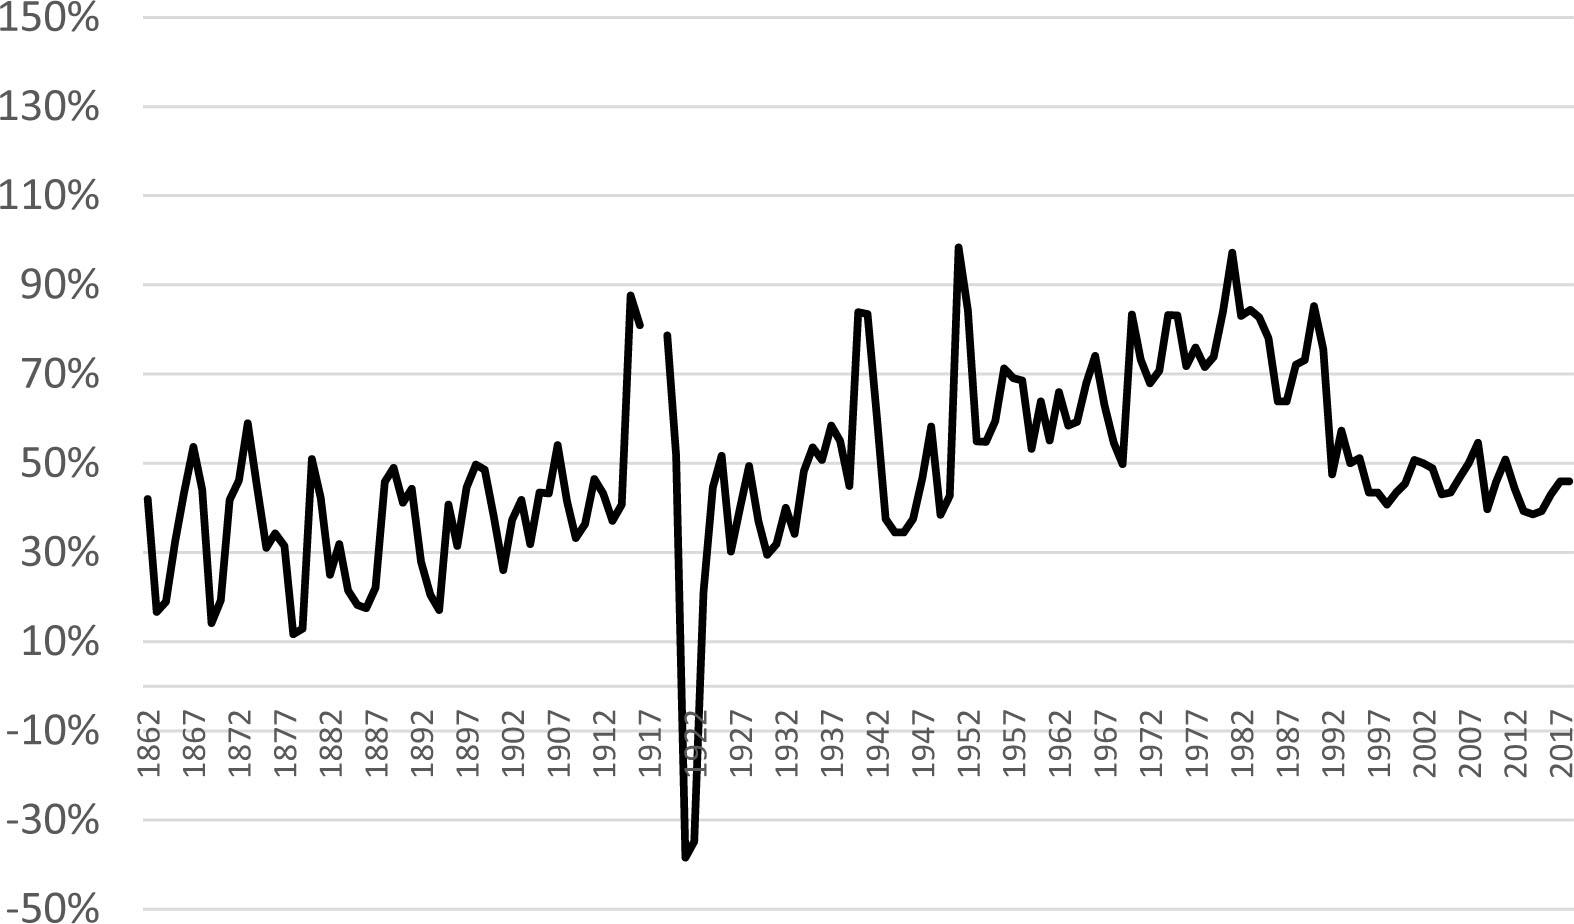
Figure 3
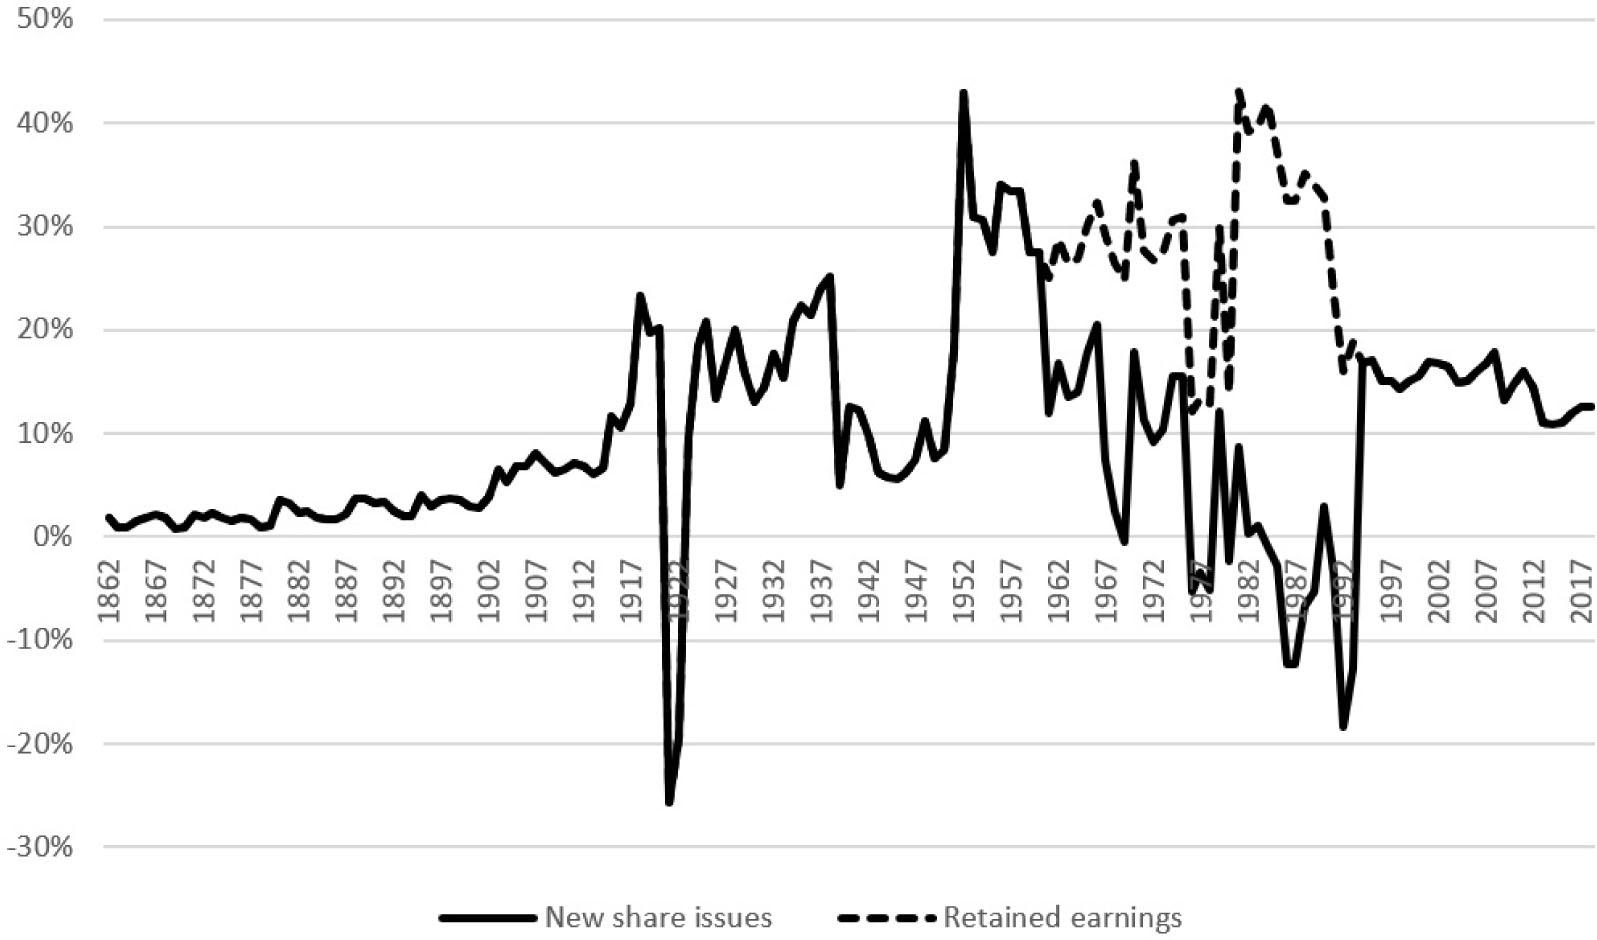
Figure 4
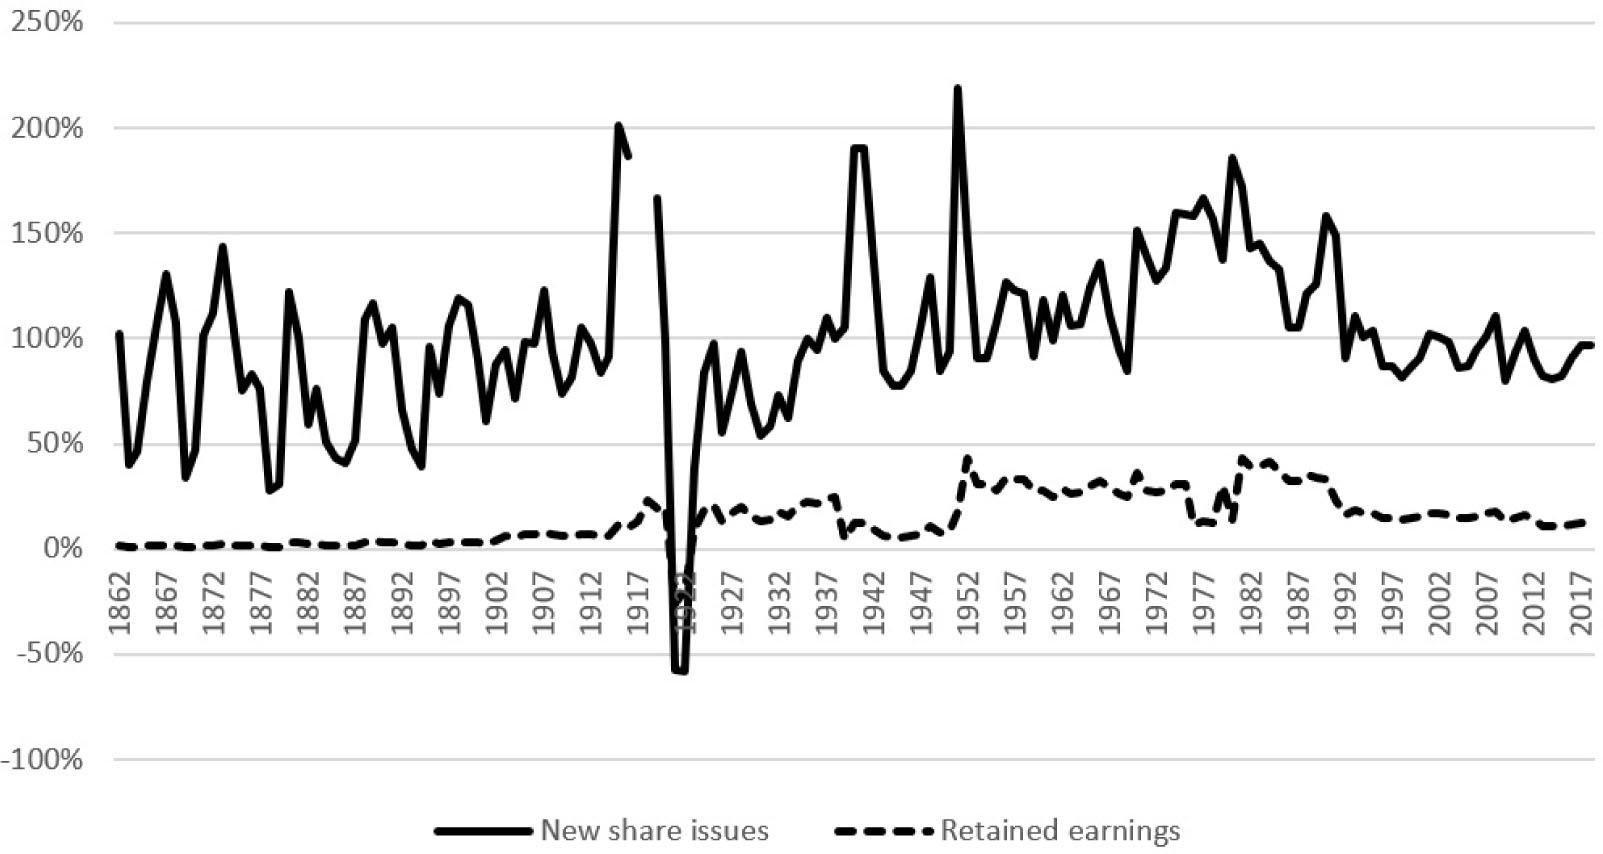
Figure 5

© 2021 Dan Johansson, Mikael Stenkula, Niklas Wykman, published by DJØF Publishing, Nordic Tax Research Council
This work is licensed under the Creative Commons Attribution-NonCommercial-NoDerivatives 4.0 License.