
Figure 1
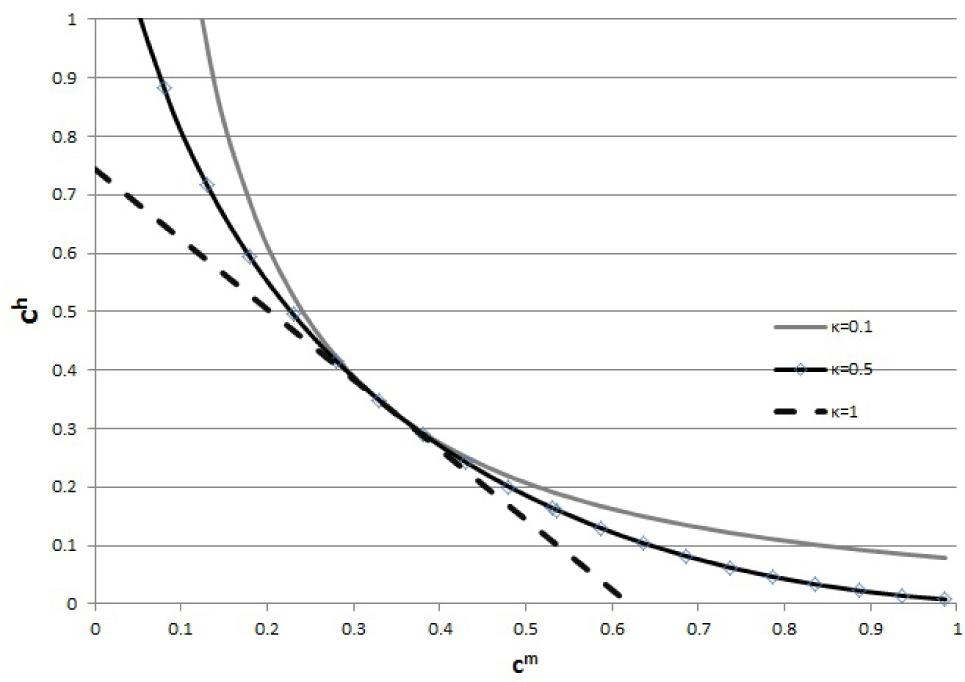
Figure 2
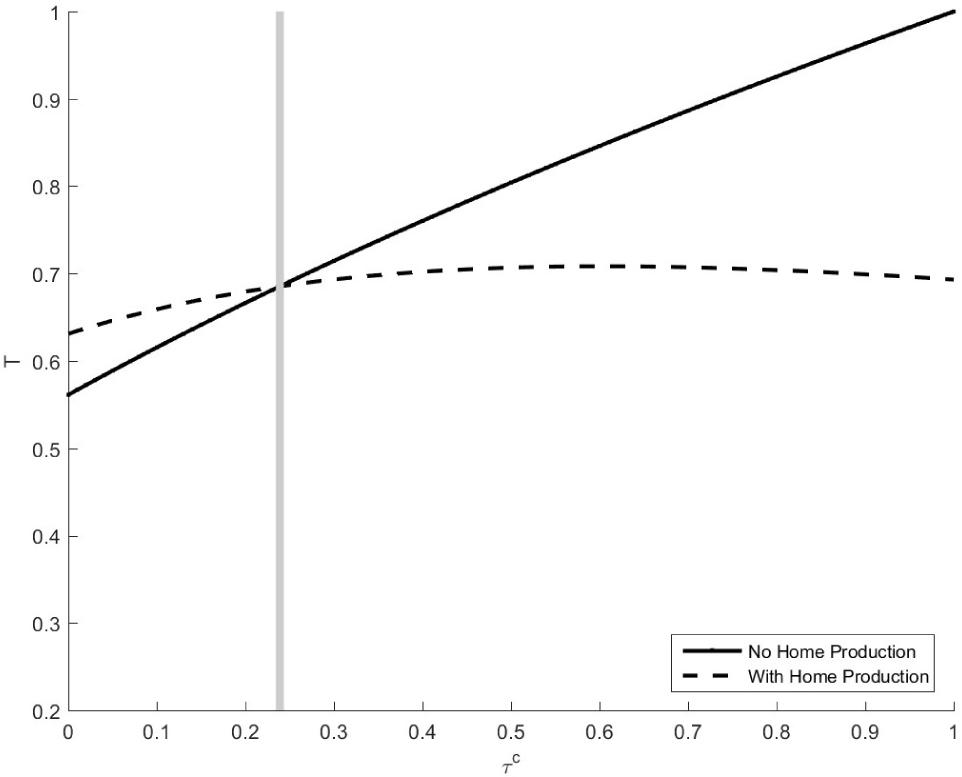
Figure 3
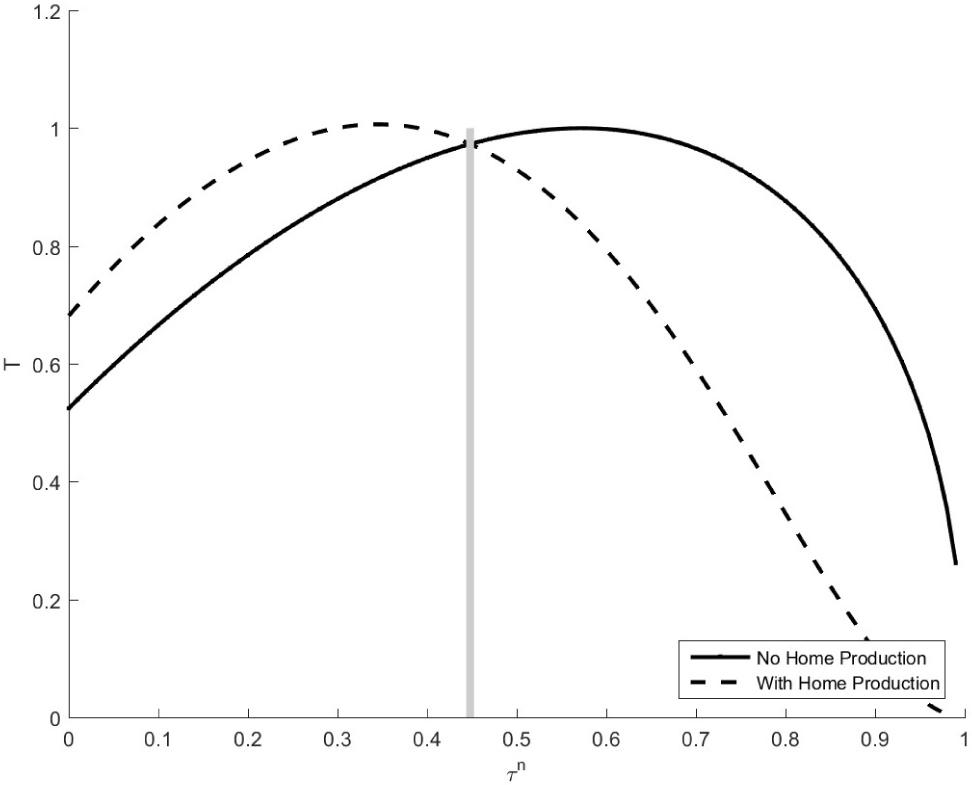
Figure 4
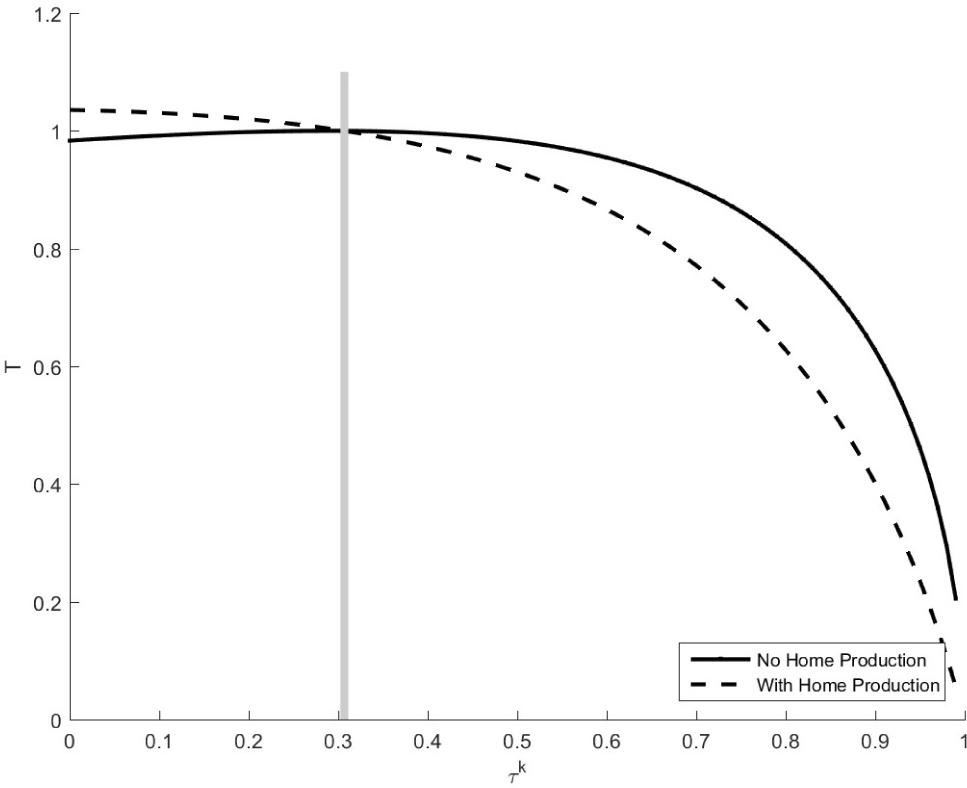
Figure 5
Calibration of Parameters
| Parameter | Value |
|---|---|
| γA | 0.009 |
| ϕ | 0.82 |
| α | 0.349 |
| αh | 1 |
| δ | 0.060 |
| σ | 2 |
| γ | 2.420 |
| ω | 0.545 |
| β | 0.969 |
| κ | 0.5 |
Steady State and Data Averages 2009–2013
| Variable | Model-produced value | Data value |
|---|---|---|
| c/y | 0.536 | 0.539 |
| i/y | 0.181 | 0.182 |
| rb | 0.051 | 0.015 Average yield on 5-year government bond 2009–2014. |
Sensitivity of the Model with Home Production
| Parameter | Baseline | Modified | Laffer Peak | ||
|---|---|---|---|---|---|
| value | value | τn | τc | τk | |
| Baseline | 35% | 60% | 0% | ||
| Behavioral parameters | |||||
| σ | 2 | 0.5 | +4% | +11% | 0% |
| β | 0.969 | 0.95 | 0% | –5% | 0% |
| ϕ | 0.82 | 0.1 | +5% | +12% | +2% |
| κ | 0.5 | 0.4 | +1% | +33% | 0% |
| Firm level parameters | |||||
| gA | 0.009 | 0.02 | –2% | –8% | 0% |
| δ | 0.06 | 0.09 | 0% | –8% | 0% |
| The government | |||||
| g/y | 0.243 | 0.3 | 0% | –9% | 0% |
| b/y | 0.493 | 0.8 | 0% | 0% | 0% |
Calibration of Exogenous Variables
| Variable | Value |
|---|---|
| g/y | 0.243 |
| ig/y | 0.04 |
| Tc | 0.239 |
| Tn | 0.448 |
| Tk | 0.307 |
| b/y | 0.509 |