
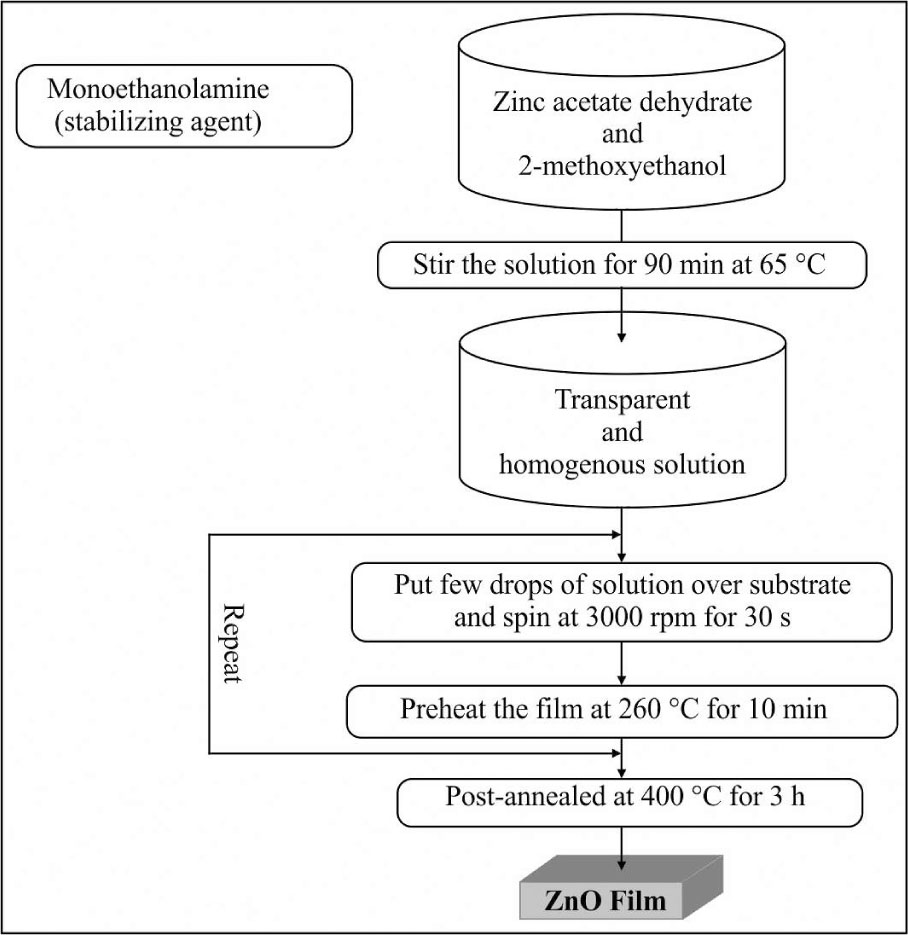
Flow chart of preparation of ZnO thin films.
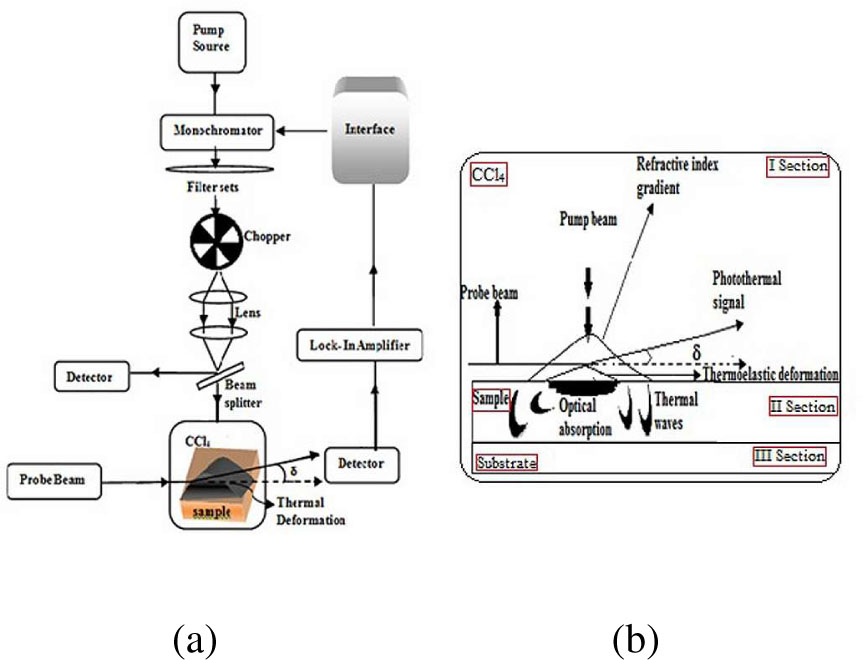
(a) Schematic diagram of PDS setup, (b) the interface geometry of the pump and probe beam.
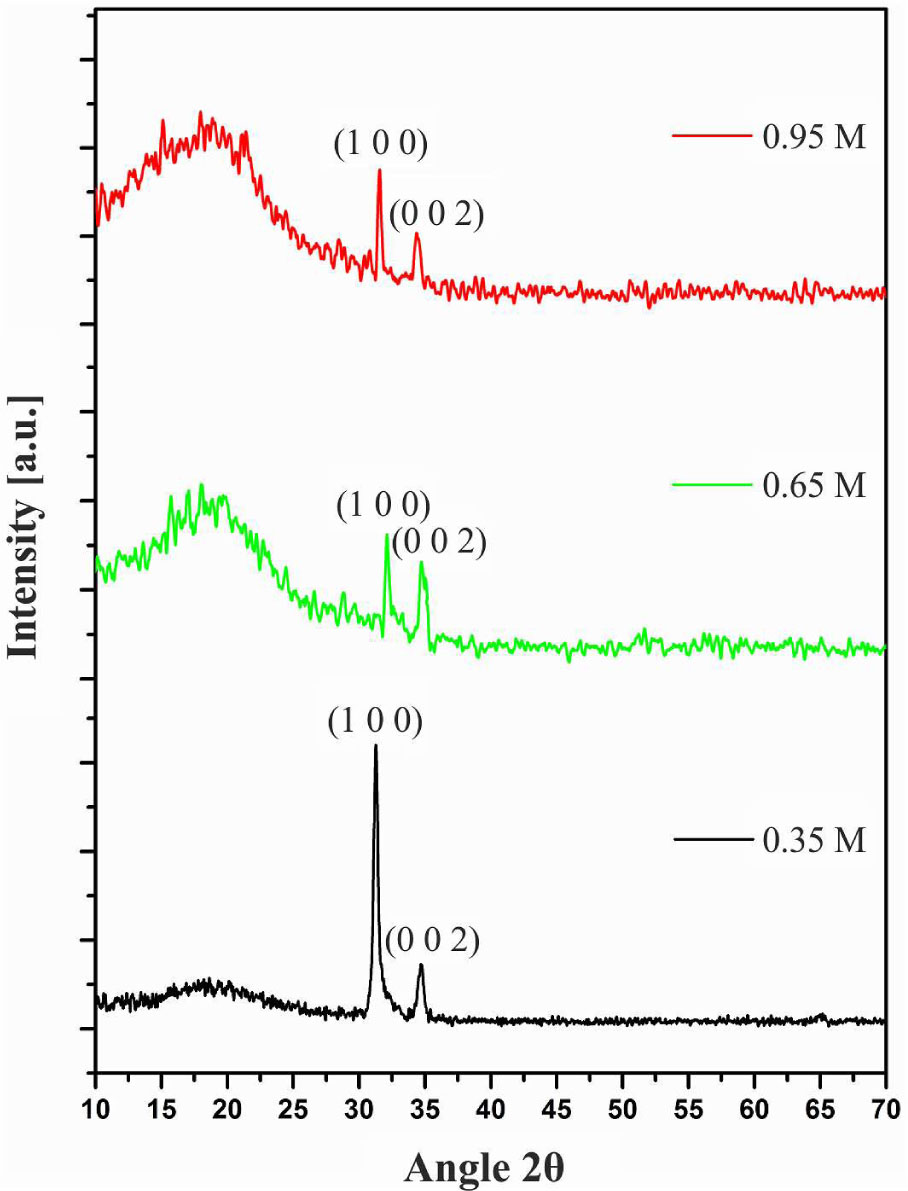
XRD pattern of ZnO thin films with different zinc molar concentrations.
Table 1
Structural parameters, thickness and band gap of ZnO thin films with different zinc acetate concentrations.
| Zinc acetate | Growth | Crystallite | Thickness | Band |
|---|---|---|---|---|
| concentration | plane | size [nm] | [nm] | gap [eV] |
| 0.35 M | (1 0 0) | 30 | 190 | 3.31 |
| 0.65 M | (1 0 0) | 35 | 250 | 3.24 |
| 0.95 M | (1 0 0) | 51 | 300 | 3.18 |
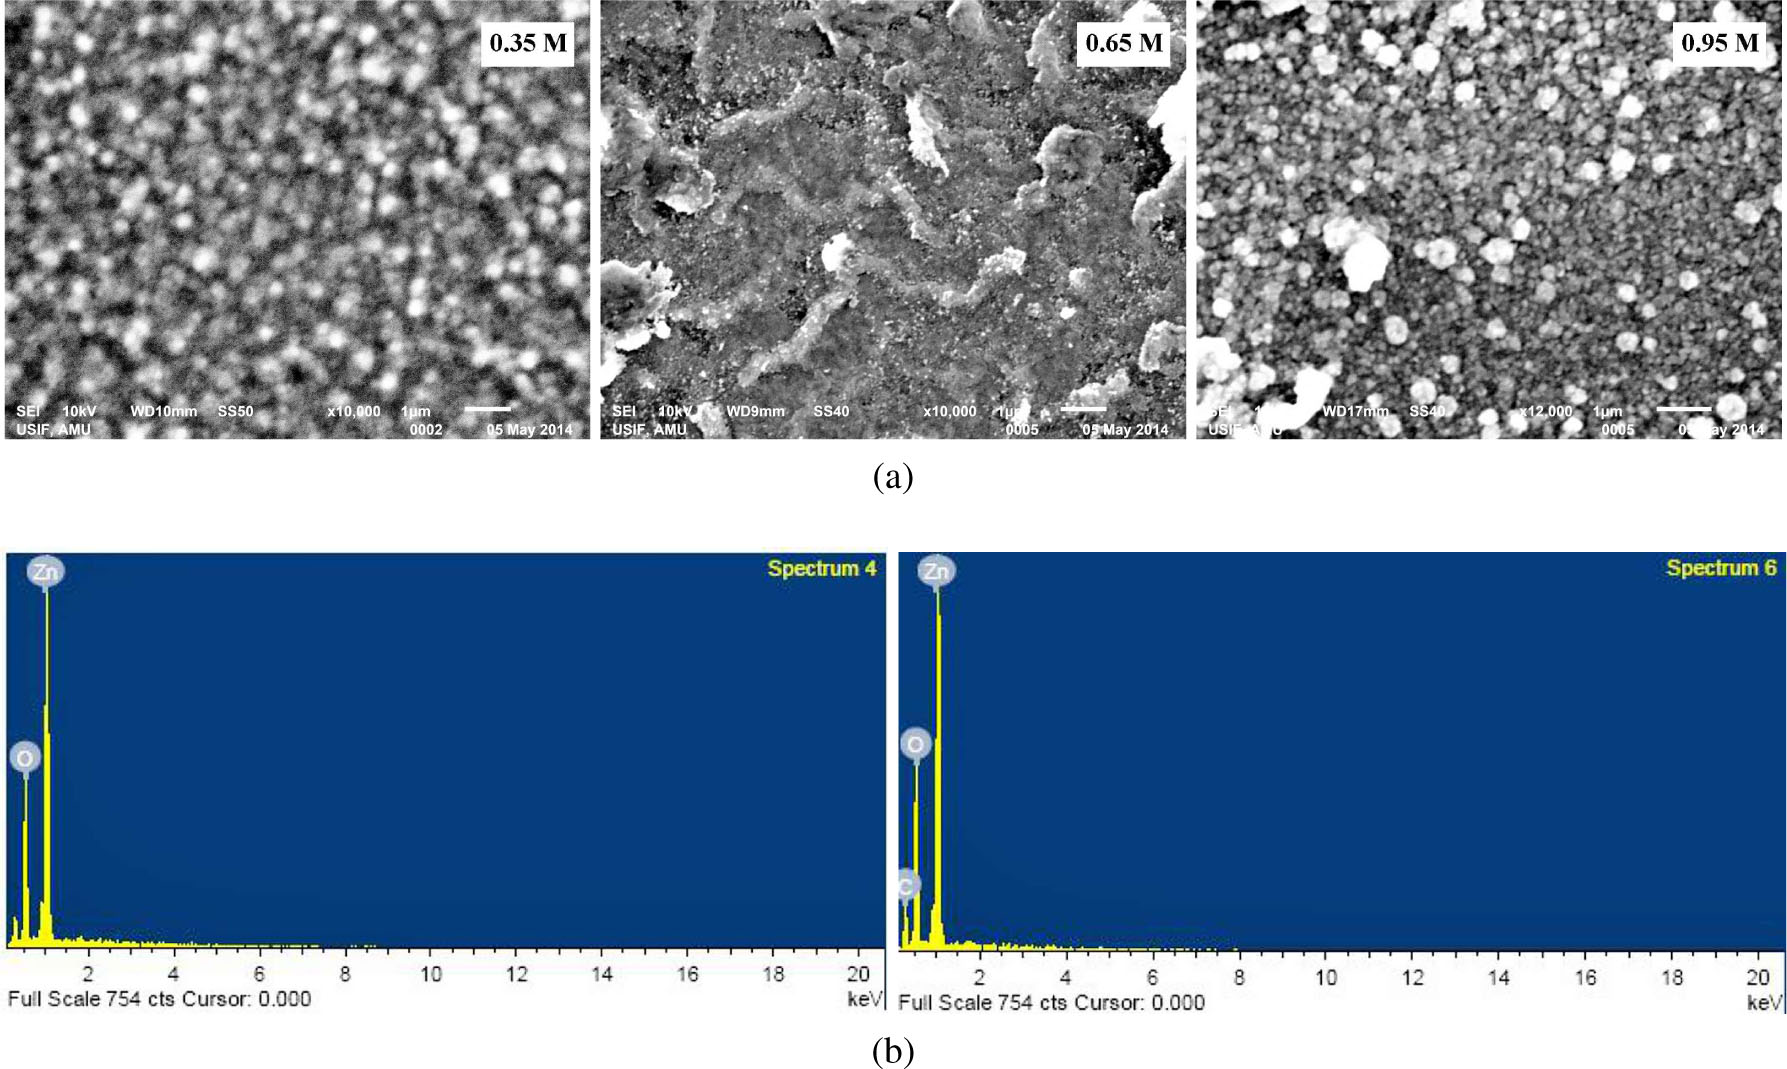
(a) SEM micrographs of ZnO thin films with different zinc molar concentrations, (b) EDX spectra of ZnO thin films.
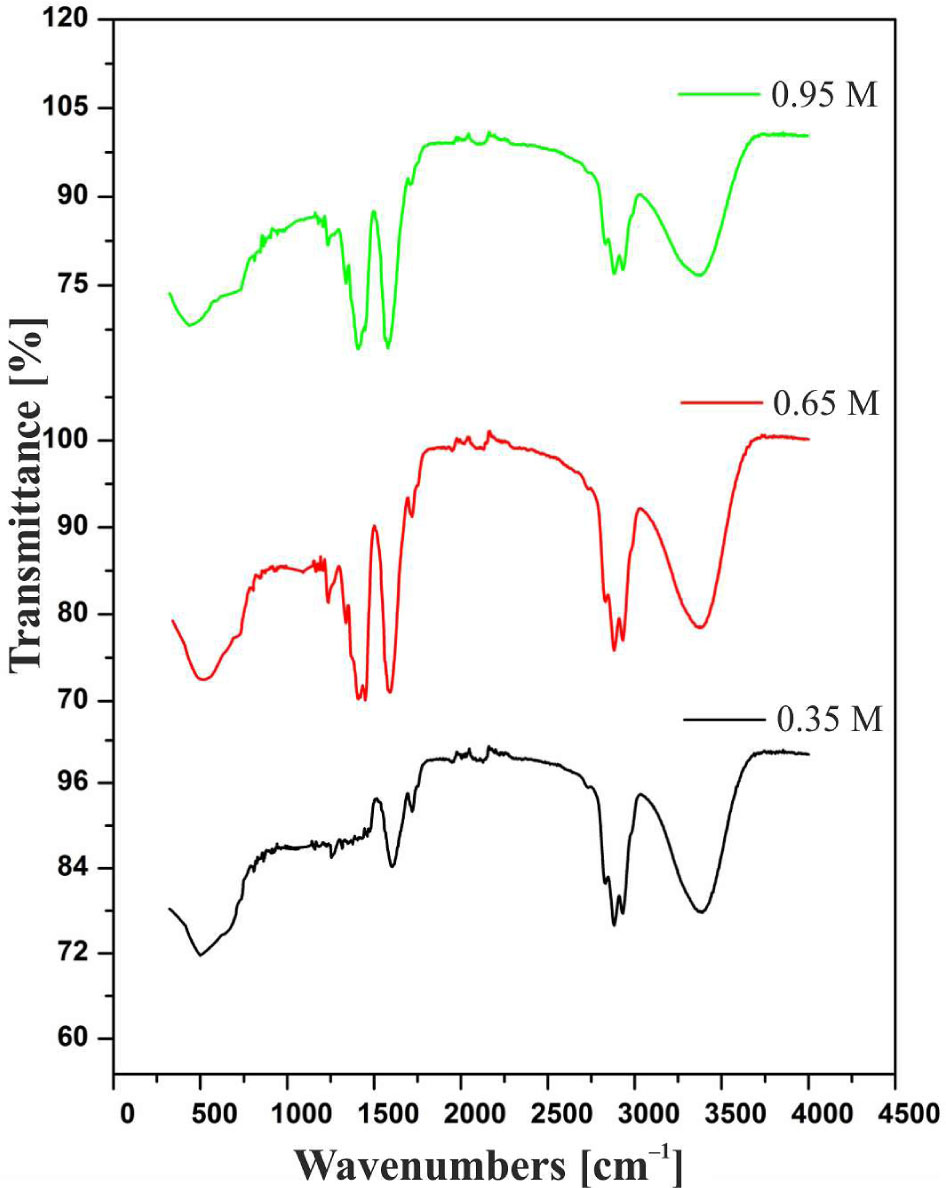
FT-IR spectra of ZnO thin films with different zinc concentrations.
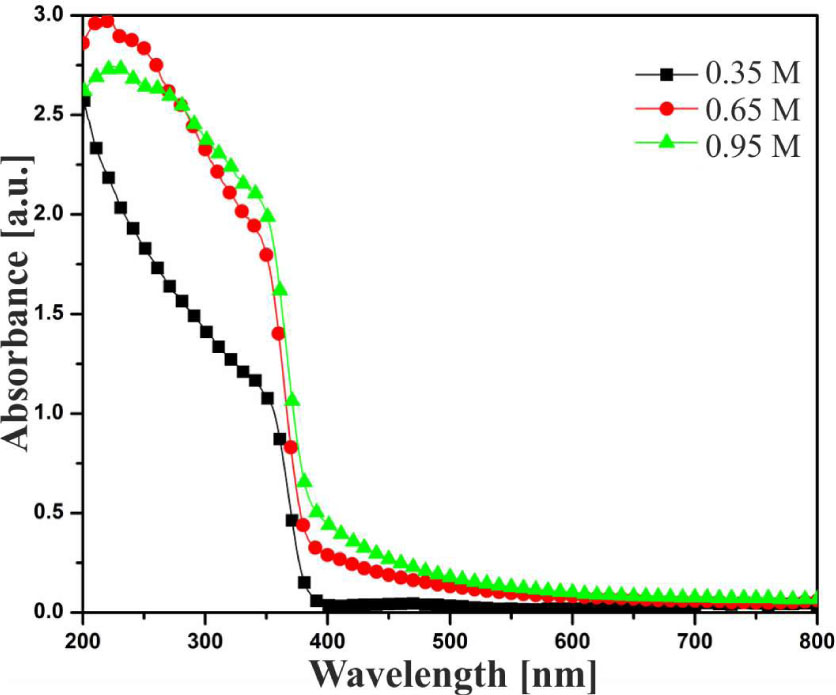
Absorbance spectra of ZnO thin films with different zinc concentrations.
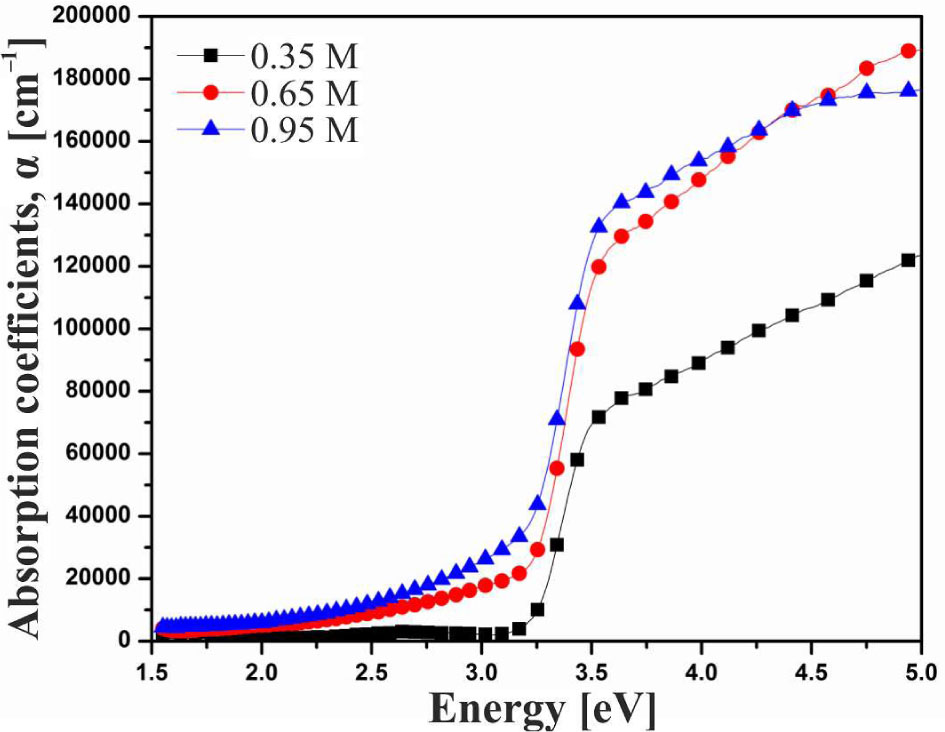
Absorption coefficients of ZnO thin films with different zinc concentrations.
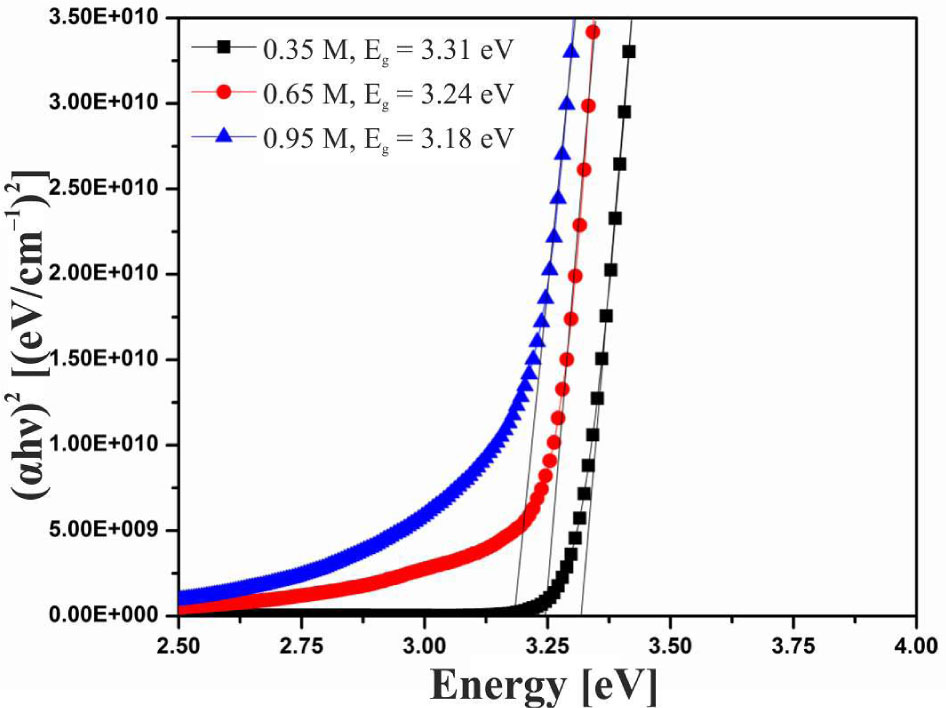
Tauc’s plots of ZnO thin films with different zinc concentrations.
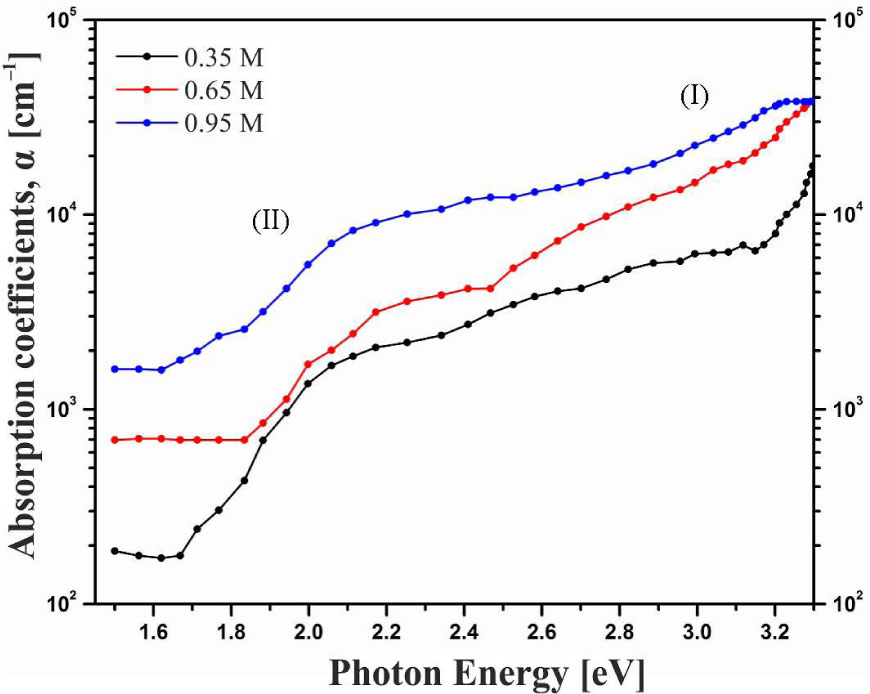
Absorption coefficients α of ZnO thin thin films with different zinc concentrations (from PDS) as a function of photon energy in the energy range of 1.5 eV to 3.3 eV.
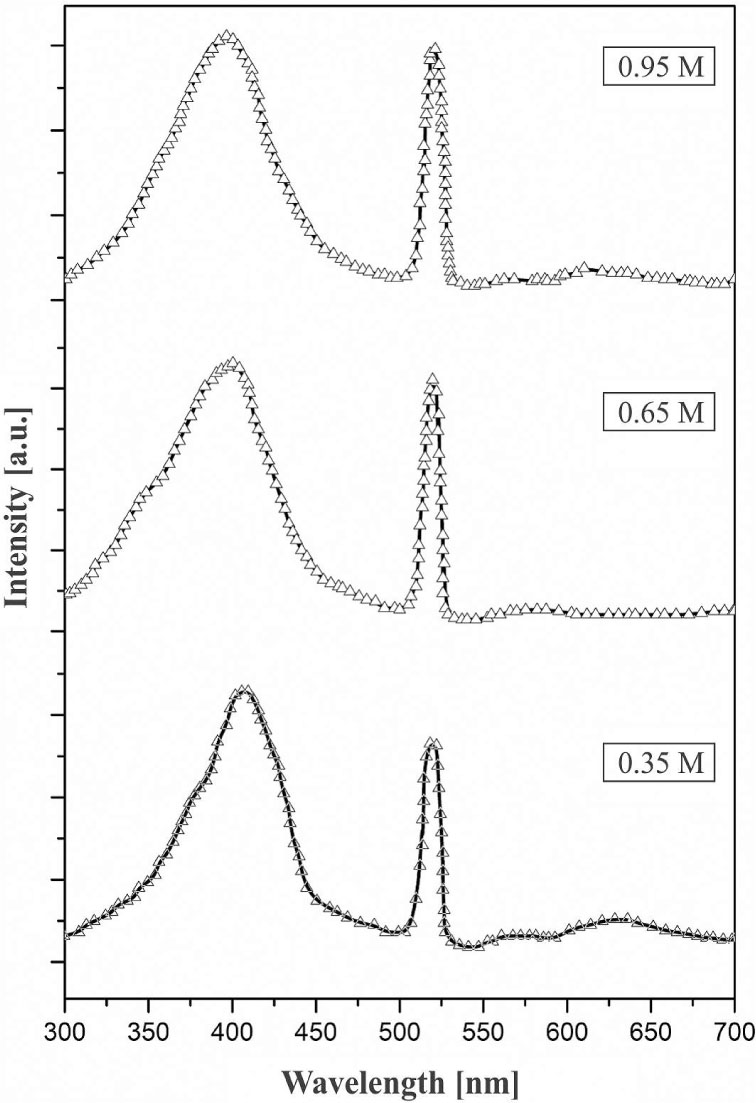
Photoluminescence spectra of ZnO thin films grown from different zinc concentration sols.