
Percentage difference in cell voltage generation of AR coated solar cell compared to bare cell under controlled atmosphere conditions_
| S. No. | Radiation from light [W/m2] | AR Coating time [min] | Percentage increase in cell voltage (compared to pure silicon solar cell) in temperatures [°C] | ||||
|---|---|---|---|---|---|---|---|
| 35 | 40 | 45 | 50 | 55 | |||
| 10 | 0.6 | 1.4 | 1.8 | 2.9 | 3.6 | ||
| 15 | 0.9 | 1.5 | 2.1 | 3.3 | 4.1 | ||
| 20 | 1.1 | 2.0 | 3.6 | 4.1 | 5.0 | ||
| 1 | 200 | 25 | 1.5 | 2.4 | 3.8 | 4.6 | 3.3 |
| 30 | 1.8 | 2.6 | 4.0 | 5.0 | 6.2 | ||
| 35 | 1.0 | 2.5 | 3.1 | 4.0 | 5.2 | ||
| 40 | 0.8 | 1.2 | 2.1 | 2.3 | 2.6 | ||
| 45 | 0.6 | 0.9 | 1.7 | 1.5 | 1.8 | ||
| 10 | 0.9 | 1.7 | 2.3 | 4.1 | 3.8 | ||
| 15 | 1.3 | 2.1 | 2.6 | 3.6 | 4.5 | ||
| 20 | 1.6 | 2.7 | 3.7 | 4.7 | 5.1 | ||
| 2 | 250 | 25 | 1.8 | 3.0 | 4.1 | 5.1 | 5.6 |
| 30 | 2.3 | 3.3 | 4.5 | 5.5 | 6.6 | ||
| 35 | 1.4 | 2.0 | 3.9 | 4.9 | 6.0 | ||
| 40 | 1.2 | 1.8 | 2.2 | 3.1 | 3.9 | ||
| 45 | 0.9 | 1.3 | 1.7 | 2.1 | 2.5 | ||
| 10 | 1.1 | 2.1 | 2.9 | 3.7 | 4.4 | ||
| 15 | 1.7 | 2.4 | 3.2 | 4.2 | 4.9 | ||
| 20 | 3.0 | 3.1 | 3.9 | 5.2 | 5.7 | ||
| 3 | 300 | 25 | 2.4 | 3.5 | 4.3 | 5.6 | 5.9 |
| 30 | 2.7 | 3.8 | 4.9 | 6.1 | 7.0 | ||
| 35 | 2.1 | 3.3 | 4.2 | 5.7 | 6.2 | ||
| 40 | 1.7 | 2.7 | 3.4 | 4.3 | 5.1 | ||
| 45 | 1.1 | 1.7 | 2.0 | 2.8 | 3.2 | ||
| 10 | 1.4 | 2.4 | 3.1 | 4.1 | 5.0 | ||
| 15 | 2.2 | 2.7 | 3.5 | 4.5 | 5.5 | ||
| 20 | 2.5 | 3.6 | 5.3 | 5.8 | 6.4 | ||
| 4 | 350 | 25 | 2.7 | 4.2 | 5.7 | 6.3 | 6.8 |
| 30 | 2.8 | 4.4 | 6.0 | 6.8 | 7.2 | ||
| 35 | 2.4 | 3.4 | 4.4 | 5.6 | 6.9 | ||
| 40 | 2.0 | 2.8 | 3.6 | 4.5 | 5.7 | ||
| 45 | 1.3 | 2.0 | 2.4 | 3.5 | 3.7 | ||
| 10 | 1.6 | 2.7 | 3.6 | 4.6 | 5.3 | ||
| 15 | 2.3 | 3.5 | 4.4 | 3.7 | 6.0 | ||
| 20 | 2.6 | 3.7 | 5.5 | 6.3 | 7.0 | ||
| 5 | 400 | 25 | 3.2 | 4.3 | 5.8 | 6.9 | 7.4 |
| 30 | 3.3 | 4.7 | 6.3 | 7.4 | 7.9 | ||
| 35 | 2.7 | 4.1 | 5.1 | 6.3 | 7.1 | ||
| 40 | 2.3 | 3.1 | 4.1 | 5.5 | 6.2 | ||
| 45 | 1.4 | 3.2 | 2.6 | 3.7 | 4.5 | ||
| 10 | 2.1 | 3.4 | 4.1 | 5.1 | 5.8 | ||
| 15 | 2.7 | 4.0 | 4.9 | 5.9 | 6.7 | ||
| 20 | 3.0 | 4.6 | 5.8 | 6.6 | 7.4 | ||
| 6 | 450 | 25 | 3.5 | 5.0 | 6.1 | 6.9 | 8.1 |
| 30 | 2.9 | 5.2 | 6.5 | 7.4 | 8.8 | ||
| 35 | 2.7 | 4.3 | 5.5 | 6.3 | 7.4 | ||
| 40 | 2.7 | 3.8 | 5.3 | 6.2 | 6.9 | ||
| 45 | 1.6 | 2.3 | 3.1 | 3.9 | 5.2 | ||
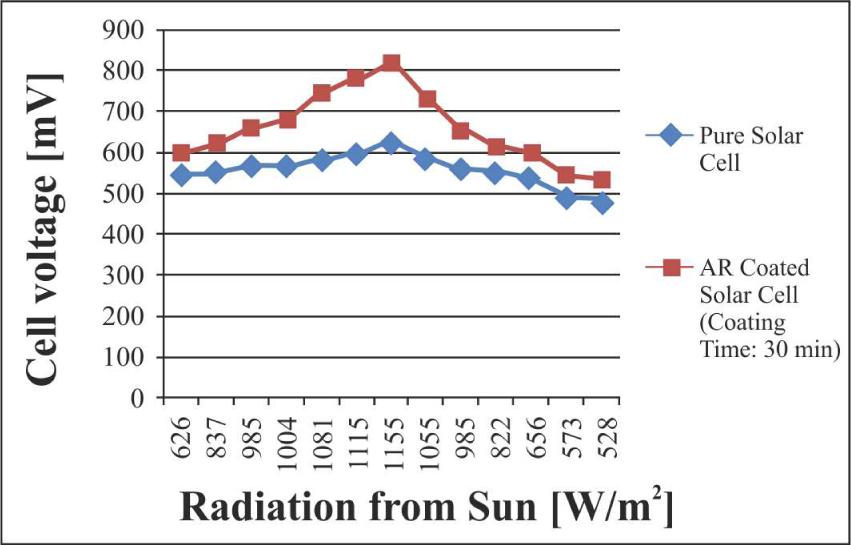
Percentage difference in cell voltage generation of AR coated solar cell compared to uncoated cell under open atmosphere conditions_
| Time interval | Radiation from sun [W/m2] | Percentage increase in cell voltage (compared to pure silicon solar sell) after AR coating time [min]: | |||||||
|---|---|---|---|---|---|---|---|---|---|
| 10 | 15 | 20 | 25 | 30 | 35 | 40 | 45 | ||
| 10:00 | 626 | 7.2 | 7.9 | 9.1 | 10.1 | 10.3 | 7.7 | 4.2 | 1.5 |
| 10:30 | 837 | 9.3 | 9.9 | 10.7 | 11.1 | 12.5 | 11.5 | 5.3 | 2.2 |
| 11:00 | 985 | 10.6 | 11.6 | 13.1 | 15.4 | 16.2 | 12.4 | 5.7 | 2.7 |
| 11:30 | 1004 | 11.8 | 13.2 | 13.7 | 16.7 | 19.5 | 14.2 | 6.3 | 2.8 |
| 12:00 | 1081 | 13.9 | 15.7 | 19.7 | 24.7 | 27.7 | 15.0 | 6.4 | 2.8 |
| 12:30 | 1115 | 15.0 | 18.5 | 22.5 | 23.3 | 30.3 | 14.9 | 6.7 | 3.1 |
| 13:00 | 1155 | 15.9 | 19.1 | 22.5 | 25.7 | 30.8 | 16.1 | 6.9 | 3.2 |
| 13:30 | 1055 | 14.4 | 16.4 | 20.1 | 21.7 | 24.6 | 16.2 | 4.4 | 2.9 |
| 14:00 | 985 | 10.9 | 12.9 | 15.5 | 17.1 | 16.8 | 12.7 | 5.3 | 2.7 |
| 14:30 | 822 | 8.9 | 9.9 | 10.2 | 10.6 | 10.8 | 5.5 | 3.8 | 2.4 |
| 15:00 | 656 | 7.9 | 8.6 | 9.5 | 10.4 | 11.0 | 5.3 | 3.6 | 1.7 |
| 15:30 | 573 | 7.3 | 8.6 | 9.9 | 10.3 | 10.5 | 4.5 | 2.5 | 1.4 |
| 16:00 | 528 | 6.5 | 7.7 | 8.6 | 9.3 | 10.1 | 4.4 | 2.1 | 1.3 |
Seasonal climatic condition of Erode district, Tamil Nadu State, India_
| Month | February | March | April | May | June |
|---|---|---|---|---|---|
| Record high [°C] | 37.6 | 39.7 | 40.3 | 40.4 | 38.6 |
| Average high [°C] | 33.3 | 35.9 | 36.7 | 35.2 | 32.2 |
| Average low [°C] | 19.5 | 21.3 | 23.4 | 23.5 | 22.4 |
| Record low [°C] | 12.8 | 15.6 | 17.8 | 16.1 | 18.3 |
| Average rainfall [mm] | 13.0 | 15.1 | 48 | 71.2 | 27.4 |
| Average rainy days | 1 | 1 | 3 | 4.2 | 2.7 |
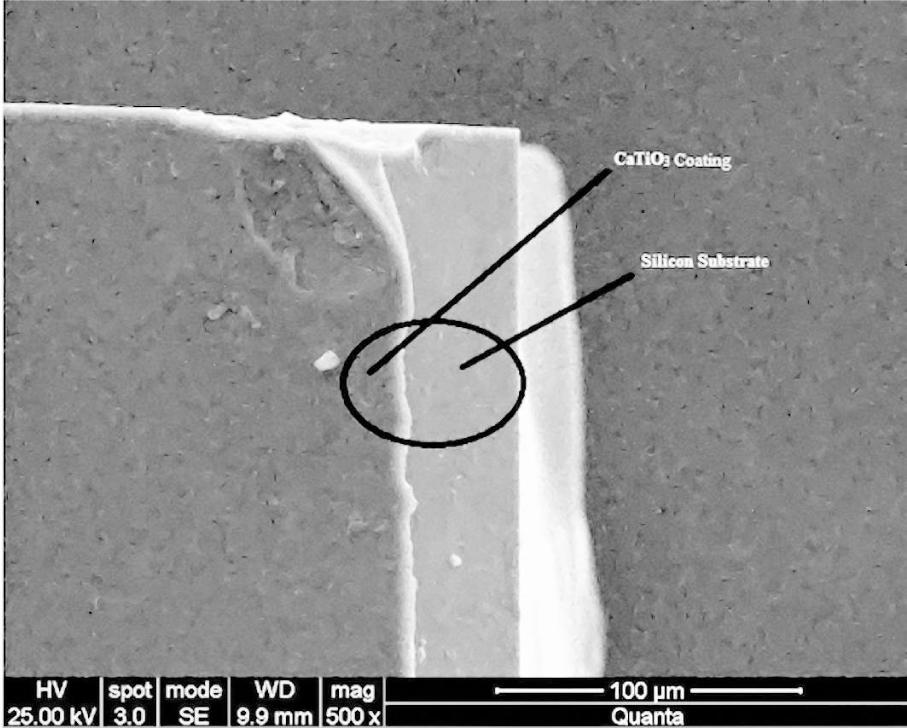
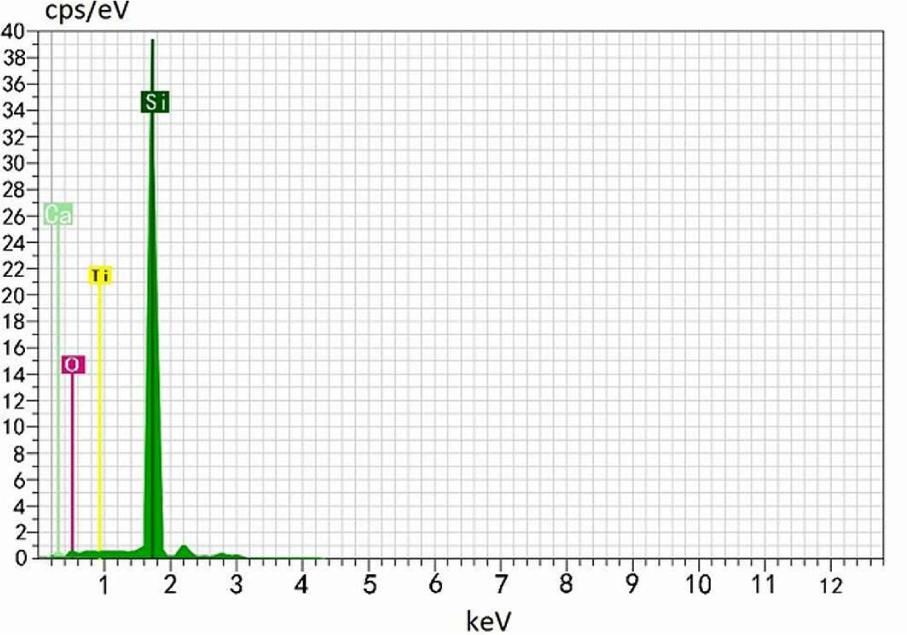
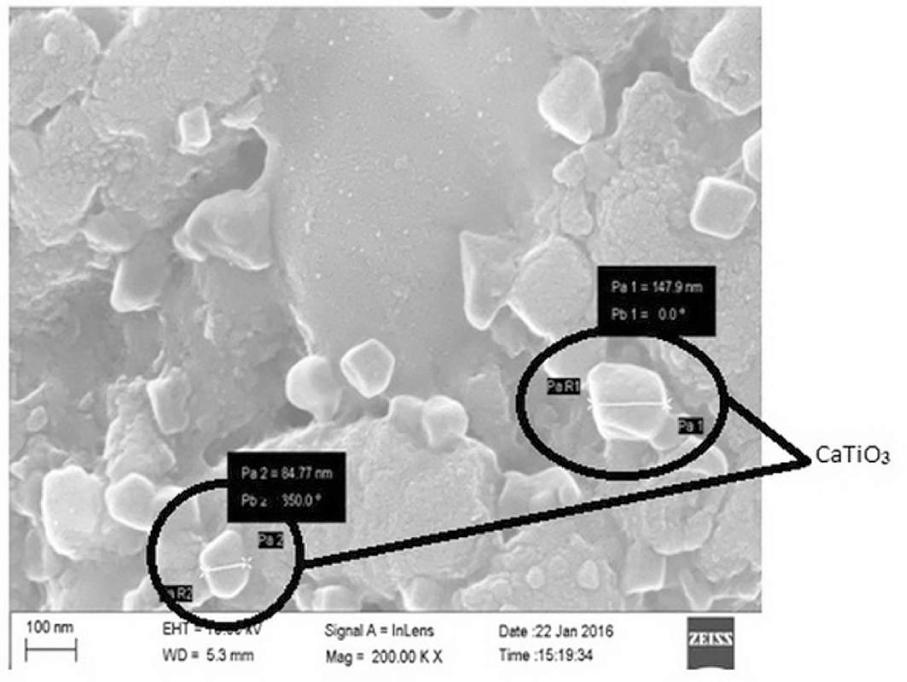
Amounts of Si, Ca, Ti and O elements on the substrate obtained through EDS analysis_
| Element | Atomic | Atomic concentration |
|---|---|---|
| number | [wt. %] | |
| Si | 14 | 46.19 |
| Ca | 20 | 17.23 |
| Ti | 22 | 20.66 |
| O | 8 | 15.93 |
| 100.00 |