
Table 1
Coded and uncoded values of levels for sintering temperature and time and its execution order.
| 3Y-PSZ sintered ceramics | Coded Levels | Uncoded Levels | ||
|---|---|---|---|---|
| Temperature | time | Temperature [°C] | time [h] | |
| VII | –1.41 | 0 | 1309 | 8 |
| XII | –1 | –1 | 1350 | 4 |
| X | –1 | 1 | 1350 | 12 |
| VIII | 0 | –1.41 | 1450 | 2.37 |
| VI | 0 | 0 | 1450 | 8 |
| II | 0 | 0 | 1450 | 8 |
| XI | 0 | 0 | 1450 | 8 |
| III | 0 | 1.41 | 1450 | 13.64 |
| IX | 1 | –1 | 1550 | 4 |
| IV | 1 | 1 | 1550 | 12 |
| V | 1.41 | 0 | 1591 | 8 |
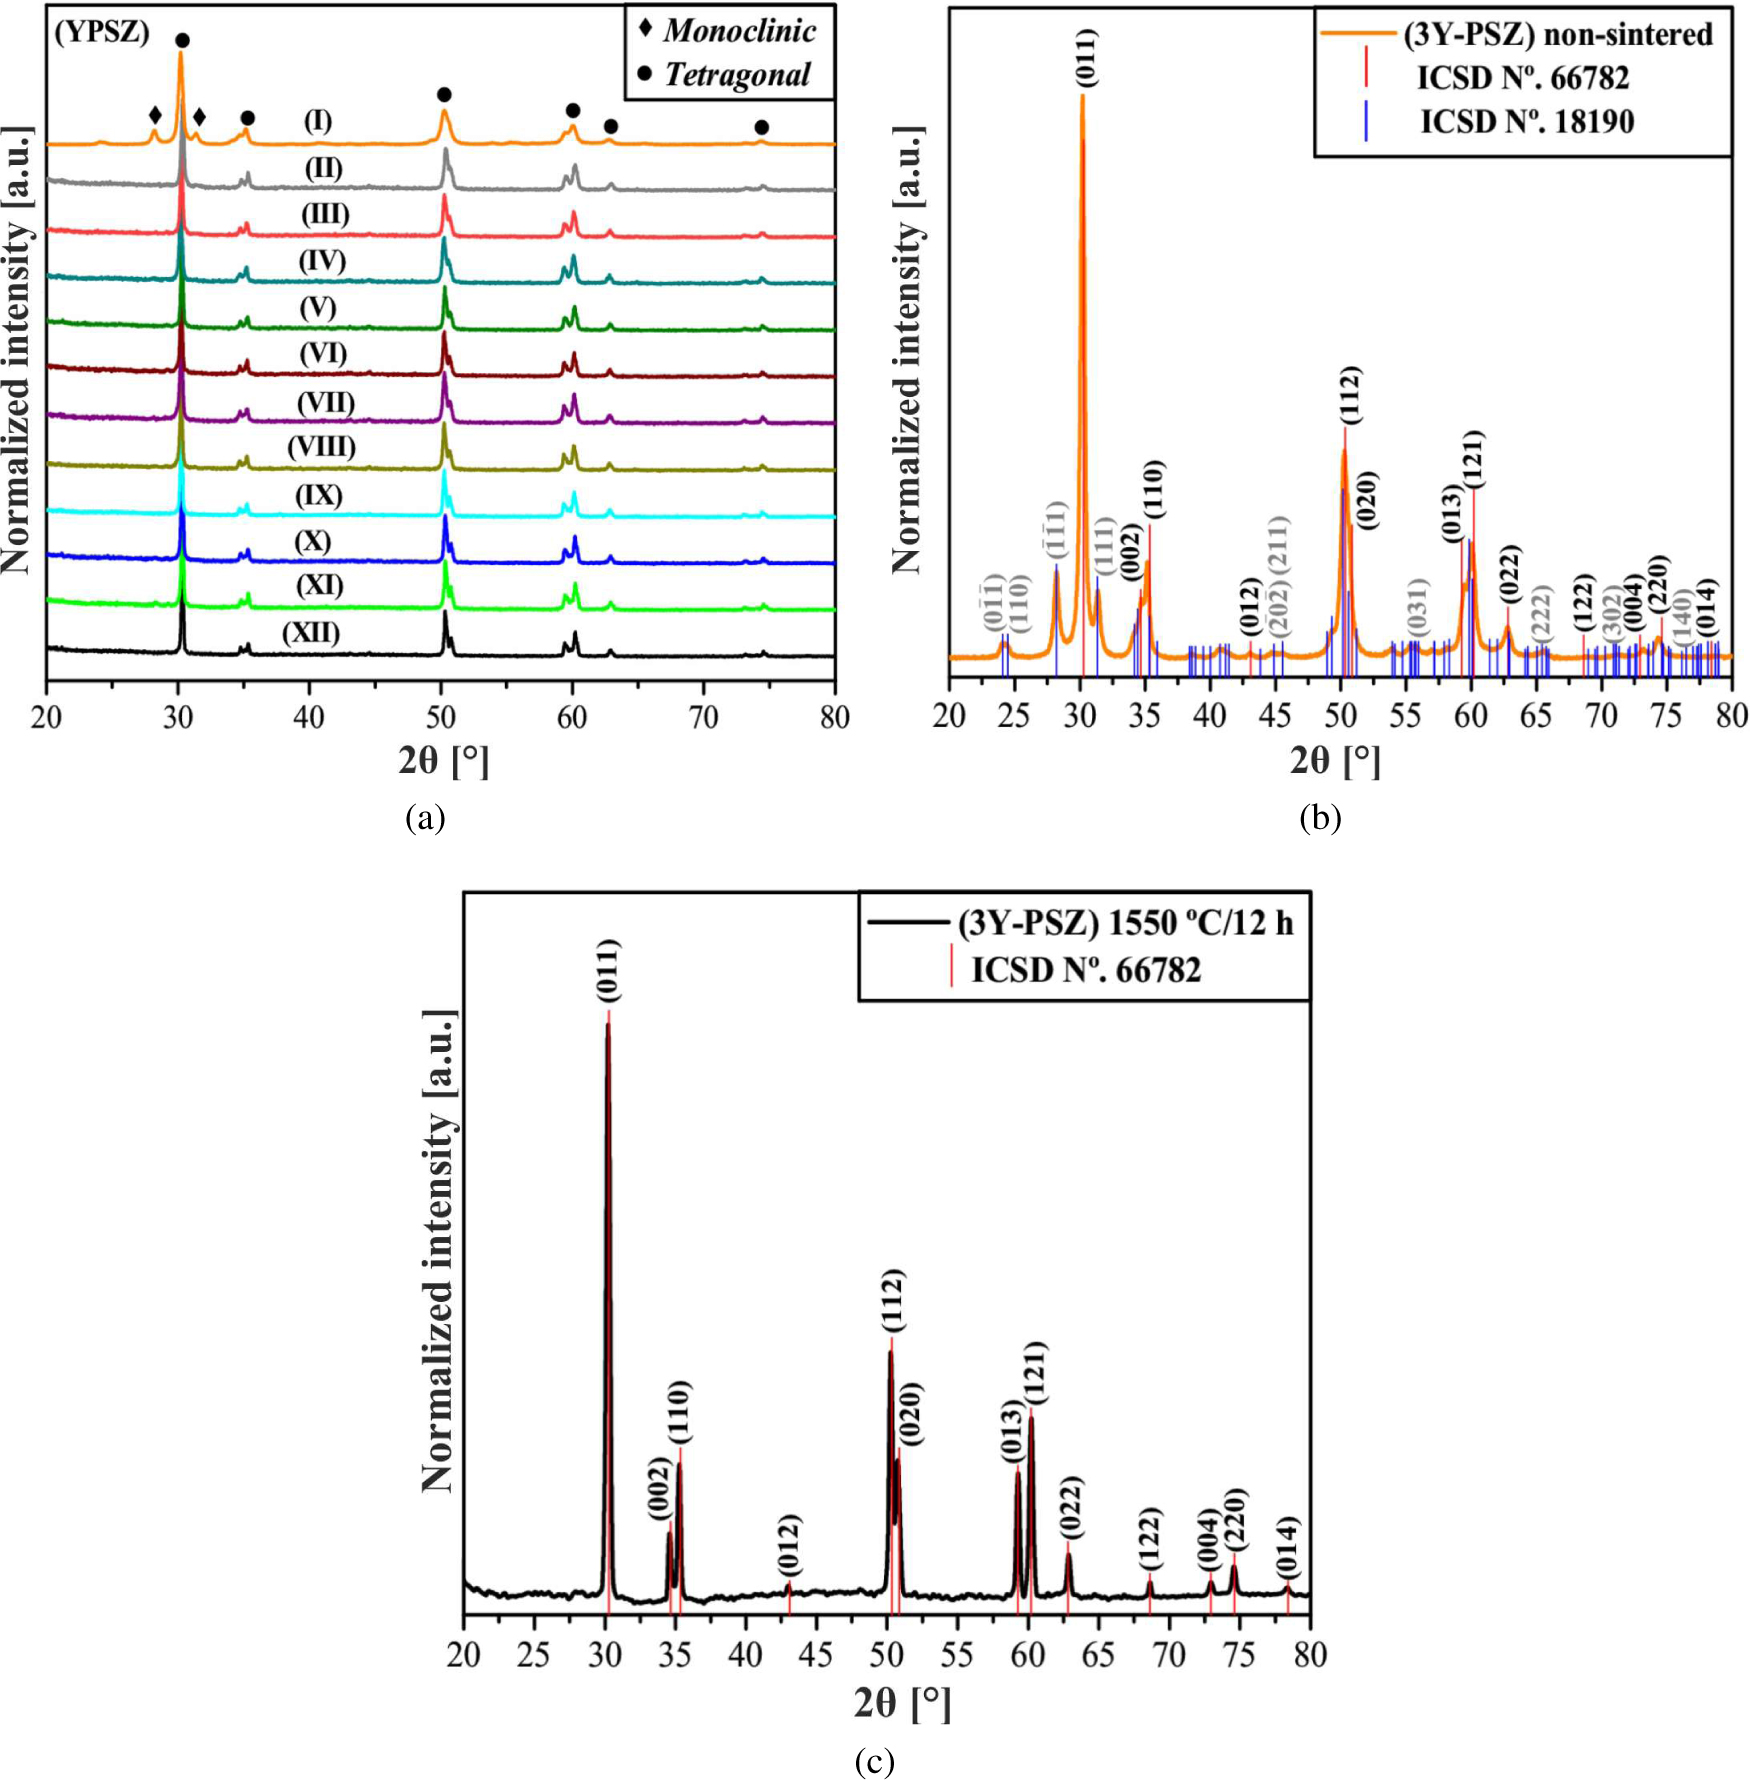
(a) XRD patterns of 3Y-PSZ non-sintered ceramics (I) and 3Y-PSZ ceramics sintered at different temperatures (II to XII) and times, (b) Indexed monoclinic and tetragonal phases in XRD patterns of 3Y-PSZ ceramics. The vertical lines indicate the relative positions of the diffraction peaks described in ICSD No. 66782 and No. 18190 and (c) Indexed tetragonal phase XRD patterns for 3Y-PSZ ceramics sintered at 1550 °C for 12 h, respectively.
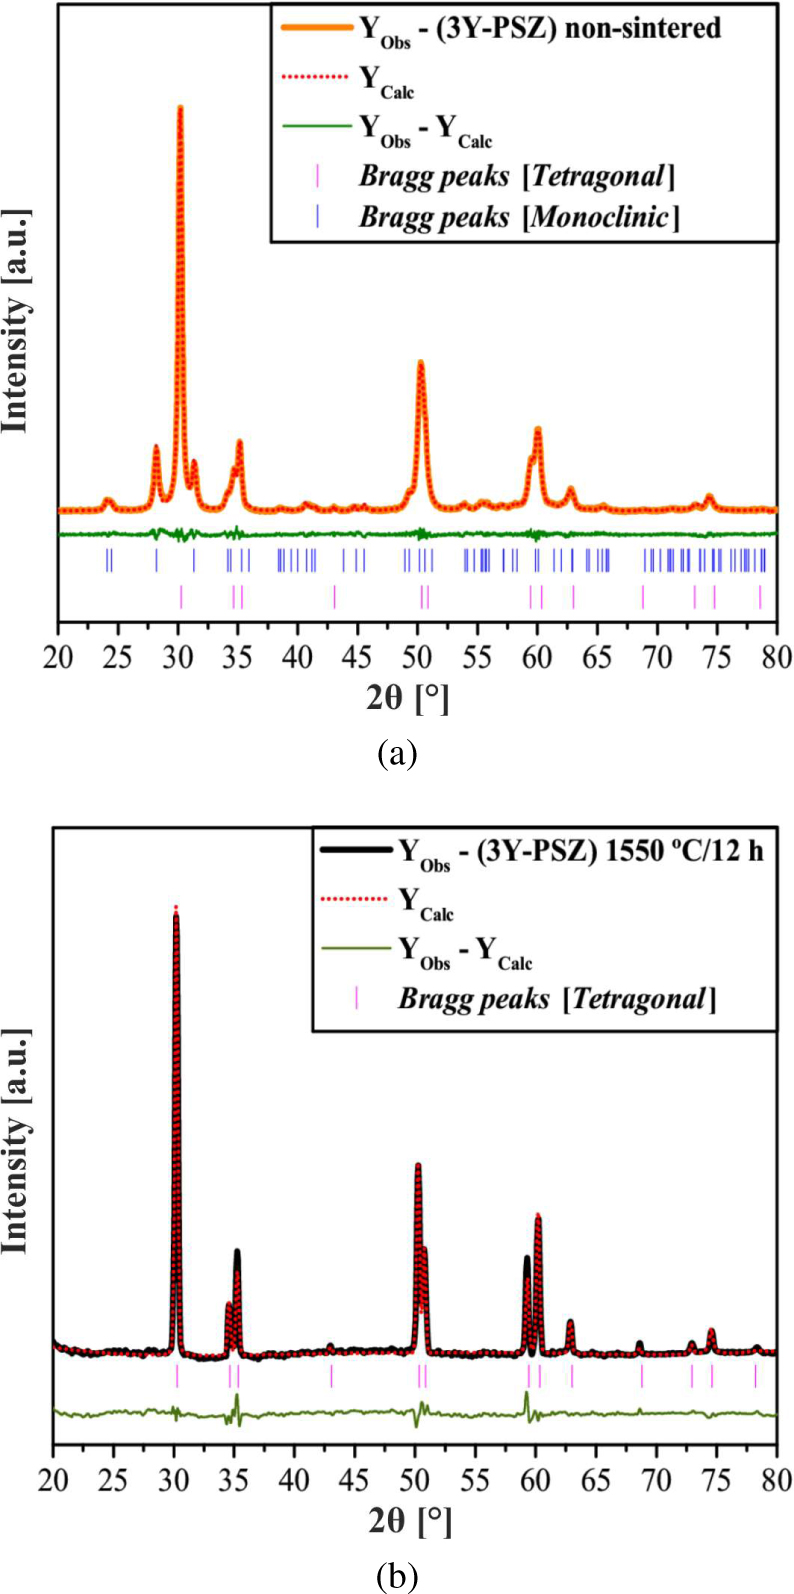
(a) Rietveld refinement plot of 3Y-PSZ non-sintered ceramics and (b) 3Y-PSZ ceramics sintered at 1550 °C for 12 h.
Table 2
Rietveld refinement results for 3Y-PSZ non-sintered ceramics and ceramics sintered at 1550 °C for 12 h.
| Atoms | Wyckoff | Site | x | y | z |
|---|---|---|---|---|---|
| Zr | 4e | 1 | 0.26977 | 0.03542 | 0.21178 |
| O1 | 4e | 1 | 0.07287 | 0.34262 | 0.35167 |
| O2 | 4e | 1 | 0.43843 | 0.76134 | 0.48151 |
| Zr | 2a | –4m2 | 0.75 | 0.25 | 0.25 |
| O1 | 4d | 2mm. | 0.25 | 0.25 | 0.46829 |
| [Phase 1: ZrO2; P21/c (14) – Monoclinic (a = 5.18449(8), b = 5.21618(4) Å, c = 5.32812(7) Å; V = V=142.22(3) Å3; β = 99.23(8)° and Z = 4)] and [Phase 2: ZrO2; P42/nmc (137) – Tetragonal (a = b = 3.5792 Å, c = 5.1782 Å; c/a = 1, V = 66.34 Å3; Z = 2]; Rp = 6.785 %; Rwp = 11.835 %; Rexp = 6.218 %; χ2 = 3.6214 and GoF = 1.903. Weights of the phases in the ZrO2 Monoclinic = 49.17 % and ZrO2 Tetragonal = 50.83 %. | |||||
| Zr | 2a | – 4m2 | 0.75 | 0.25 | 0.25 |
| O1 | 4d | 2mm. | 0.25 | 0.25 | 0.44896 |
| [Monophasic for ZrO2; P42/nmc (137) – Tetragonal (a = b = 3.5578(6) Å, c = 5.1559(1) Å; V = 65.26(2) Å3; Z = 2); Rp = 5.231 %; Rwp = 10.124 %; Rexp = 8.173 %; χ2 = 1.52364 and GoF = 1.238. | |||||
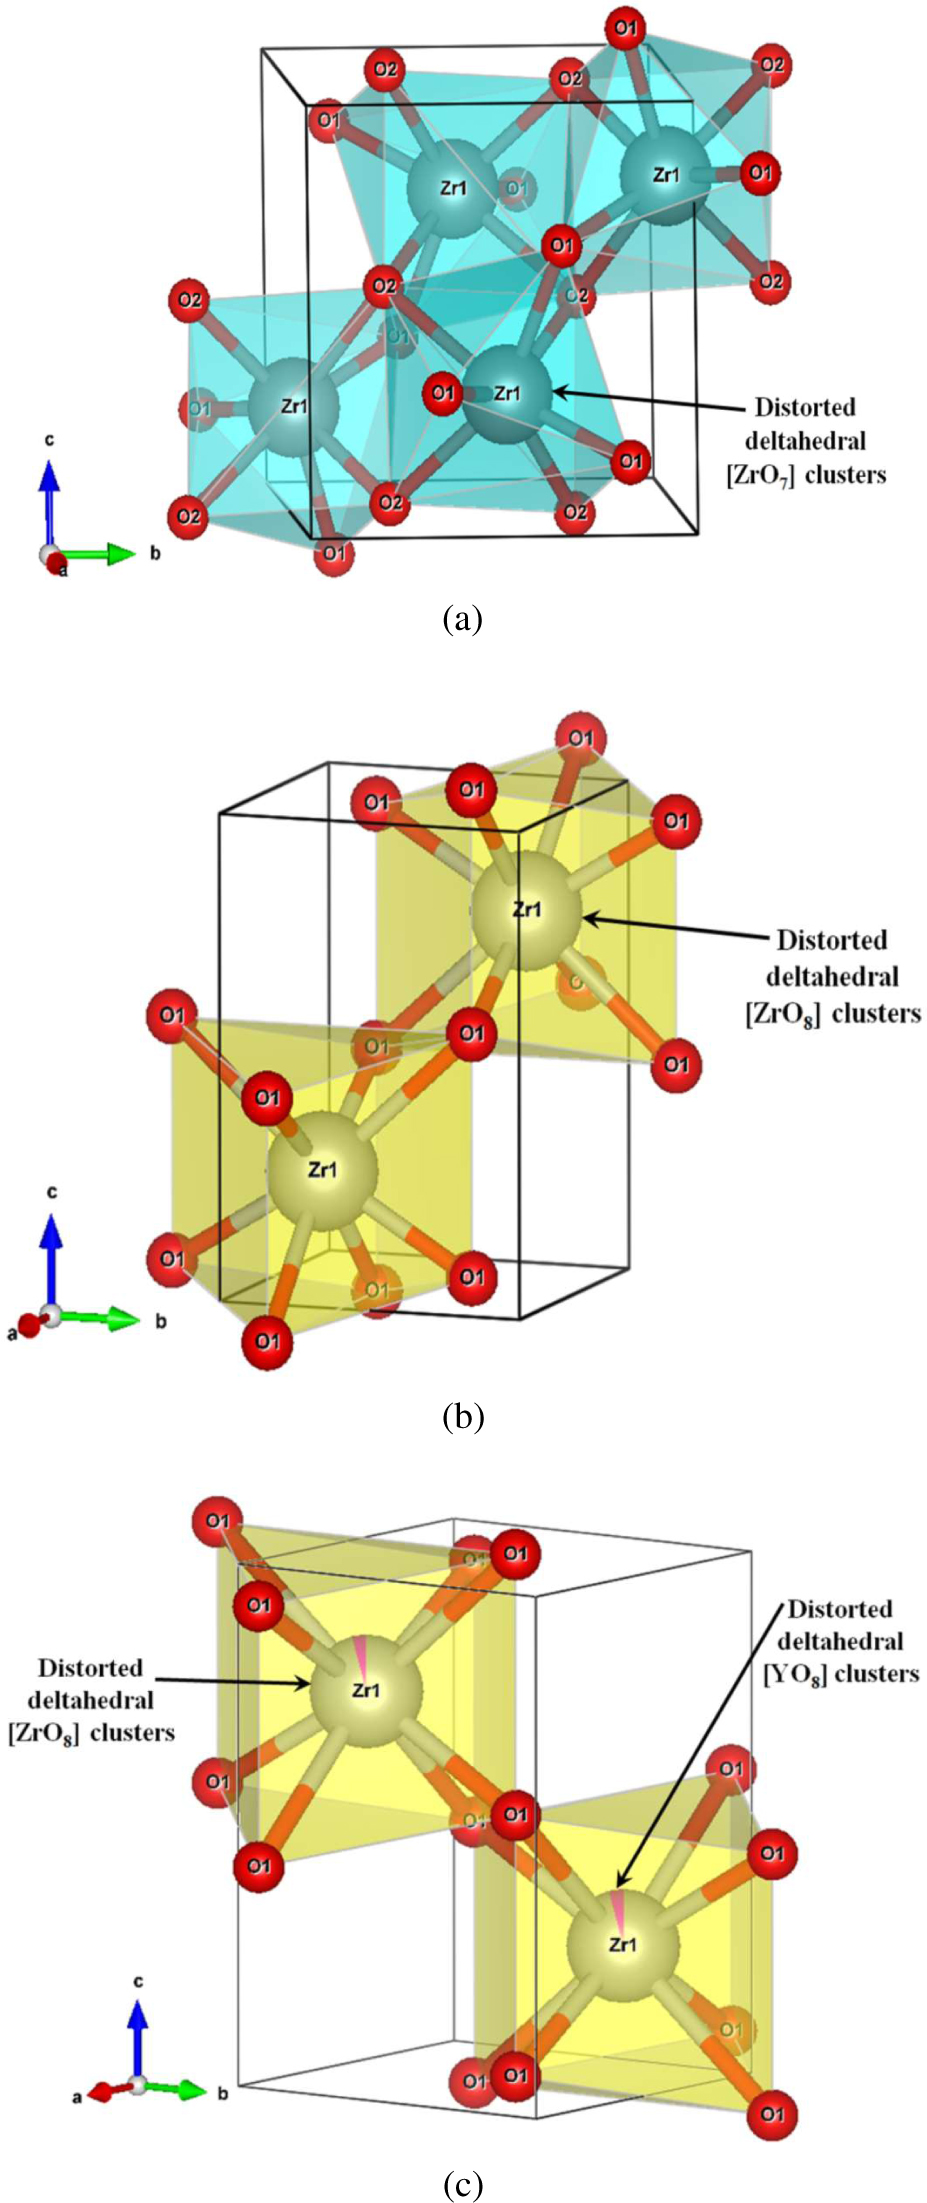
(a) Schematic representation of the monoclinic unit cells corresponding to ZrO2 crystal illustrating distorted deltahedral [ZrO7] clusters, (b) tetragonal unit cells corresponding to ZrO2 crystal illustrating distorted deltahedral [ZrO8] clusters and (c) tetragonal unit cells corresponding to ZrO2 crystals illustrating distorted deltahedral [ZrO8]/[YO8] clusters, respectively.
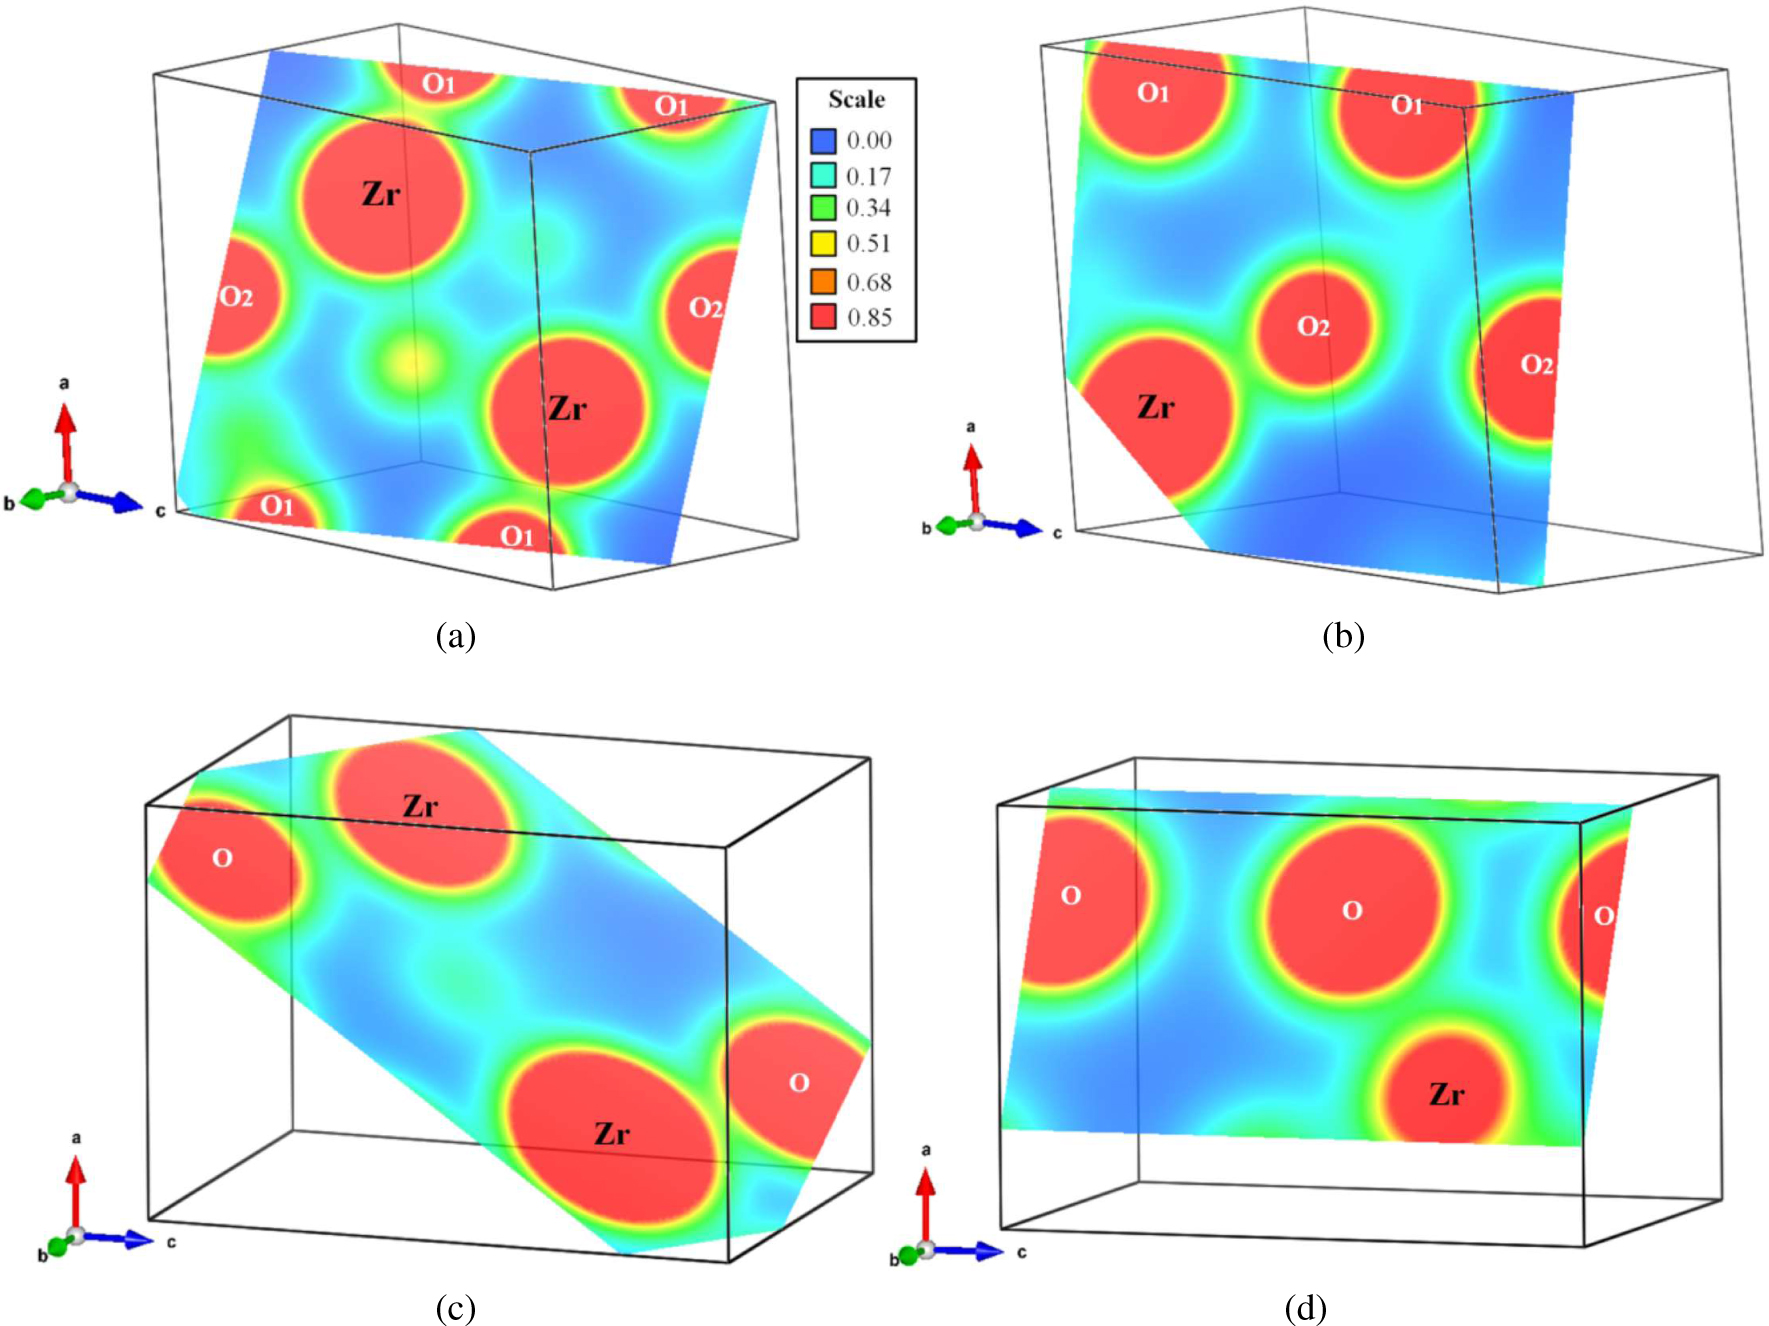
Electron density maps on: (a) (1 2 1), (b) (1 4 1), (c) (6 3 6) and (d) (1 2 0) planes of 3Y-PSZ non-sintered ceramics and ceramics sintered at 1550 °C for 12 h.
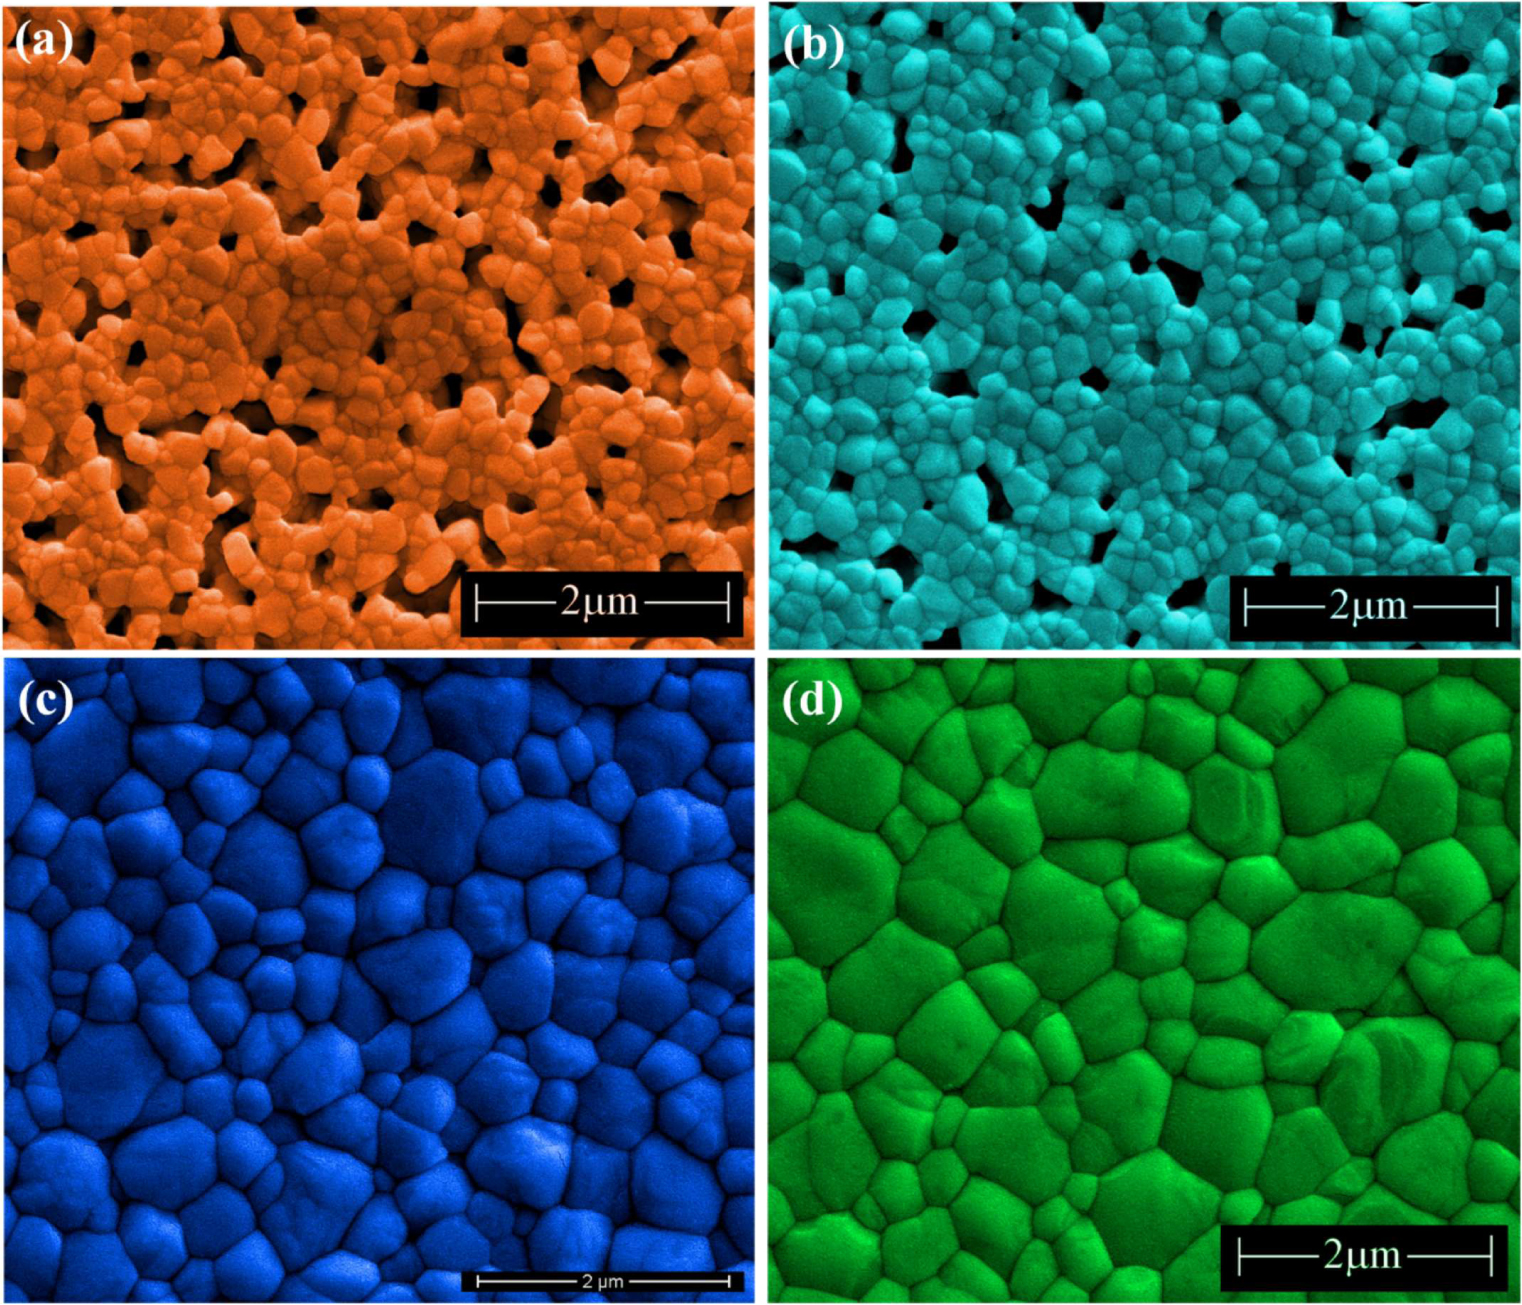
FE-SEM images for 3Y-PSZ ceramics sintered at: (a) 1350 °C for 4 h, (b) 1350 °C for 12 h, (c) 1550 °C for 4 h and (d) 1550 °C for 12 h.
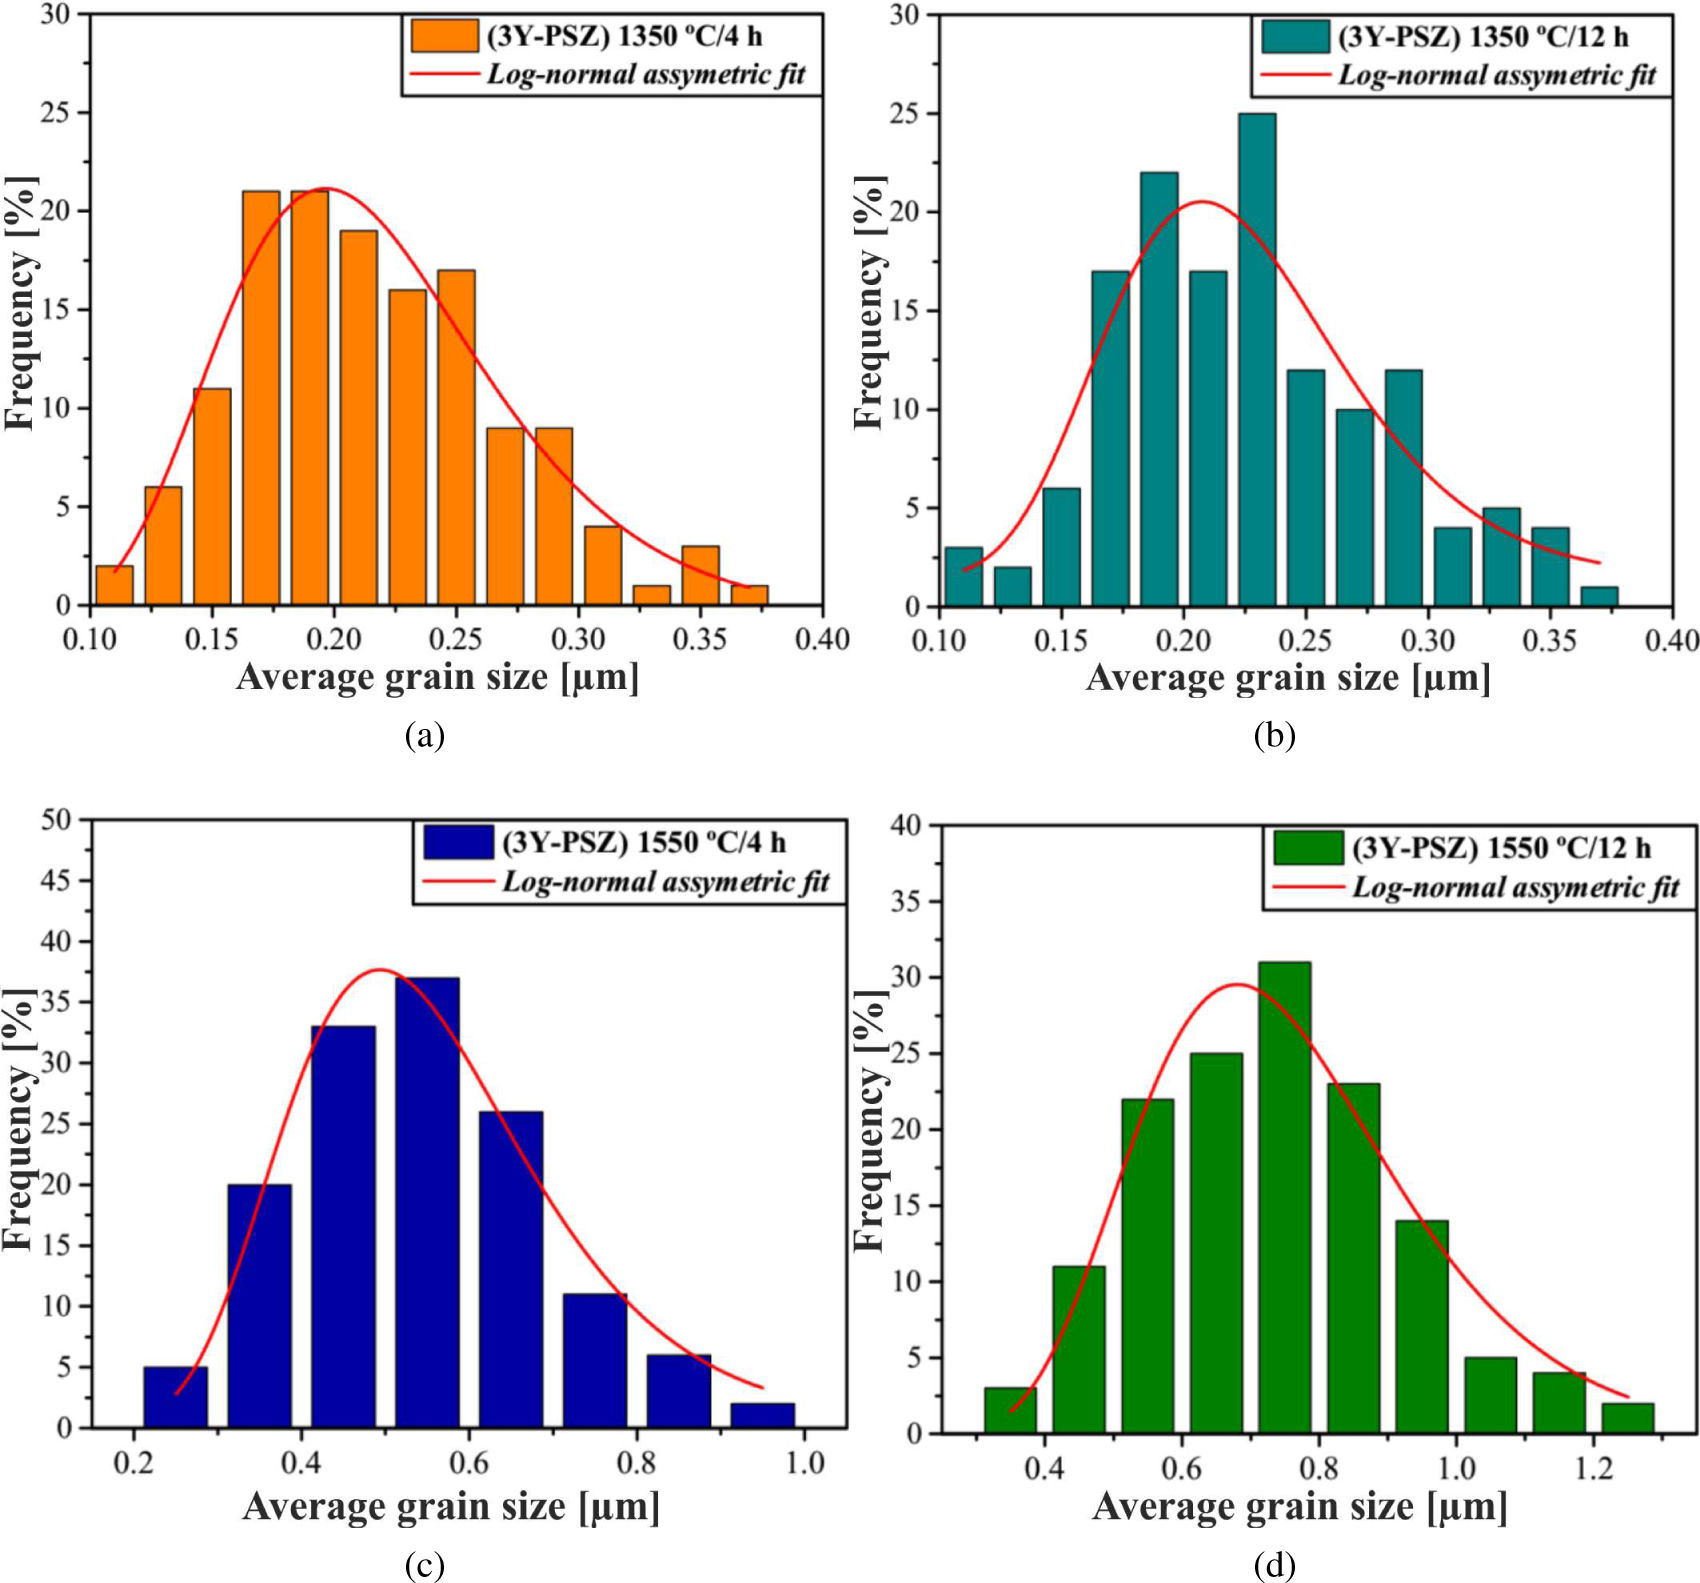
Average grain size distribution of 3Y-PSZ ceramics sintered at: (a) 1350 °C for 4 h, (b) 1350 °C for 12 h, (c) 1550 °C for 4 h and (d) 1550 °C for 12 h.
Table 3
Volumetric shrinkage (VS), average grain size (AGS) and Vickers hardness (VH) for all combinations of sintering temperature and times.
| 3Y-PSZ sintered ceramics | Measured values | ||
|---|---|---|---|
| VS [%] | AGS [μm] | VH [GPa] | |
| VII | 44.1±3.4 | 0.194±0.043 | 5.45±0.12 |
| XII | 40.6±5.4 | 0.216±0.053 | 6.05±0.22 |
| X | 45.0±5.8 | 0.228±0.057 | 7.49±0.42 |
| VIII | 50.2±5.9 | 0.276±0.074 | 11.3±0.18 |
| VI | 50.7±2.3 | 0.31±0.11 | 13.01±0.42 |
| II | 50.3±2.8 | 0.384±0.091 | 13.27±0.38 |
| XI | 50.2±2.9 | 0.377±0.096 | 13.06±0.41 |
| III | 53.1±5.2 | 0.454±0.085 | 13.71±0.12 |
| IX | 54.2±5.5 | 0.55±0.14 | 13.26±0.30 |
| IV | 54.8±4.2 | 0.75±0.19 | 12.52±0.32 |
| V | 54.8±1.7 | 0.54±0.18 | 13.24±0.16 |
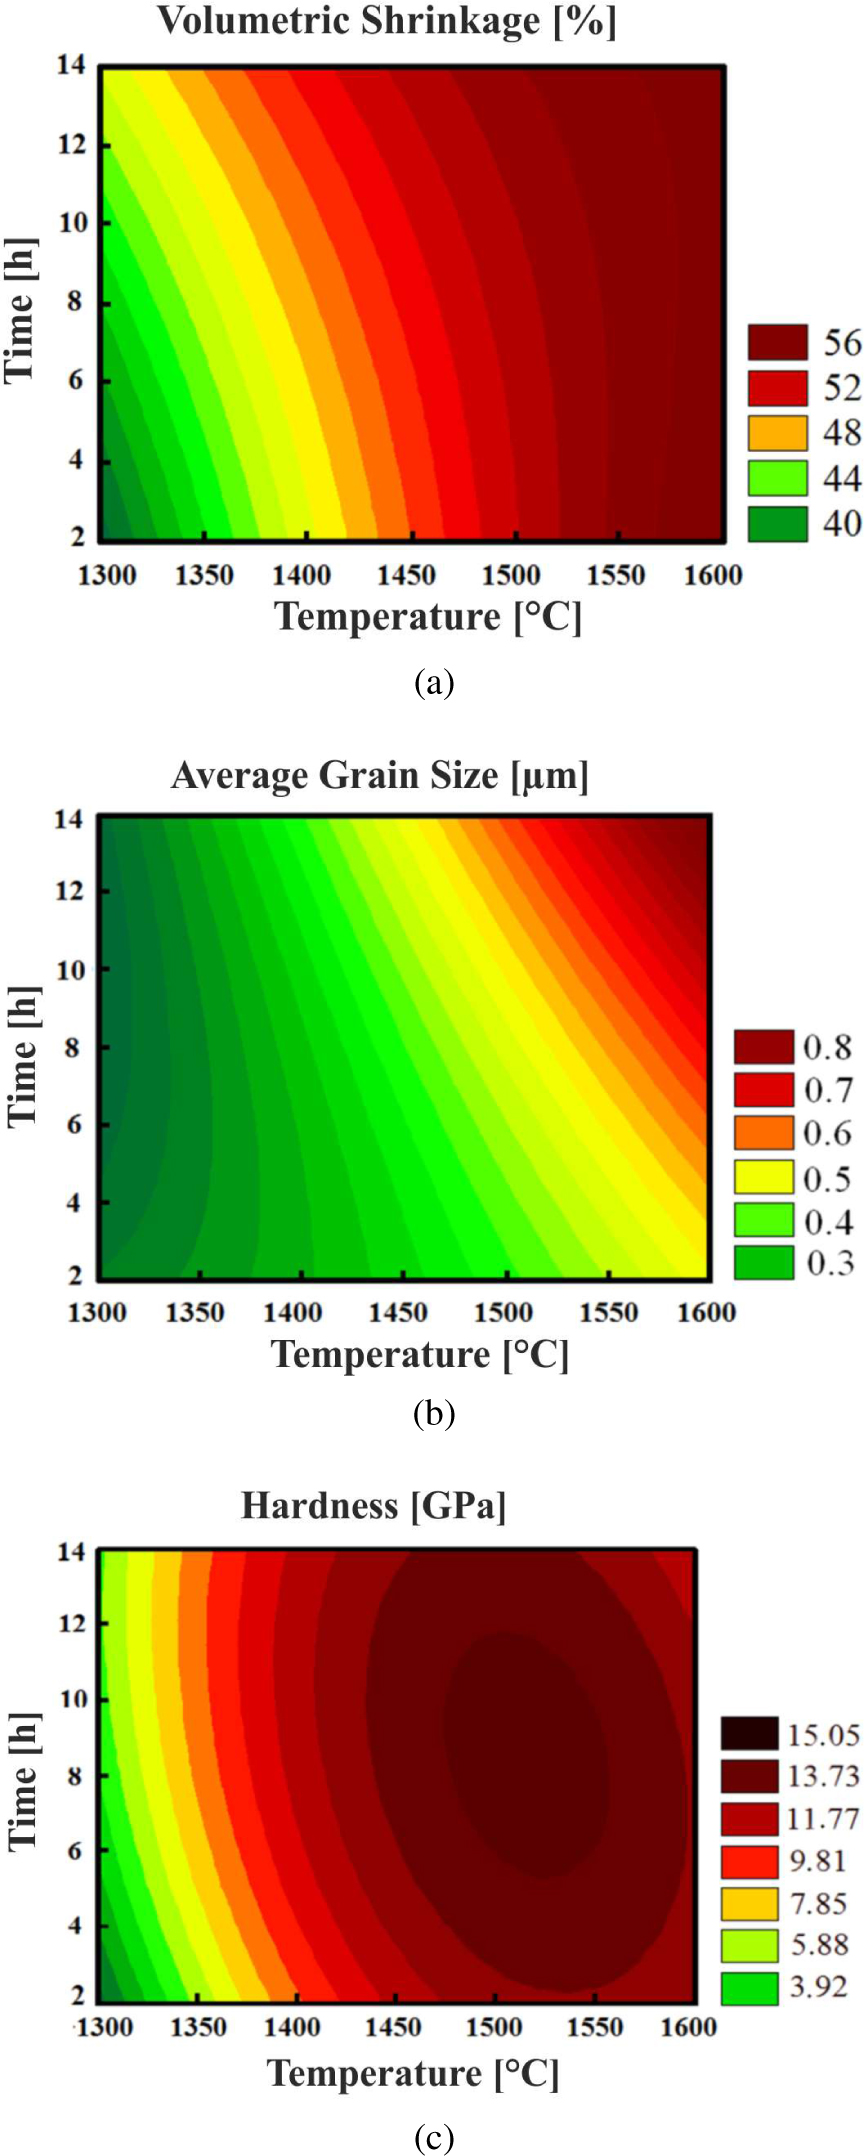
Response surfaces of 3Y-PSZ ceramics sintered at different temperatures and times for: (a) volumetric shrinkage, (b) average grain size and (c) hardness.