Have a personal or library account? Click to login
The impact of phase state of guest histidine on properties and practical applications of nanohybrids on InSe and GaSe basis Cover

The impact of phase state of guest histidine on properties and practical applications of nanohybrids on InSe and GaSe basis

Open Access
|Apr 2017

Figures & Tables

Nyquist diagrams of the original expanded GaSe matrix (1), and nanostructure of GaSe ‹his›(2) with the respective equivalent circuit diagrams [10]. Equivalent circuit diagrams are shown in the insets (a) and (b) on the righthand side of the figure.
Pulse generation in bio/nonorganic N-barrier GaSe ‹his› nanostructure
Nyquist diagrams (a) and CVC (b), measured perpendicular to the nanolayers of GaSe ‹his + H2O› (1) and GaSe ‹his + H2O + KOH› (2). Galvanostatic charge-discharge cycles of GaSe ‹his + H2O + KOH› at the current of 1 µA (3) and 10 µA (4) are shown in the inset.
Nyquist diagrams (a) and CVC (b), measured along the nanolayers of GaSe ‹his + H2O› (1) and GaSe ‹his + H2O + KOH› (2).
Nyquist diagrams of the original expanded GaSe matrix (1) and GaSe ‹his› nanostructure (2).
Nyquist diagrams (a) and CVC (b), measured perpendicular to the nanolayers of InSe ‹his + H2O› (1) and InSe ‹his + H2O + KOH› (2). Galvanostatic charge-discharge cycle at 1 µA current (top left corner), tangent of loss angle and dielectric constant (bottom right corner) of InSe ‹his + H2O + KOH› are shown in the insets to Fig. 6b.
Nyquist diagrams (a) and CVC (b), measured along the nanolayers for InSe ‹his + H2O› (1) and InSe ‹his + H2O + KOH› (2).

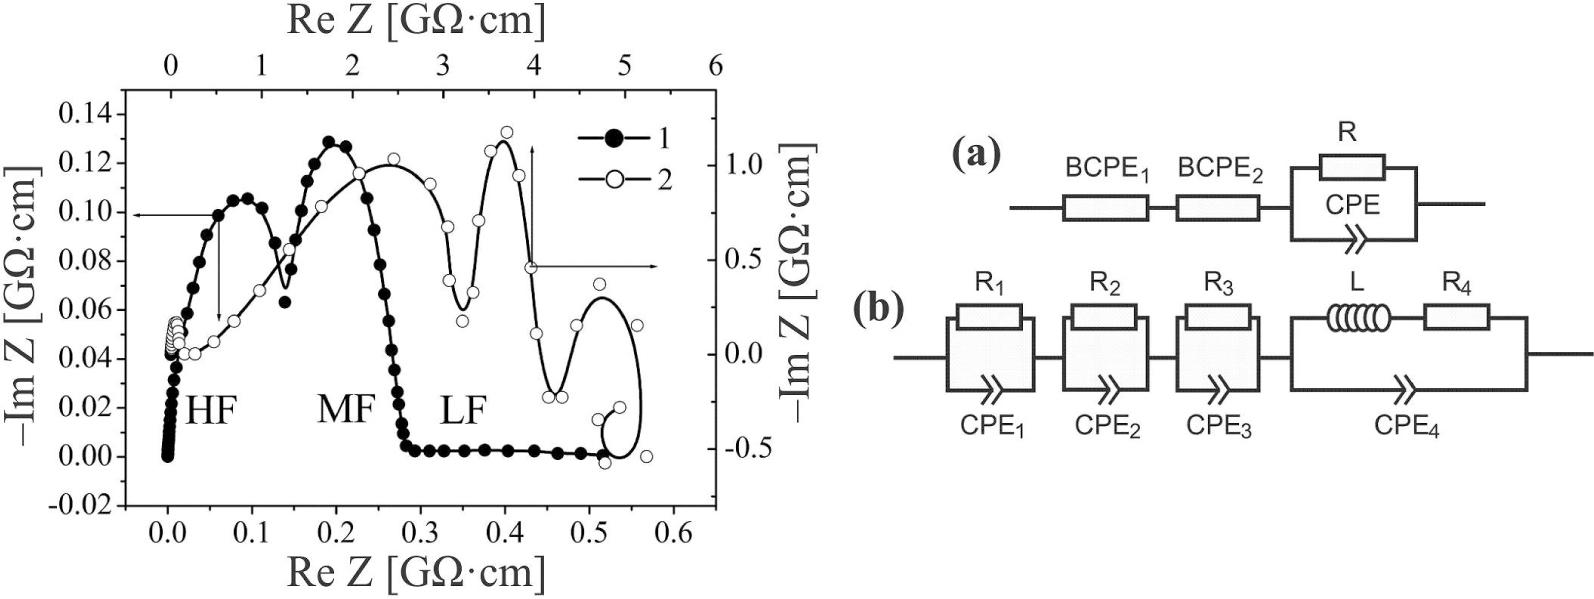
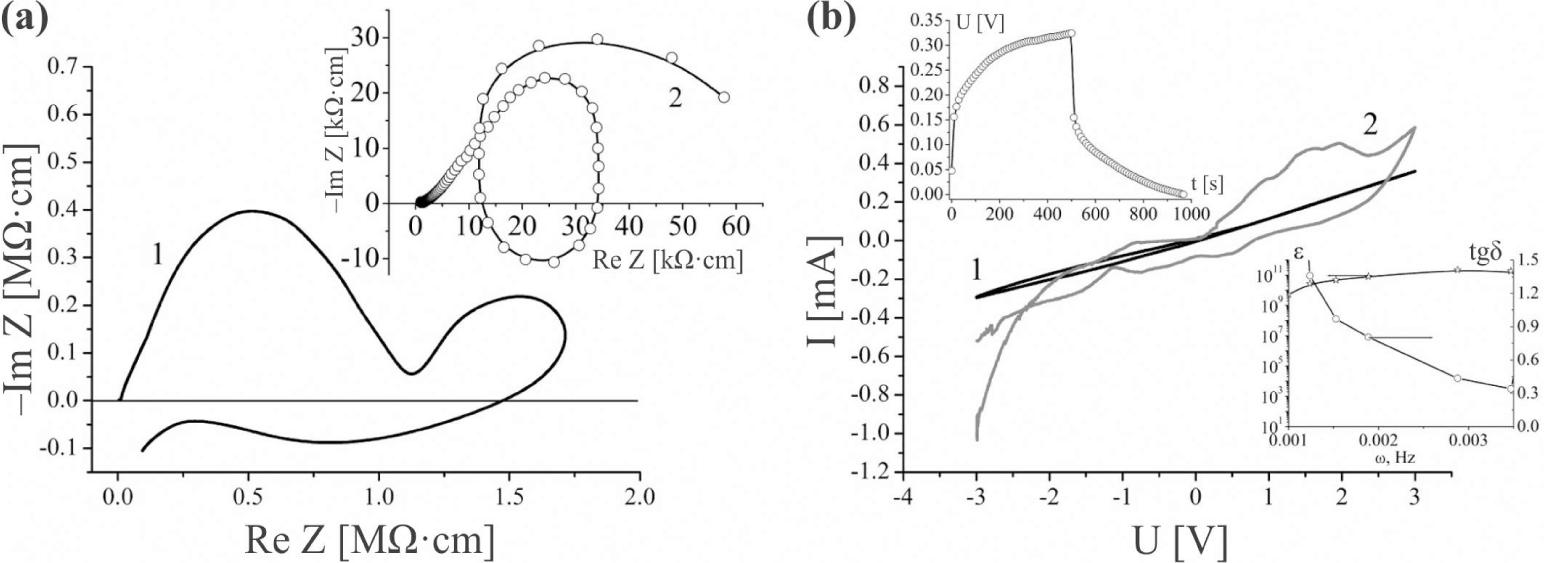
Parameters of the model (b)_

ElementR1CPE1R2CPE2R3CPE3LR4CPE4
of the model[Ω][F][Ω][F][Ω][F][H][Ω][F]
Value6.57E72.93E-142.96E84.79E-128.77E81.73E-84.63E33.04E91.17E-10

Parameters of the model (a)_

ElementBCPE1BCPE2RCPE
of the model[Ω][Ω][Ω][F]
Value2.15E81.01E81.73E84.47E-12
DOI: https://doi.org/10.1515/msp-2017-0019 | Journal eISSN: 2083-134X | Journal ISSN: 2083-1331
Language: English
Page range: 239 - 245
Submitted on: Jun 22, 2016
Accepted on: Dec 23, 2016
Published on: Apr 29, 2017
Published by: Wroclaw University of Science and Technology
In partnership with: Paradigm Publishing Services
Publication frequency: 4 issues per year

© 2017 F.O. Ivashchyshyn, I.I. Grygorchak, O.V. Balaban, B.O. Seredyuk, published by Wroclaw University of Science and Technology
This work is licensed under the Creative Commons Attribution-NonCommercial-NoDerivatives 3.0 License.