
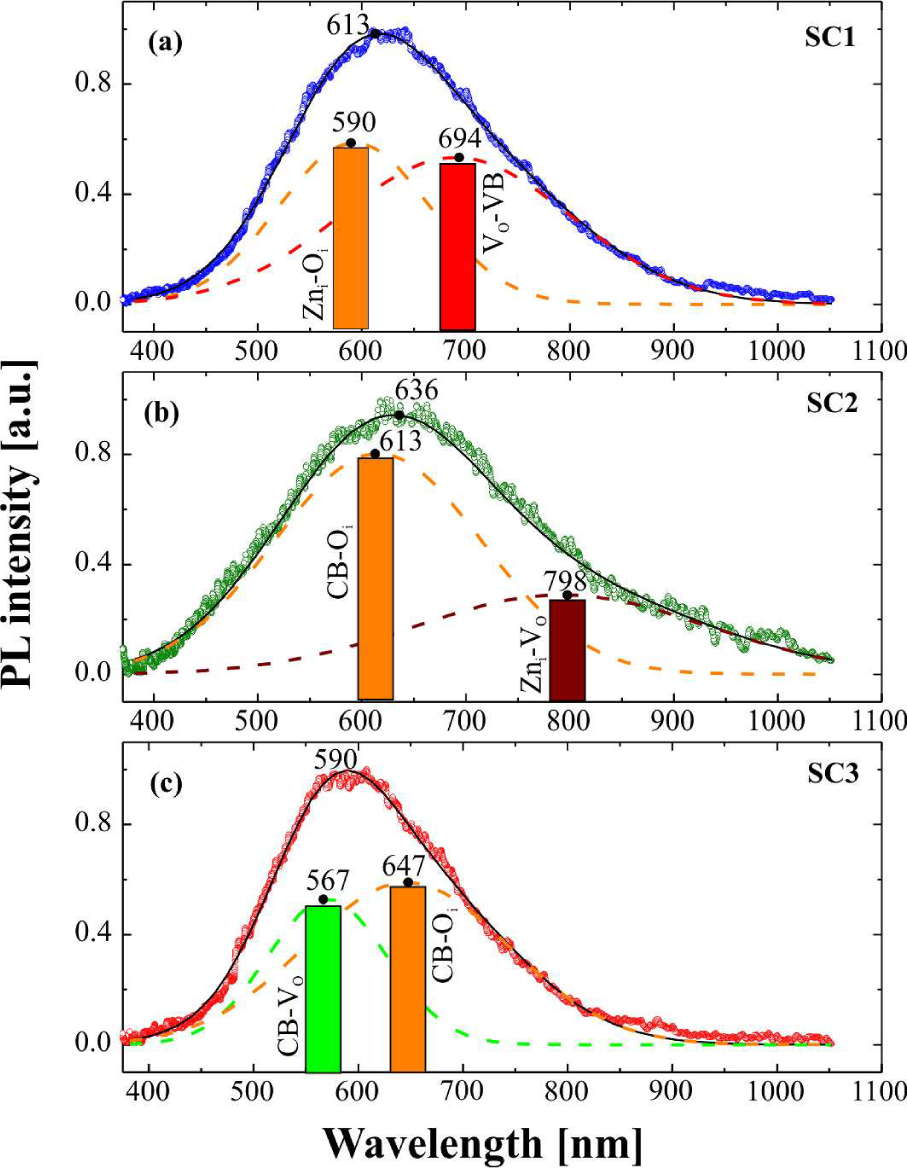
PL spectra (points) and decomposed spectral bands (dashed) in sonochemically synthesized SC1, SC2 and SC3 samples. Solid line presents the sum of the two dashed spectral shapes.
Table 1
Decomposed band parameters and peak attribution for the PL spectra given in Fig. 1.
| Sample | Peak position of the decomposed band [nm] | Type of transition responsible for the band | Intensity of the decomposed band normalized to the maximum peak value | Literature |
|---|---|---|---|---|
| SC1 | 589 | Zni → Oi (CB-Oi) | 0.58 | [30–33] |
| 693 | Vo → VB | 0.53 | [31, 34] | |
| SC2 | 612 | CB → Oi (Zni-Oi) | 0.80 | [31, 33, 35] |
| 797 | Zni → Vo (CB → Vo) | 0.28 | [30, 34] | |
| SC3 | 566 | CB → Vo (Zni-Vo) | 0.52 | [36–39] |
| 647 | CB → Oi | 0.59 | [10, 31] |
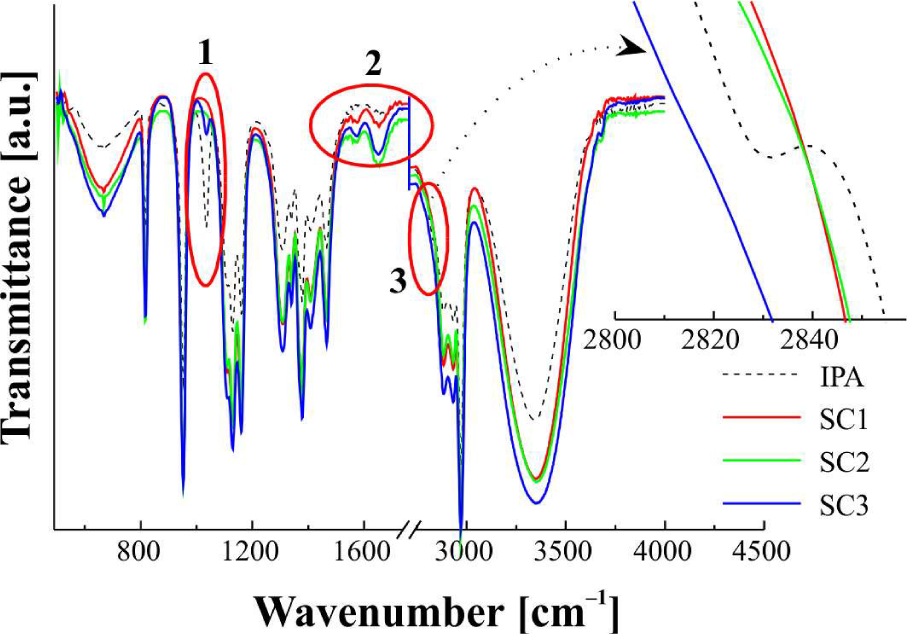
FT-IR transmission spectra of sonochemically fabricated ZnO powders dissolved in IPA.
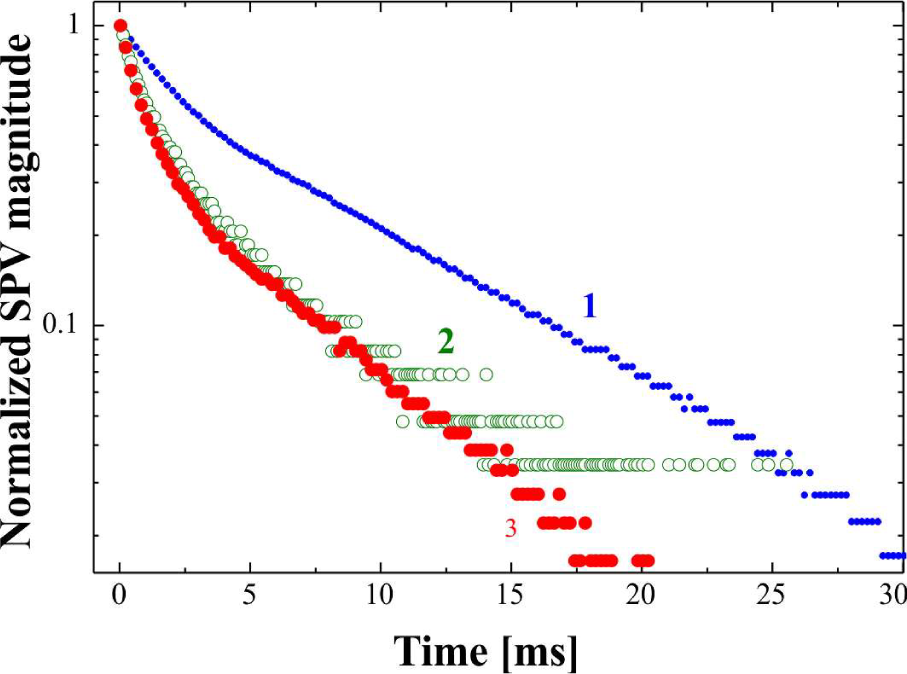
SPV decays of sonochemically synthesized SC1 (1), SC2 (2) and SC3 (3) samples.
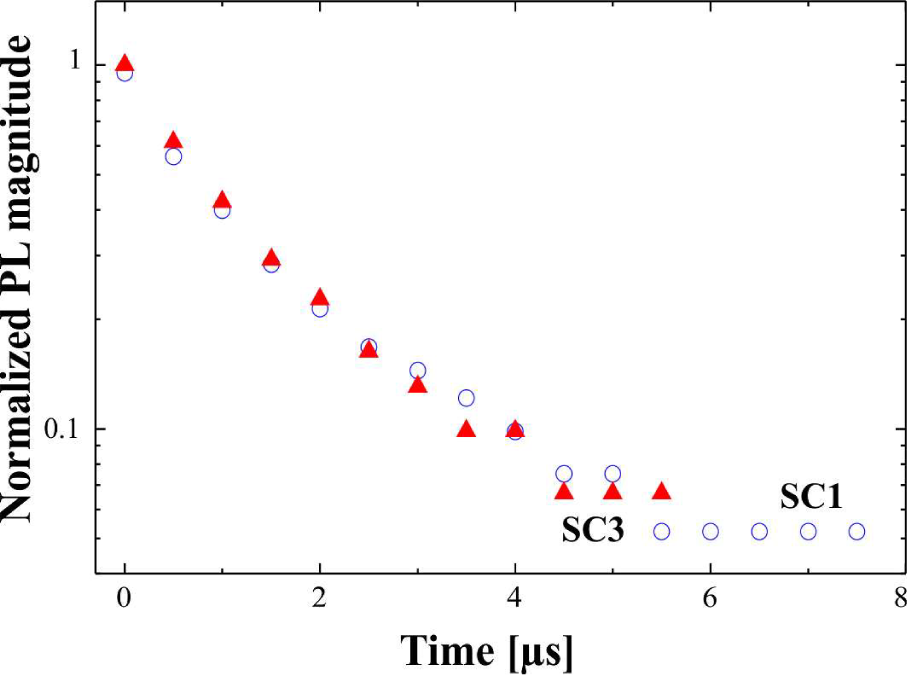
Time resolved PL decays of SC1 (circles) and SC3 (triangles) samples.