
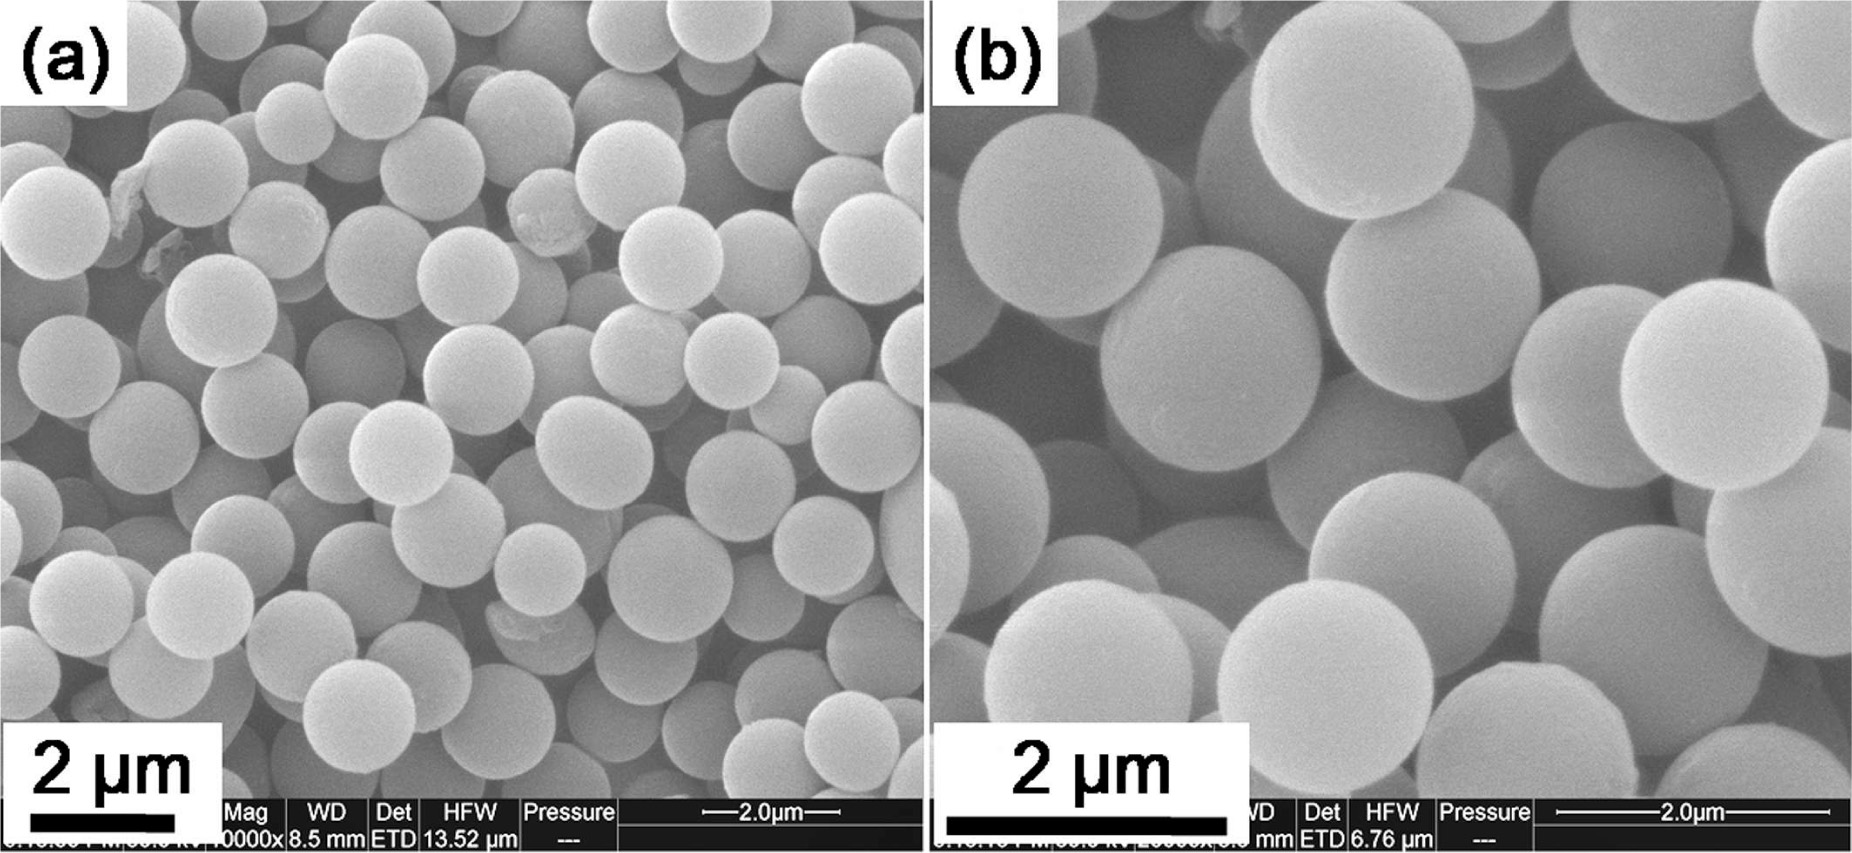
FE-SEM images of the template carbon spheres.
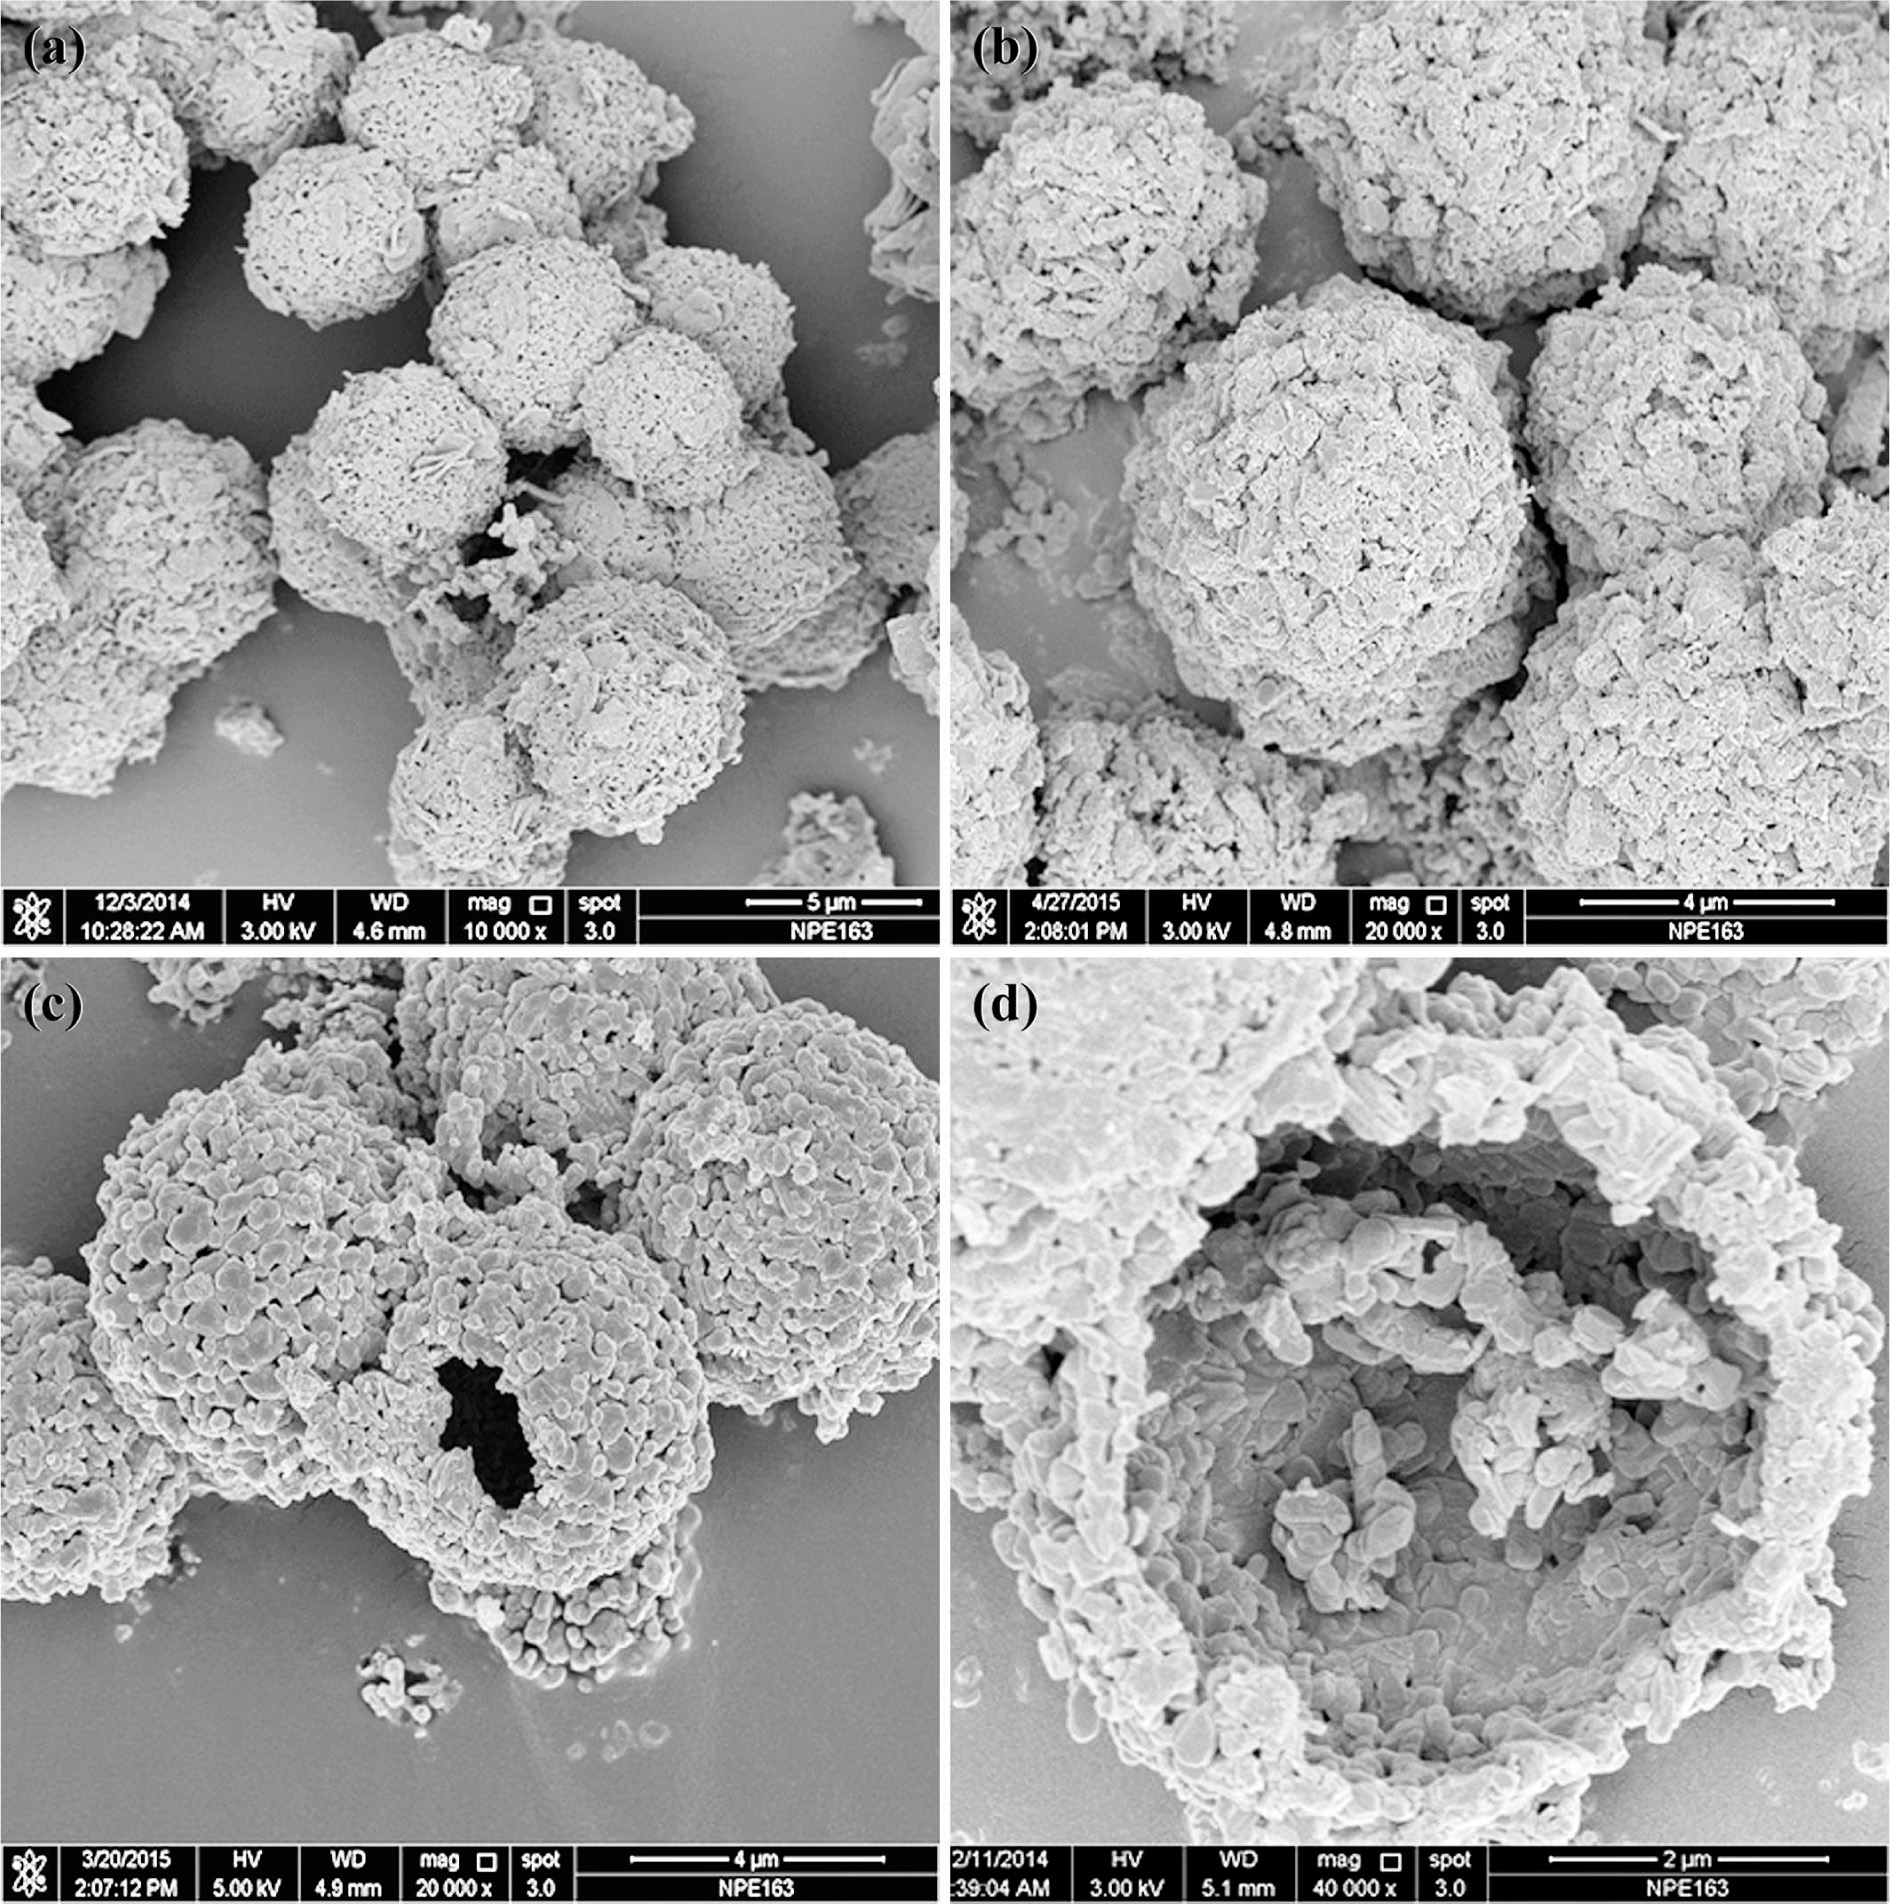
FE-SEM images of the as-obtained sample.
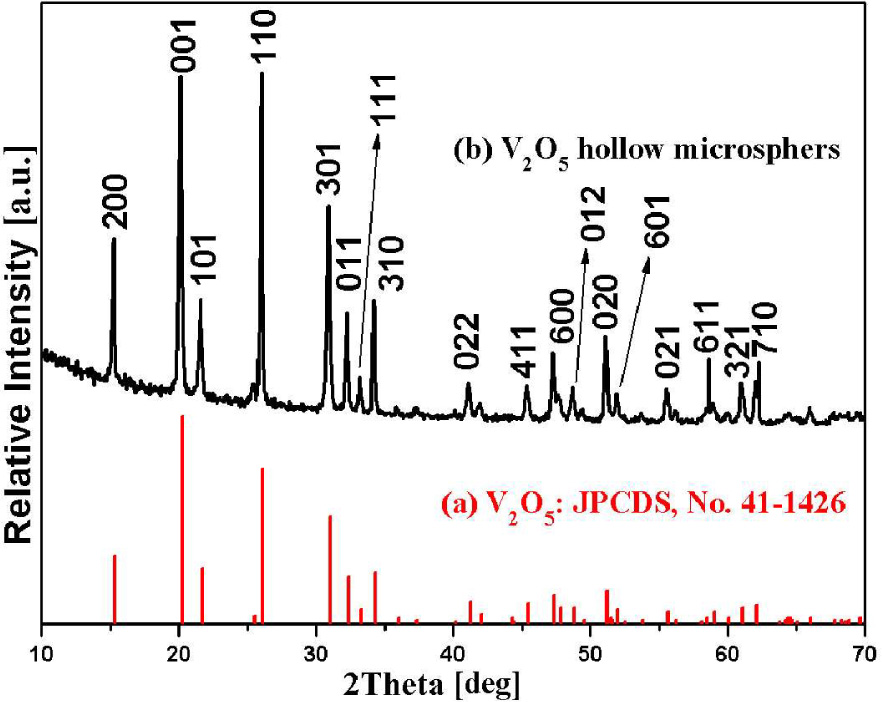
XRD patterns of the as-obtained hollow microspheres.
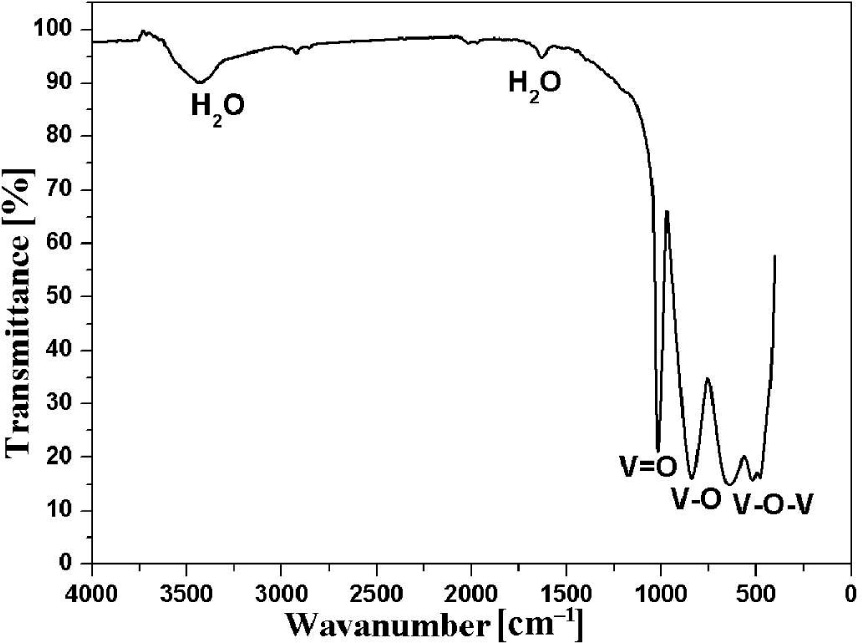
IR spectrum of the as-obtained HVOM.
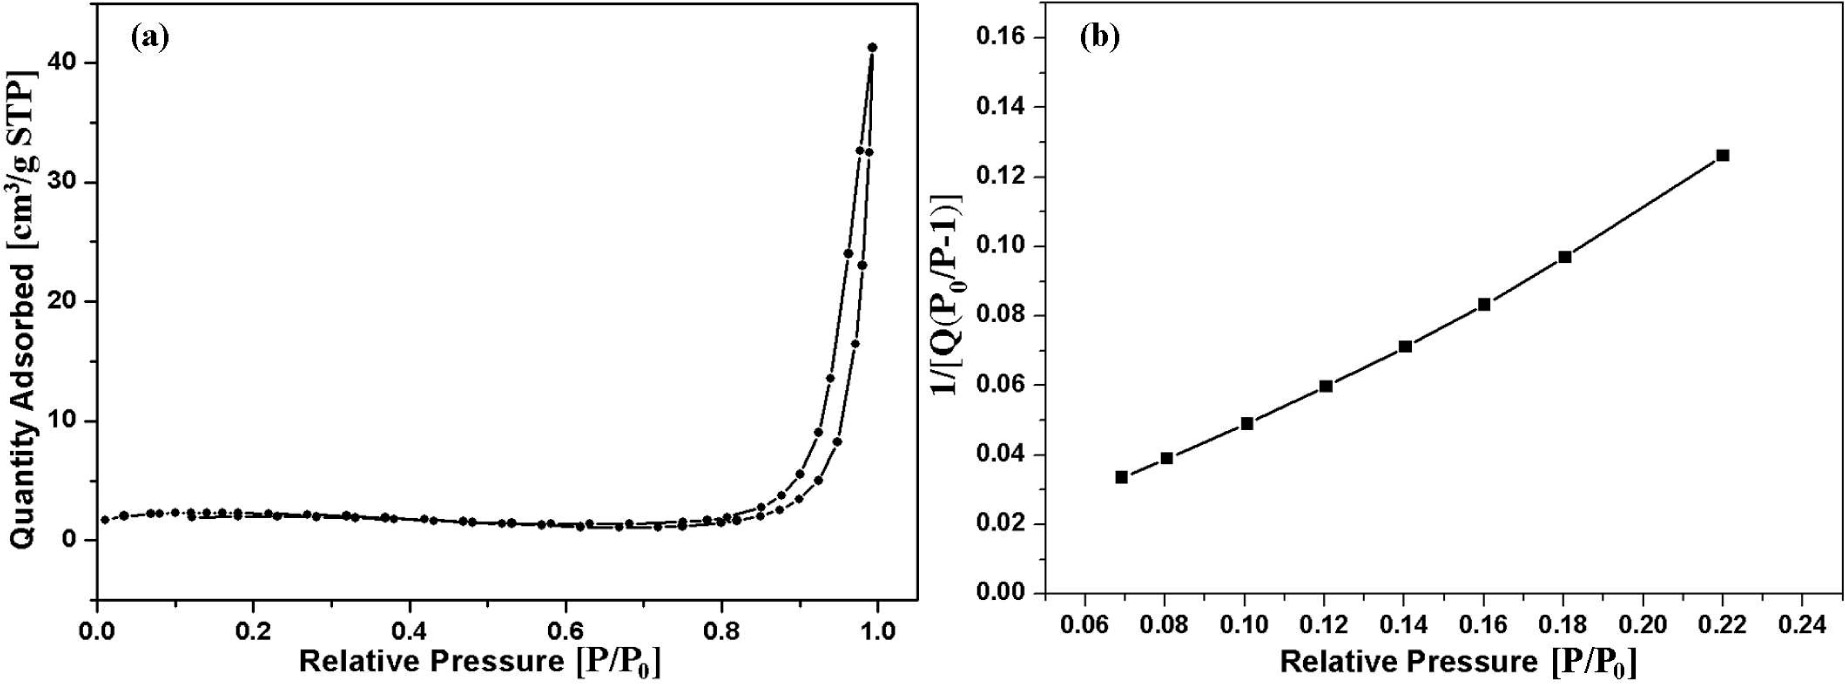
(a) Nitrogen adsorption-desorption isotherms and (b) BET curve of the as-obtained HVOM.
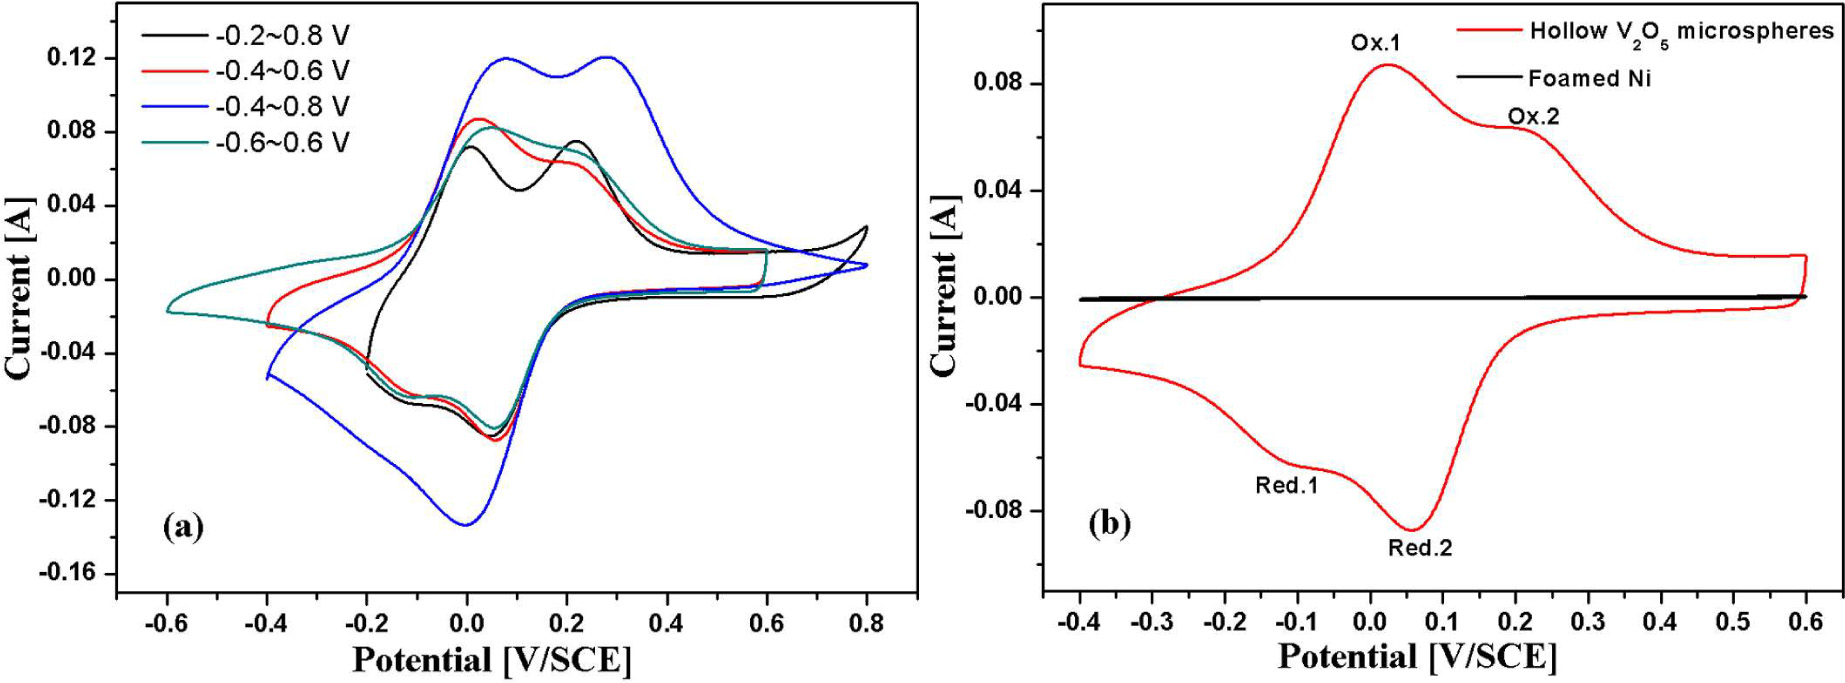
CV curves of HVOM in 1 mol·dm–3 LiNO3 at a scan rate 20 mV·s–1: (a) on various potential limits; (b) compared with foamed Ni.
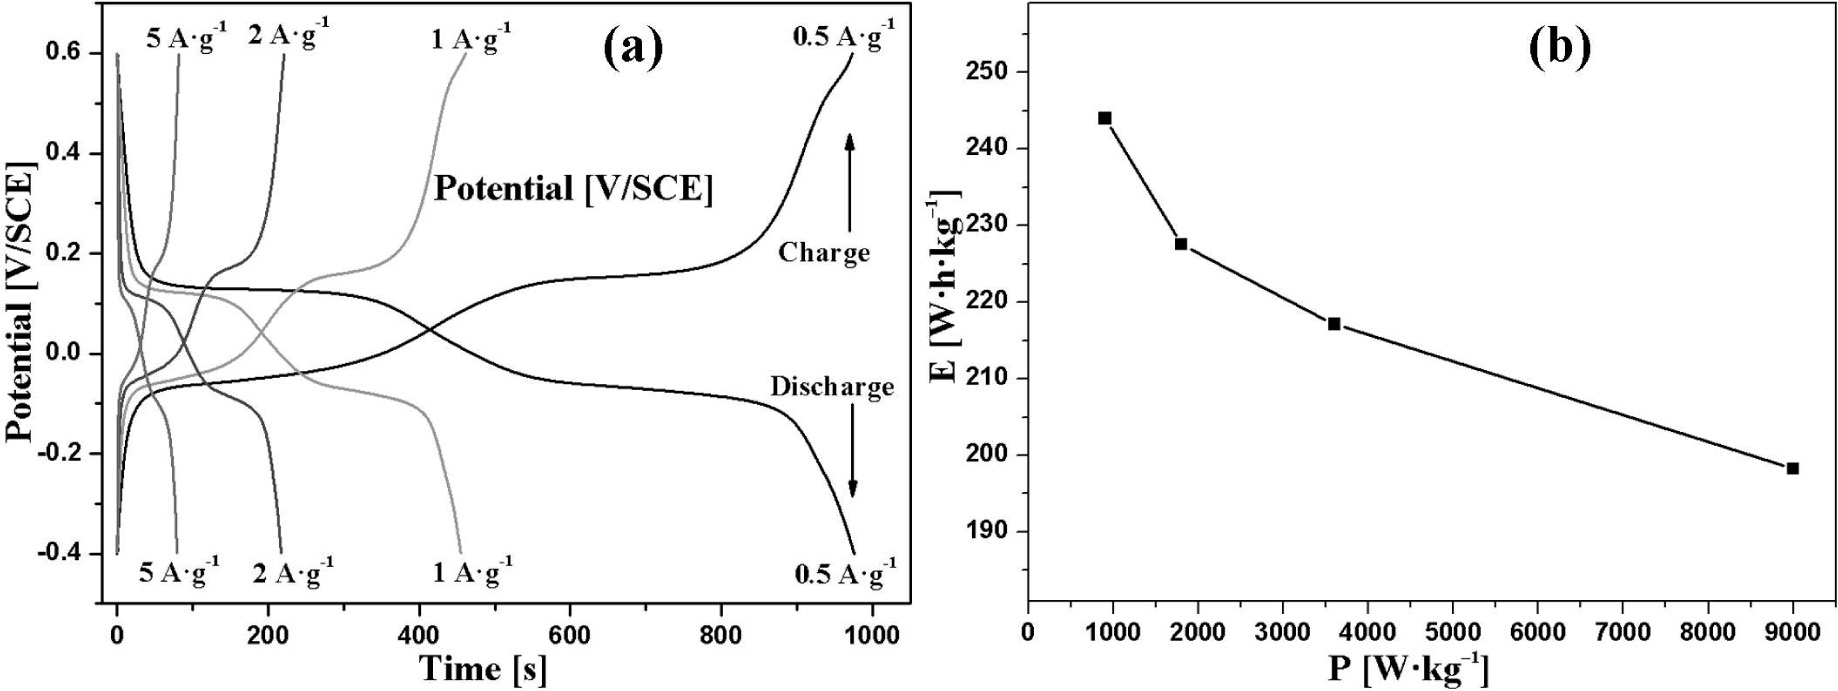
(a) Galvanostatic charge and discharge curves at different current densities of HVOM; (b) Ragone plot of HVOM.
Table 1
Comparison of specific capacitance of the HVOM with V2O5 materials reported in the previous literature.
| Types of V2O5 material | Electrolyte | Potential range [V] | Specific capacitance [F·g–1] | Literature |
|---|---|---|---|---|
| V2O5 nanoflowers, nanoballs, nanowires, nanorods | 1 mol·dm–3 Na2SO4 | 0 to 1 | 119, 161, 177, 235 | [28] |
| V2O5 nanobelts, nanoparticles, microspheres | 1 mol·dm–3 LiNO3 | –0.4 to 0.8 | 140, 276, 308 | [3] |
| Electrospun V2O5 nanofibers | 2 mol·dm–3 KCl | 0 to 0.9 V | 190 | [26] |
| Electrospun V2O5 nanofibers | 1 mol·dm–3 LiClO4 in PC | 0 to 3 | 250 | [26] |
| Nano porous V2O5 | 2 mol·dm–3 KCl | –0.2 to 0.8 | 214 | [38] |
| V2O5 powders | 2 mol·dm–3 KCl | –0.2 to 0.7 | 262 | [39] |
| Interconnected V2O5 nanoporous network | 0.5 mol·dm–3 K2SO4 | 0.2 to 0.8 V | 304 | [27] |
| V2O5 nanowires | 1 mol·dm–3 LiNO3 | –0.4 to 0.8 | 351 | [24] |
| Hollow spherical V2O5 | 5 mol·dm–3 LiNO3 | –0.2 to 0.8 | 479 | [22] |
| β-V2O5 thin films | 1 mol·dm–3 LiClO4 in PC | –0.8 to 1.2 | 346 | [40] |
| Hollow V2O5 microspheres | 1 mol·dm–3 LiNO3 | –0.4 to 0.6 | 488 | This work |
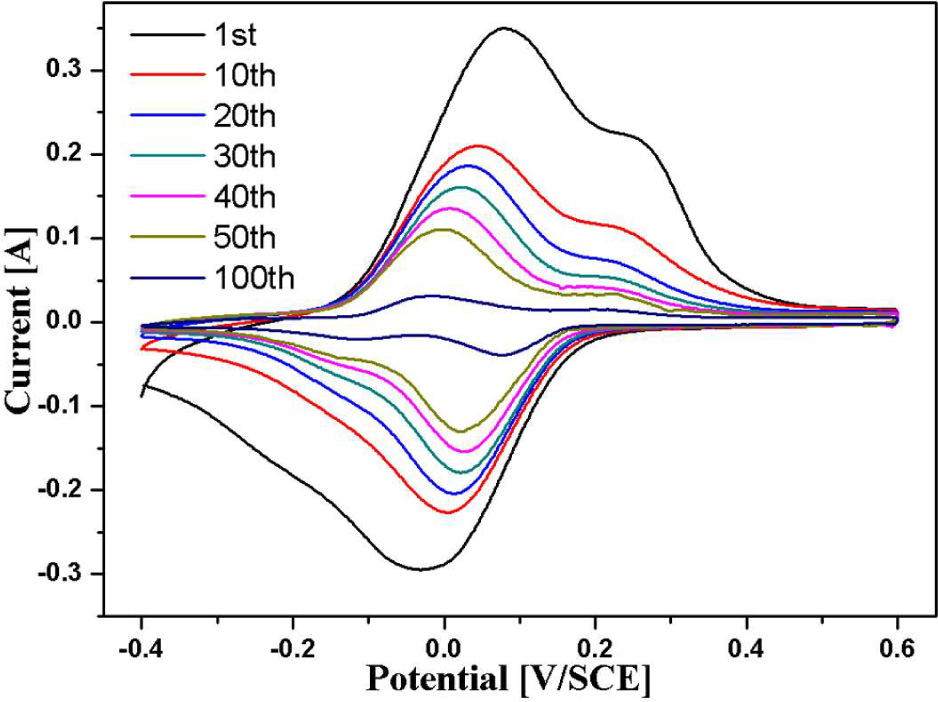
Cycling behavior of HVOM recorded by CV at 20 mV·s–1 scan rate.
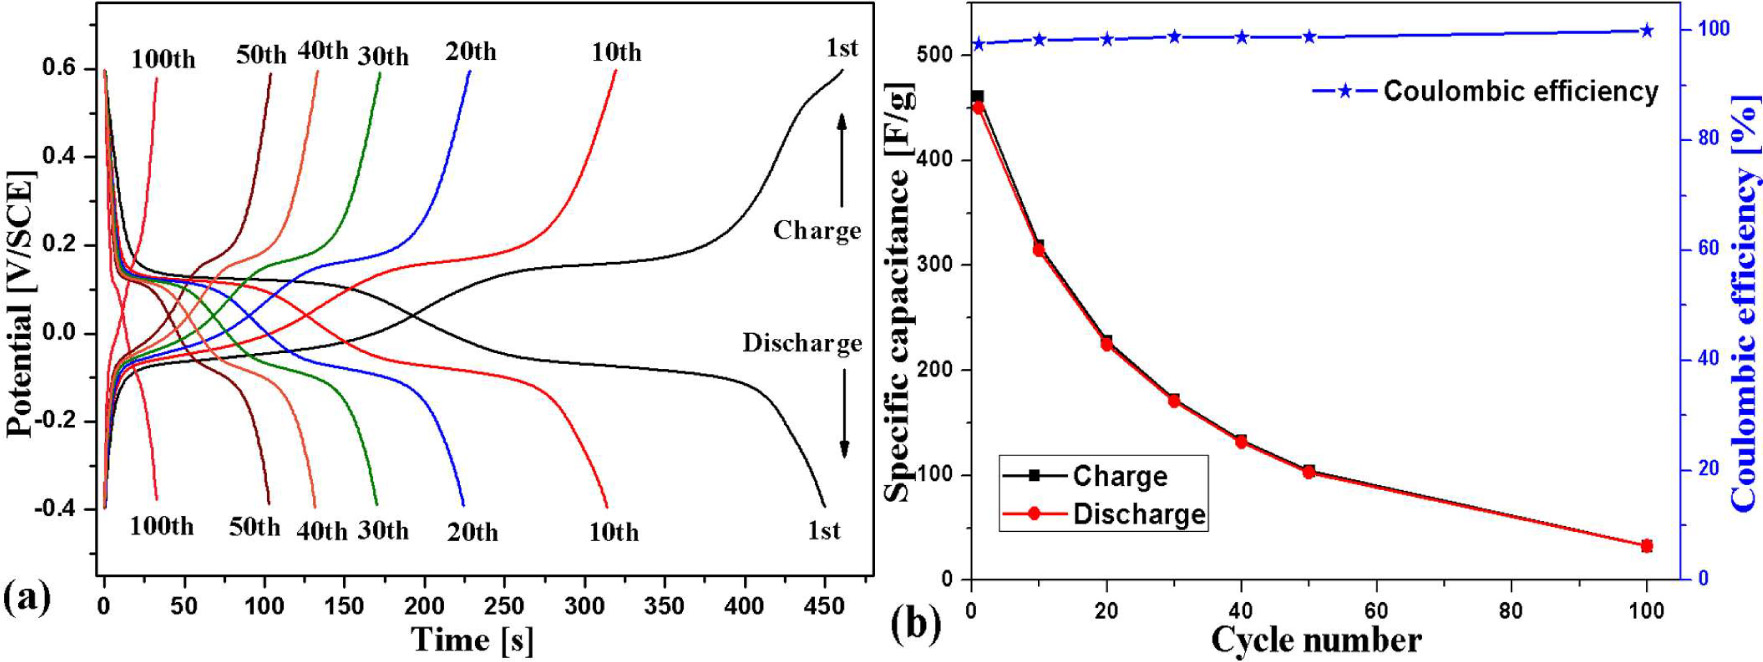
Cycling behavior of HVOM recorded at a current density of 1 A·g–1 by GCD: (a) galvanostatic charge and discharge curves; (b) cyclic stability of the specific capacitance.