Have a personal or library account? Click to login
Formation of the regularly arranged tubular pores during electrophoretic deposition Cover

Formation of the regularly arranged tubular pores during electrophoretic deposition

Open Access
|Mar 2017

Figures & Tables

XRD pattern of the deposited alumina powders and green body deposit.
Optical photographs of the tubular porous alumina ceramics prepared (a) without a mesh; and at various mesh sizes: (b) 0.1985 mm; (c) 0.3033 mm; (d) 0.4650 mm; (e) 0.6567 mm.
Calculated electric field strength distribution on the gauze surface for different mesh sizes (a) no mesh; (b) 0.1985 mm; (c) 0.3033 mm; (d) 0.4650 mm; (e) 0.6567 mm.
Optical photographs of surfaces with a deposit from suspensions containing different types of acids: (a) propionic acid, pH = 4.13; (b) hydrochloric acid, pH = 4.12; (c) nitric acid, pH = 4.13; (d) hydrochloric acid, pH = 2.78. The insets represent (a) the pore diameter distribution determined from the relevant optical photographs; (b) the optical photograph of the opposite surface (close to the gauze) of the green body.
The pH values variation during the deposition from suspensions with different acids.
Effect of the pH values and zeta potential on the deposited pore structures.

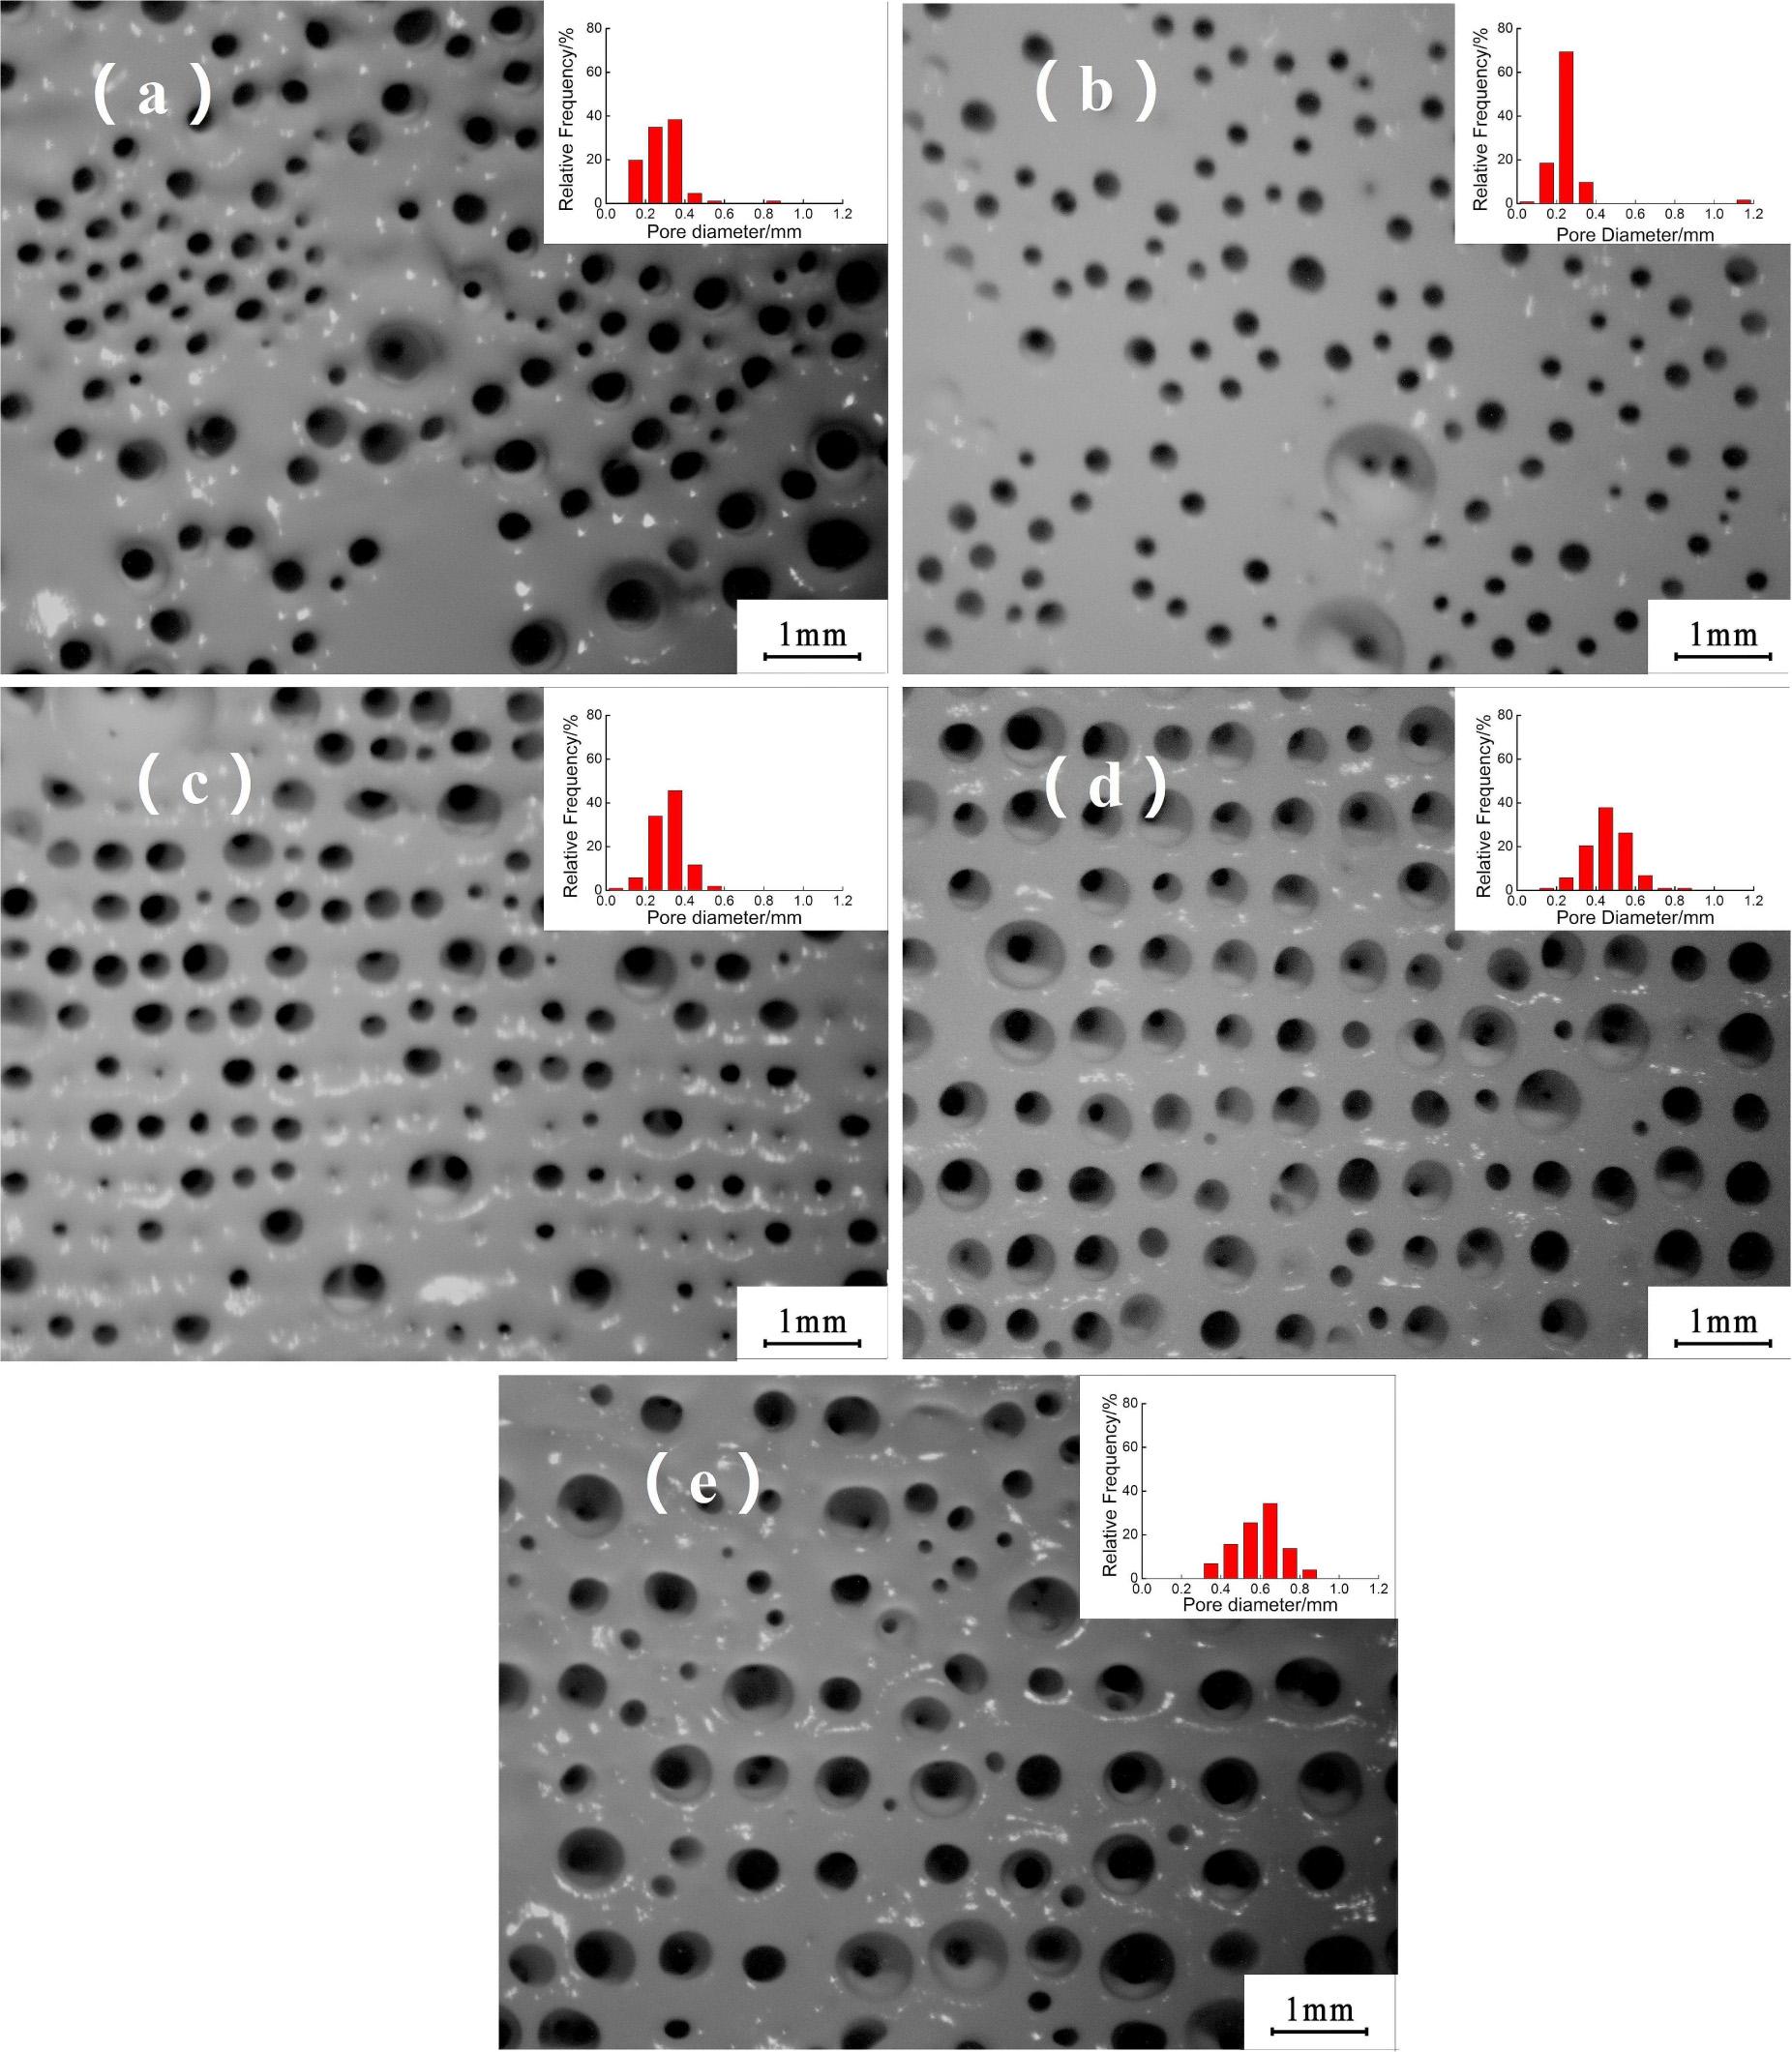
The average values of pores size and the ratio of the pore size to the mesh size (Sp/Sm)_

Mesh size [mm]Average pore sizes [mm]Sp/Sm
0.65670.5834±0.11480.88933
0.46500.4536±0.11240.97548
0.30330.3110±0.08401.02539
0.19850.2483±0.12511.25088
without mesh0.2819±0.1015

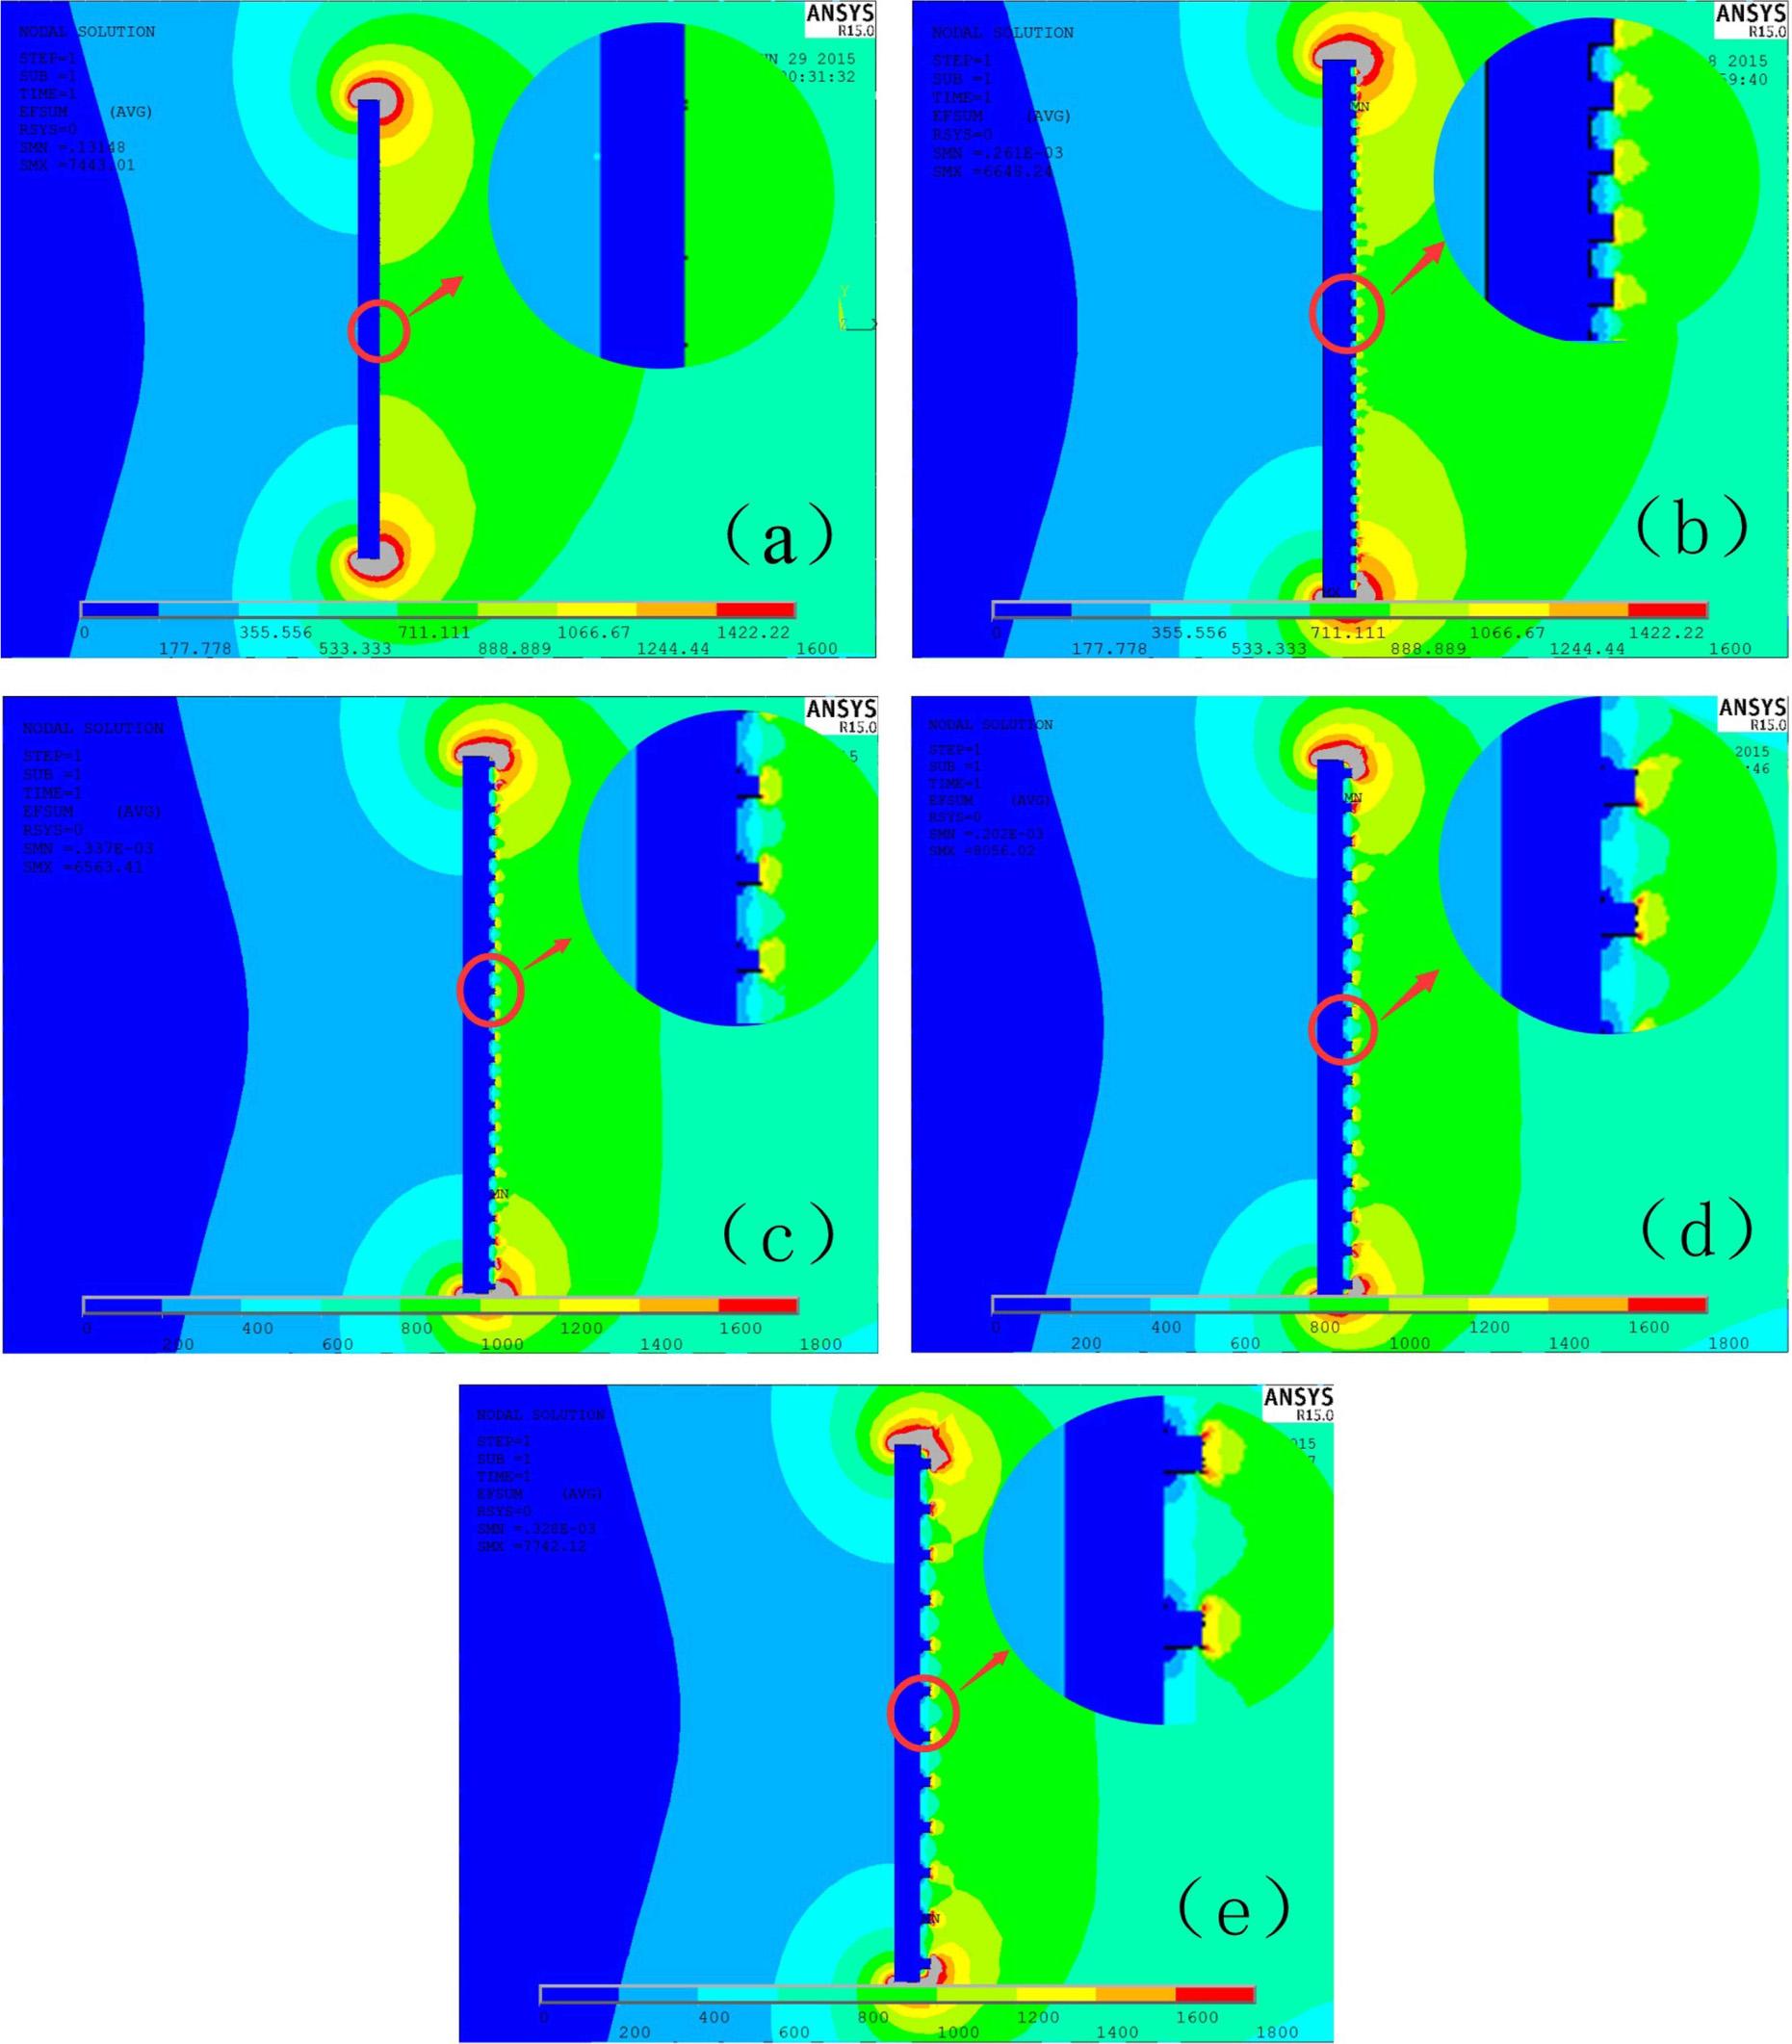
The differences of the electric field intensities between the mesh grids and holes in the gauzes with different mesh sizes_

MeshElectric field intensity [V/mm]
size [mm]Mesh grid/EgMesh hole/Eh∆E = Eg – Eh
0.65671283.7522.66761.04
0.4651201.8414.04787.76
0.30331191.6382.67808.93
0.19851080.2198.74881.46
DOI: https://doi.org/10.1515/msp-2017-0013 | Journal eISSN: 2083-134X | Journal ISSN: 2083-1331
Language: English
Page range: 151 - 158
Submitted on: Jun 22, 2016
Accepted on: Dec 9, 2016
Published on: Mar 10, 2017
Published by: Wroclaw University of Science and Technology
In partnership with: Paradigm Publishing Services
Publication frequency: 4 issues per year

© 2017 Cong Lin, Wuxin Li, Cengceng Fang, Qidan Wu, Hucheng Xie, Deliang Xu, Bizhi Xu, published by Wroclaw University of Science and Technology
This work is licensed under the Creative Commons Attribution-NonCommercial-NoDerivatives 3.0 License.