Have a personal or library account? Click to login
Effect of NaOH concentration on optical properties of zinc oxide nanoparticles Cover

Effect of NaOH concentration on optical properties of zinc oxide nanoparticles

Open Access
|Dec 2016

Figures & Tables

(a) XRD pattern of as-prepared ZnO samples prepared at different NaOH concentrations (the inset shows variation of peak width and position of (1 0 1) peak with respect to NaOH concentration), (b) Uniform Deformation Model (UDM) of as-prepared ZnO nanoparticles using Williamson-Hall analysis (Tables show linear fit equation of the corresponding sample), (c) variation of crystallite size of as-prepared ZnO nanoparticles with respect to molar ratio.
SEM images showing morphology of the ZnO samples prepared at different temperatures: (a) C1,(b) C2, (c) C3, and (d) C4.
Photoluminescence spectra of as-prepared ZnO nanoparticles excited at 320 nm exciton absorption wavelength.
Raman spectra of as-prepared ZnO nanoparticles (the inset shows the Raman shifts for stan-dard ZnO).

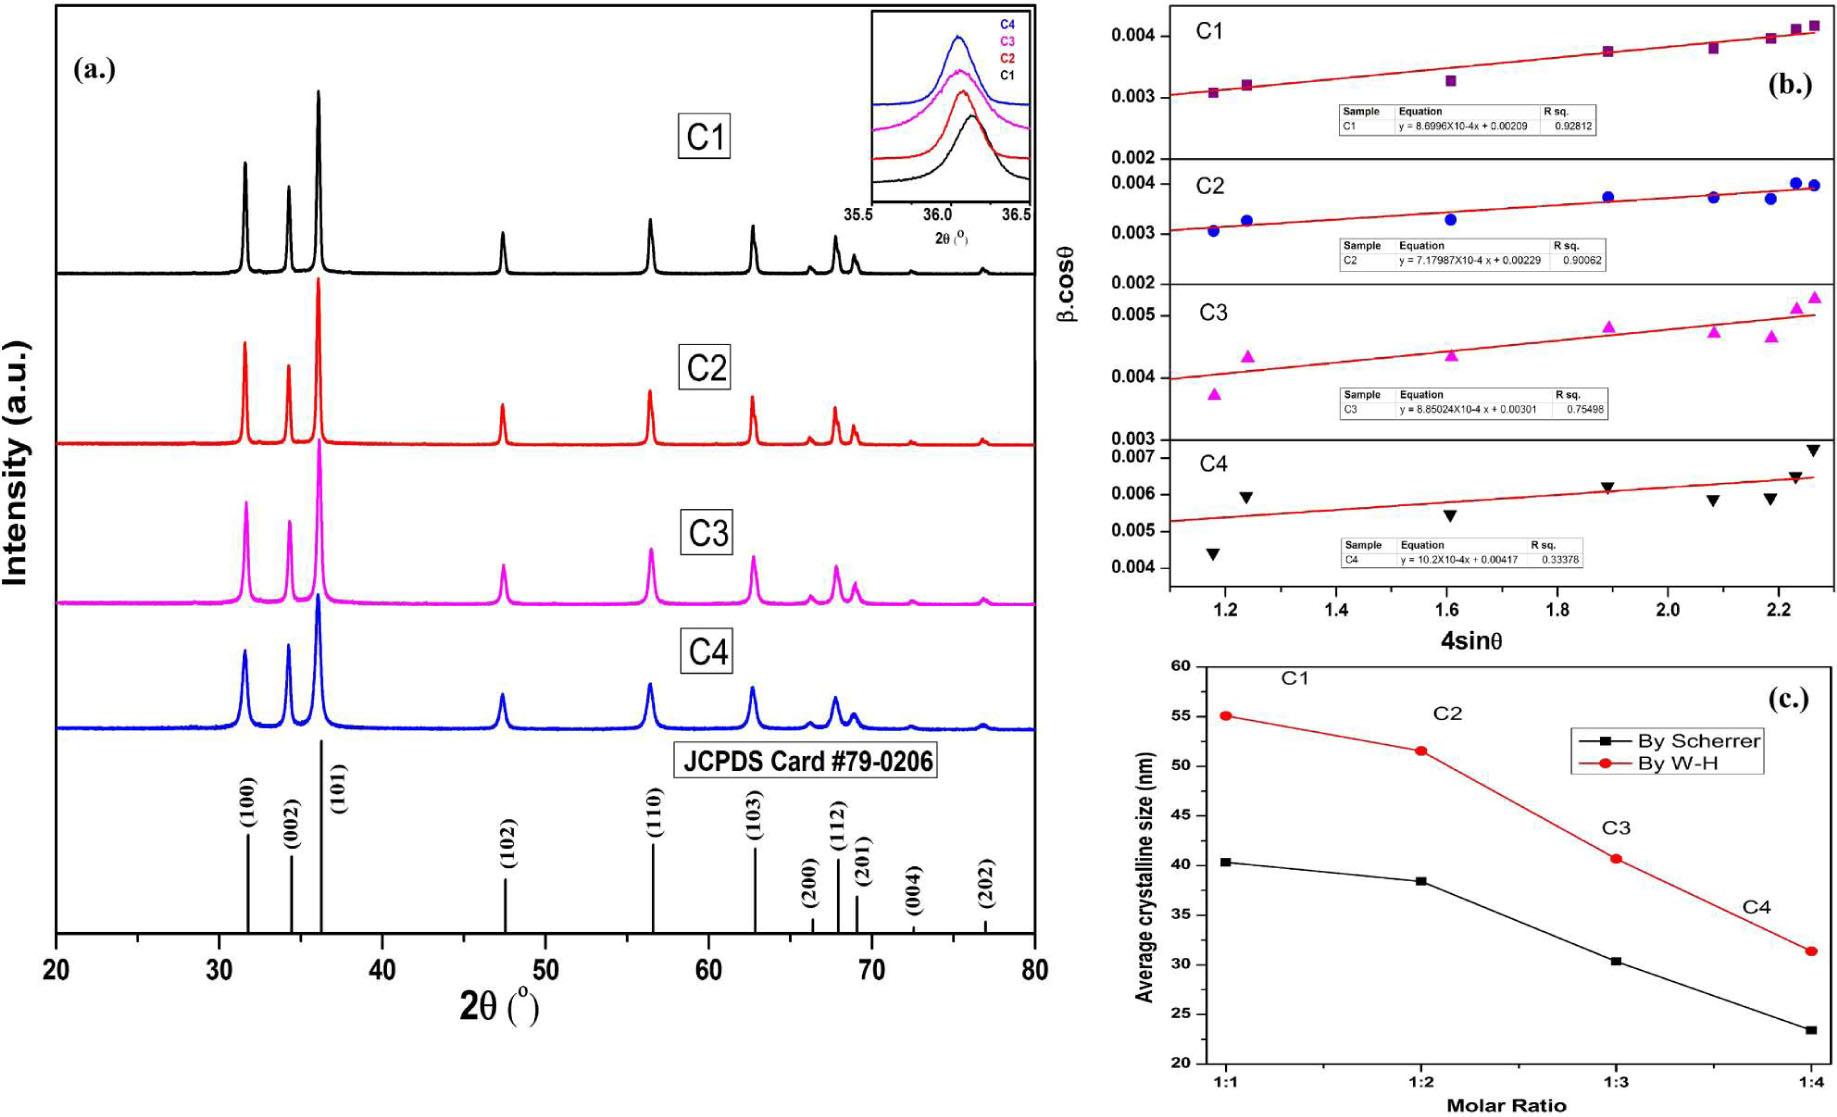
Calculated values of average crystallite size and strain for the as-prepared ZnO nanoparticles by UDM (W-H plot) and Scherrer formula_

SampleAverage crystallite sizeStrain (є)
UDM (W-H plot) Scherrer formula
C155 nm40 nm2.133 × 10—3
C251 nm38 nm2.163 × 10—3
C340 nm30 nm2.743 × 10—3
C431 nm23 nm3.597 × 10—3

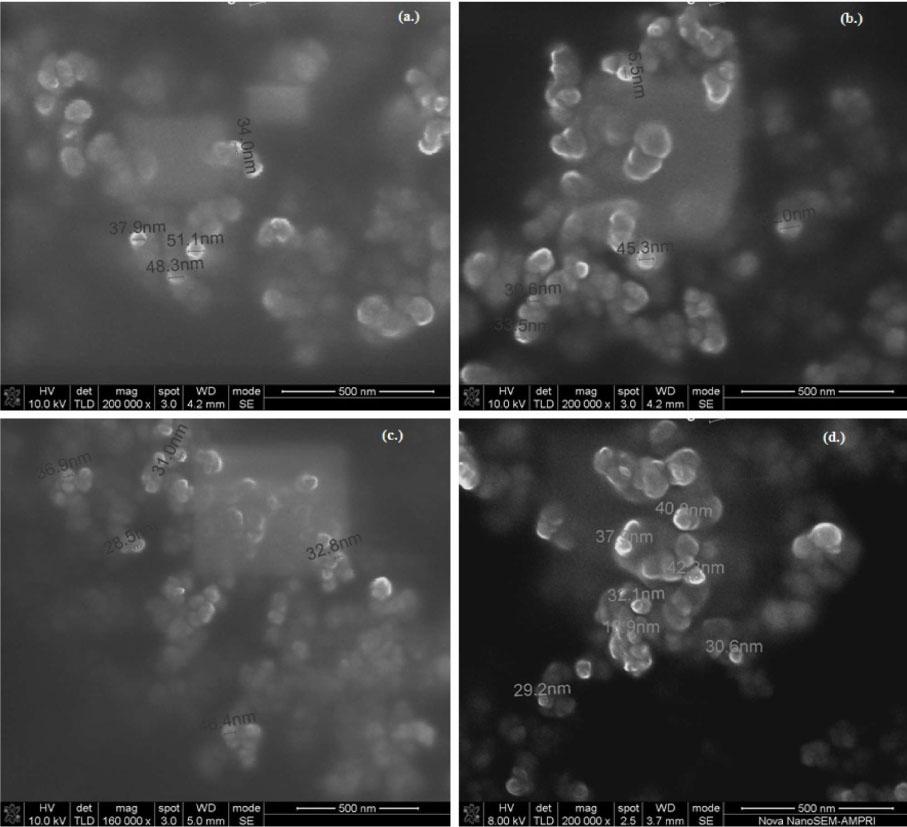
Average diameter of as-prepared ZnO nanoparticles obtained from field emission scanning electron microscope images_

SampleMolar ratioAverage particle size
C11:160 nm
C21:258 nm
C31:352 nm
C41:450 nm

List of final ZnO samples (C1-C4) obtained at different NaOH concentrations_

SamplePrecursor concentrationMolarReaction temperatureHeating time
Zinc acetateNaOHratio
C10.1M0.1M1:190 °C2h
C20.1M0.2M1:290 °C2h
C30.1M0.3M1:390 °C2h
C40.1M0.4M1:490 °C2h
DOI: https://doi.org/10.1515/msp-2016-0119 | Journal eISSN: 2083-134X | Journal ISSN: 2083-1331
Language: English
Page range: 819 - 827
Submitted on: Apr 13, 2016
|
Accepted on: Oct 18, 2016
|
Published on: Dec 12, 2016
In partnership with: Paradigm Publishing Services
Publication frequency: 4 issues per year

© 2016 Vaibhav Koutu, Lokesh Shastri, M. M. Malik, published by Wroclaw University of Science and Technology
This work is licensed under the Creative Commons Attribution-NonCommercial-NoDerivatives 3.0 License.