
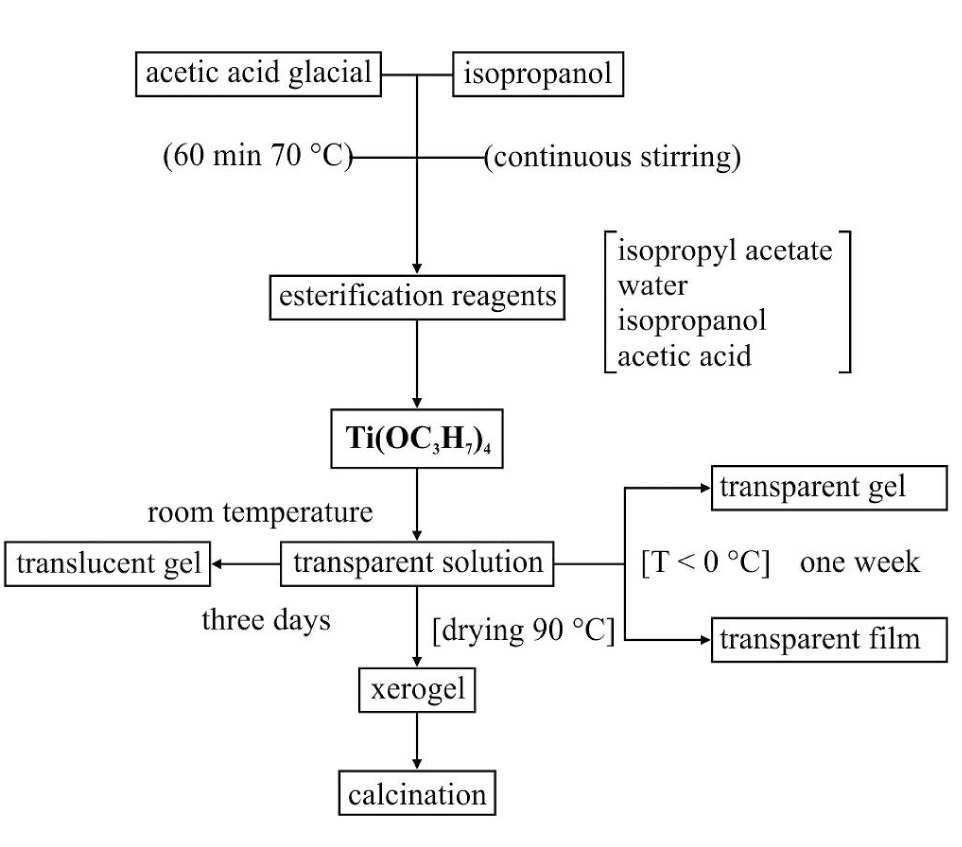
Fig. 1
Flow chart of the synthesis of transparent and translucent gels.
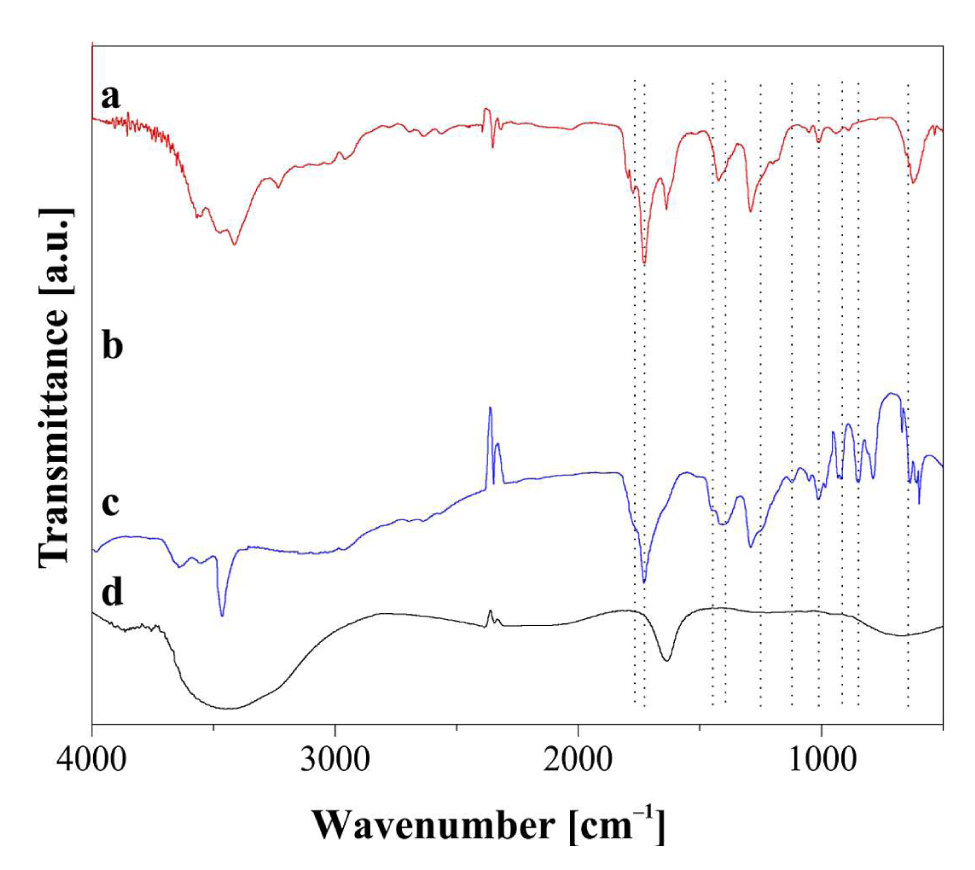
Fig. 2
FT-IR spectra of (a) acetic acid, (b) isopropanol, (c) isopropyl acetate, (d) water. The dashed lines correspond to the bands of isopropyl acetate.
Table 1
Quantity of reagents and products in the esterification mixture after reaction time 60 min at 75 °C.
| AcOH | + | iPrOH | ↔ | iPrOAc | + | H2O | |
|---|---|---|---|---|---|---|---|
| T = 0 min ni (mol) | 0.34 | 0.34 | 0 | 0 | |||
| T= 60min nf(mol) | 0.19 | – | 0.15 | 0.15 |
Table 2
Vibration frequencies of isopropyl acetate identified by infrared spectrometry after esterification reaction time 60 min at 75 °C.
| Frequency vibration [cm-1] | Attribution | Frequency vibration [cm-1] | Attribution |
|---|---|---|---|
| 617 | – | 1184 | νC–C |
| 870 | – | 1250 | νC–O |
| 935 | – | 1378 | νsymC–H |
| 1016 | – | 1448 | νanti–symC–H |
| 1120 | – | 1754 | νC=O |
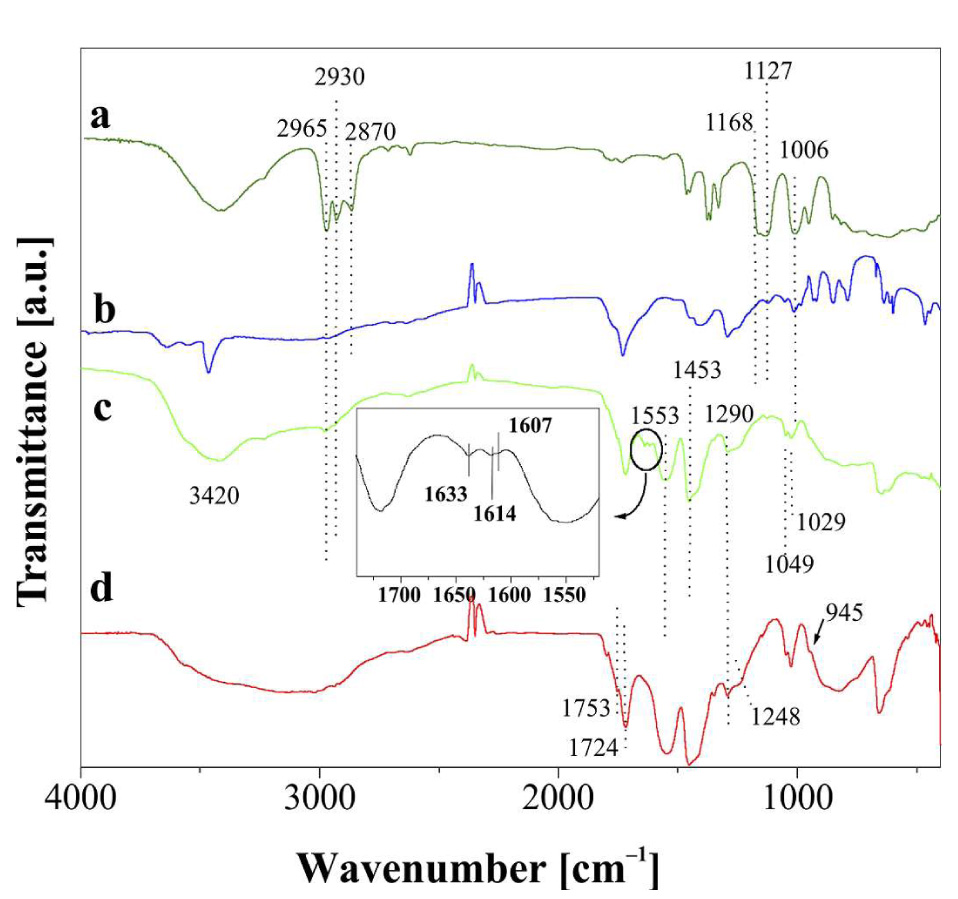
Fig. 3
FT-IR spectra of: (a) Ti(OC3H7)4, (b) mixture of esterification components, (c) transparent solution obtained after the addition of Ti(OC3H7)4 to the mixture of esterification after 30 min, (d) after 120 min.
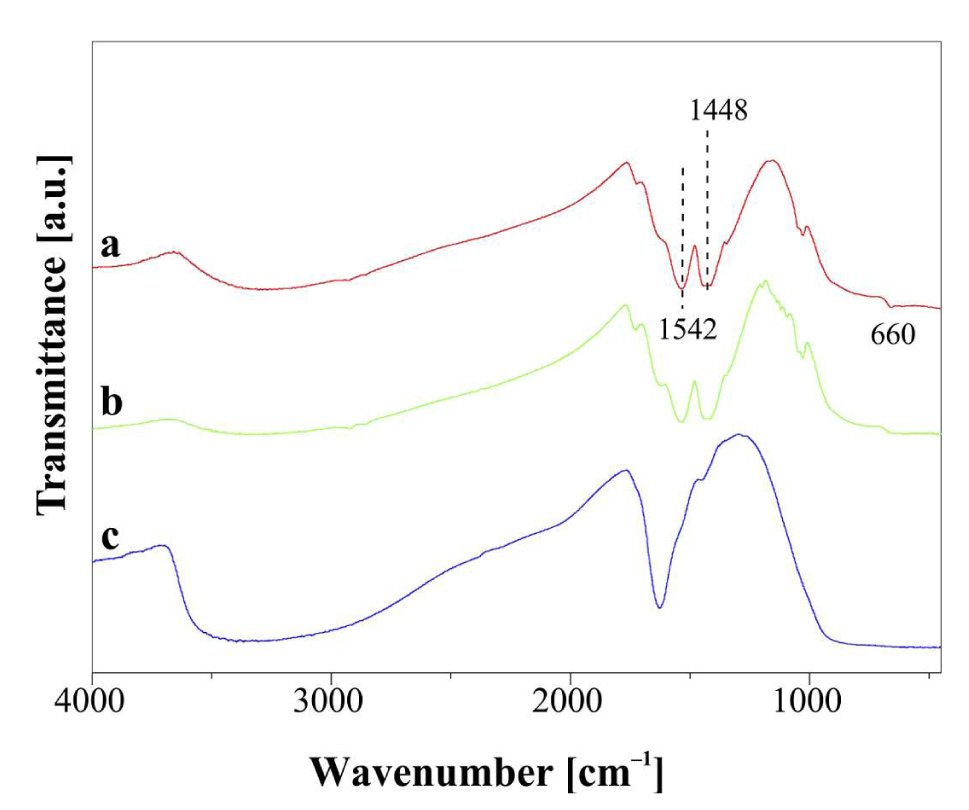
Fig. 4
FT-IR spectra of xerogels obtained after drying the gels at T = 90 °C: (a) xerogels obtained from the solution (30 min); (b) (120 min); (c) pure TiO2 xerogel.
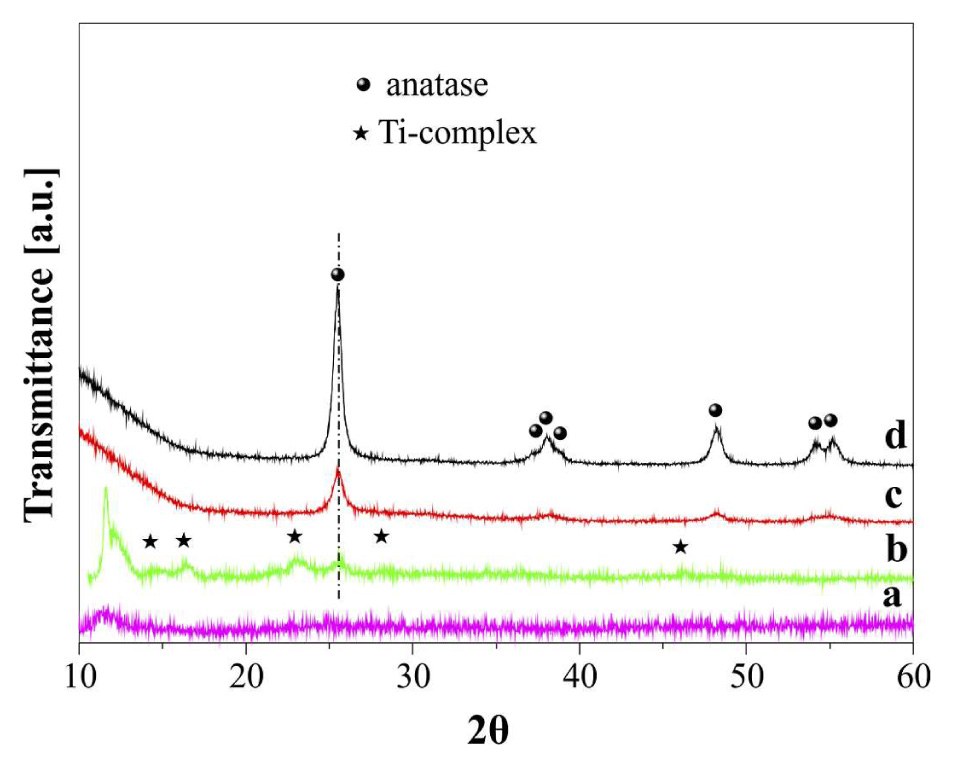
Fig. 5
XRD patterns of as-prepared samples obtained: (a) during 120 min, after drying at T = 90 °C; (b) sample with AcOH/Ti = 10, heated at 90 °C; (c) calcined at 250 °C; (d) at 450 °C.
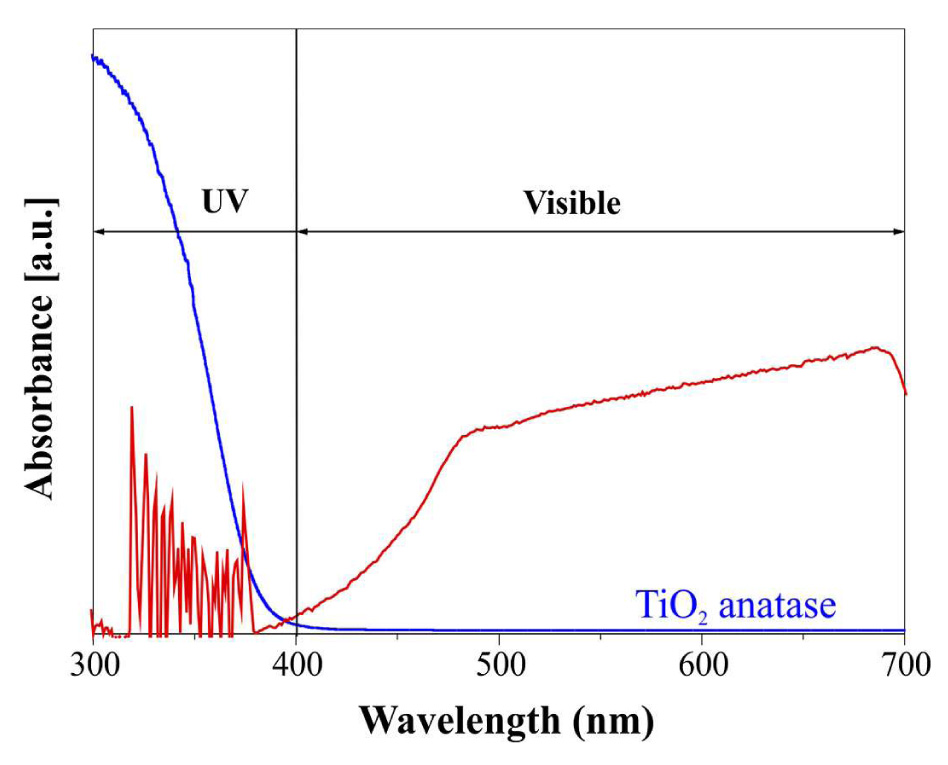
Fig. 6
UV-Vis absorption spectra of: (a) transparent TiO2 xerogel (obtained during 120 min after drying at T = 90 °C) and (b) TiO2 anatase (commercial).
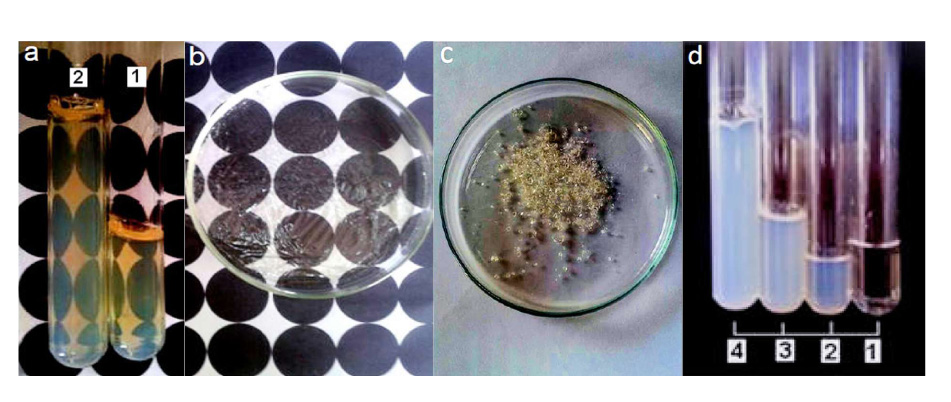
Fig. 7
(a) transparent monolithic gel obtained after one week (two different volumes); (b) transparent gel coated on a glass Petri dish; (c) transparent xerogel obtained after heating at 90 °C; (d) optical gel transformation from transparent to transluscent (1: transparent solution prepared for 120 min, obtained after three days), (3: transluscent gel with 3 mL of water), (4: transluscent gel with 6 mL of water).