
Table 1
Effects of the experimental conditions on the structure of the CdS nanoparticles.
| Sample | Kind of method | Composition | Reaction time | Structure |
|---|---|---|---|---|
| S1 | sonochemical | Cd(NO3)2 + TAA (1:2) | 40 min | cubic |
| S2 | sonochemical | Cd(NO3)2 + Na2S (1:2) | 40 min | cubic |
| S3 | combined sonochemical-solvothermal | Cd(NO3)2+ TAA (1:2) | 40 min | hexagonal (irregular) |
| S4 | combined sonochemical-solvothermal | Cd(NO3)2+ TAA (1:4) | 1 h | hexagonal (irregular) |
| S5 | combined sonochemical-solvothermal | Cd(NO3 )2 + Na2S(1:4) | 1 h | hexagonal (irregular) |
| S6 | combined sonochemical-solvothermal | Cd(NO3)2 + Na2S (1:4) | 5 h | hexagonal |
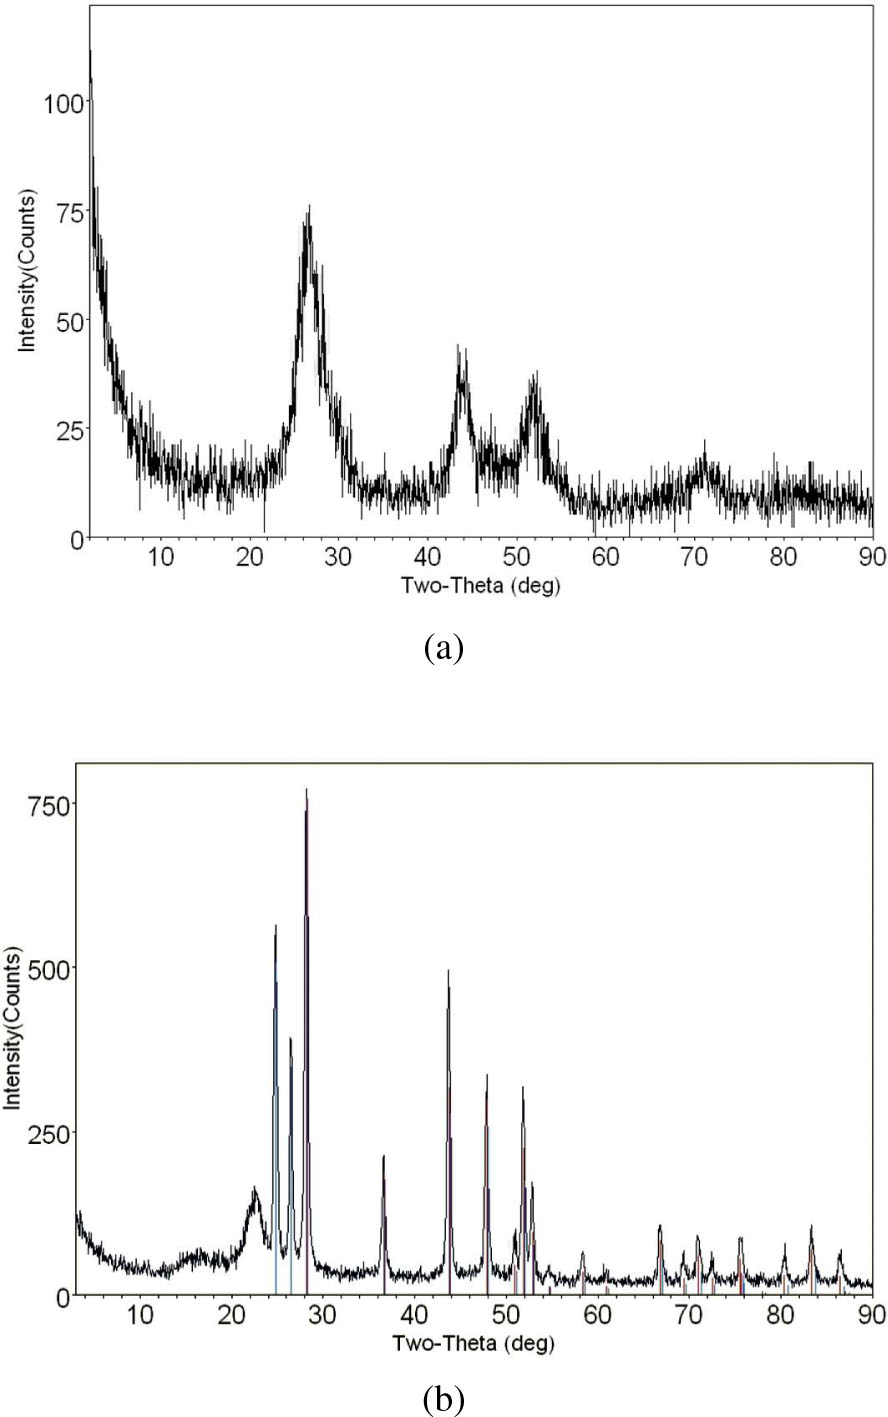
Fig. 1
XRD patterns of CdS nanoparticles synthesized by different methods (a) sonochemical method (Sample S1), (b) combined sonochemical-solvothermal method (Sample S6).
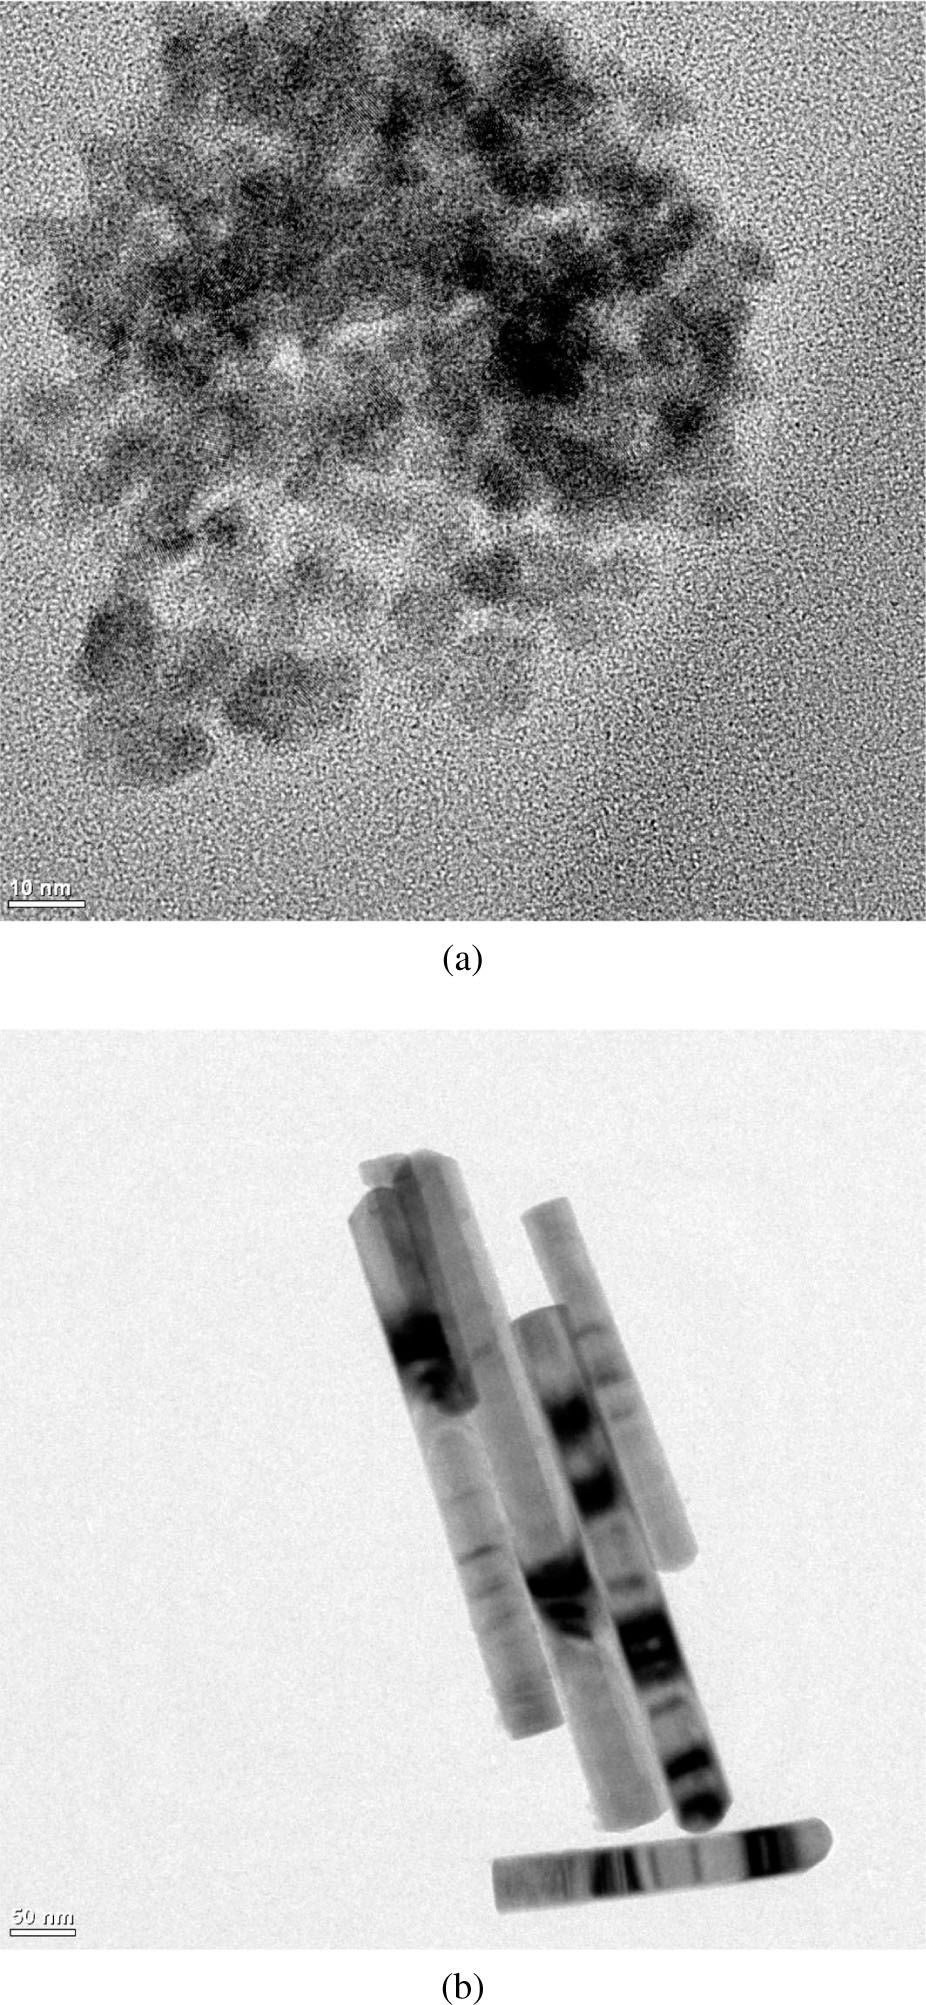
Fig. 2
TEM images of CdS nanoparticles synthesized with different methods (a) sonochemical method (Sample S1), (b) combined sonochemical-solvothermal method (Sample S6).
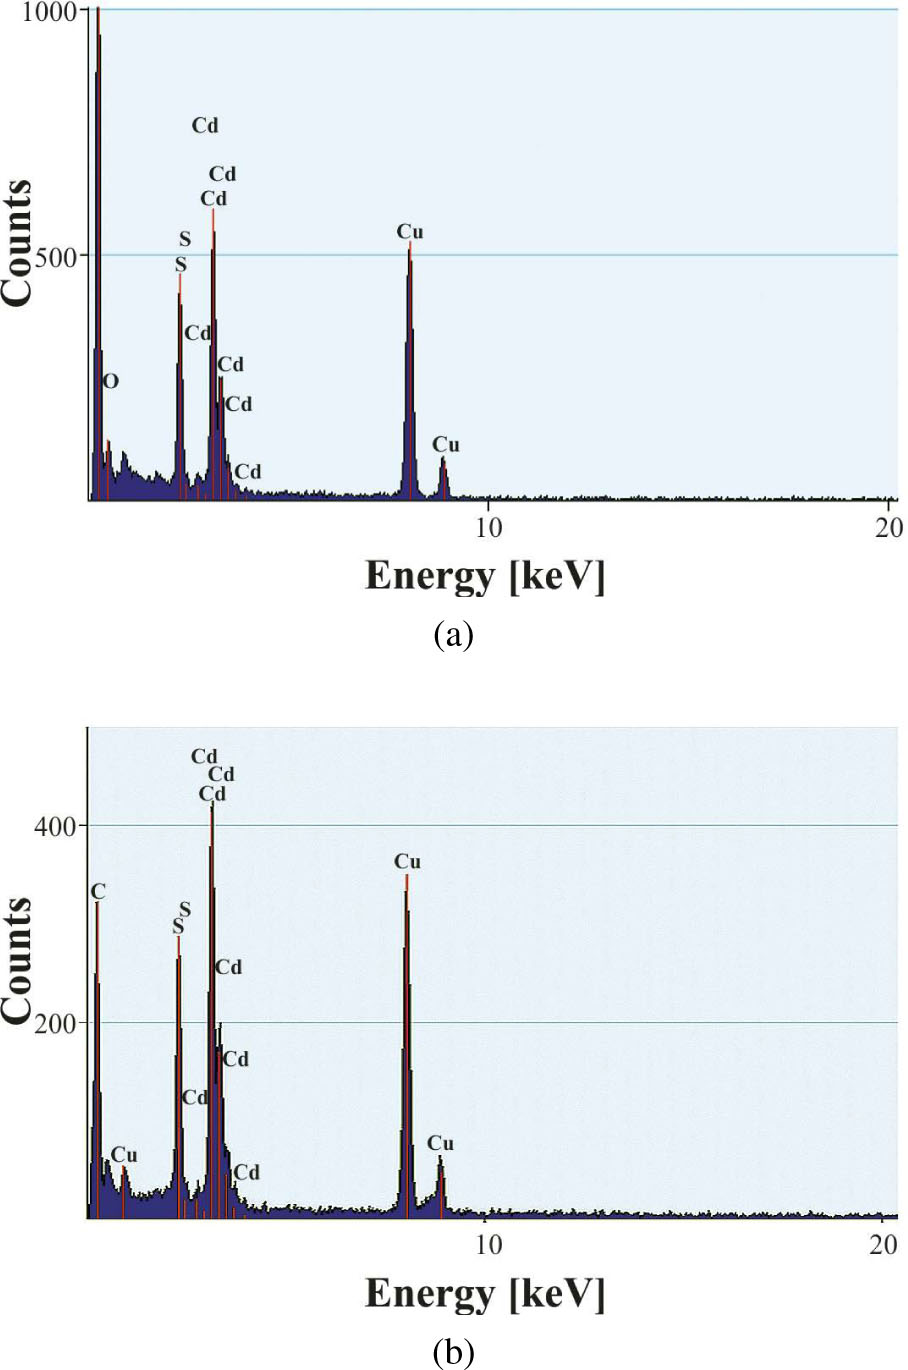
Fig. 3
EDX spectrum of CdS nanoparticles synthesized with different methods (a) sonochemical method (Sample S1), (b) combined sonochemical-solvothermal method (Sample S6).
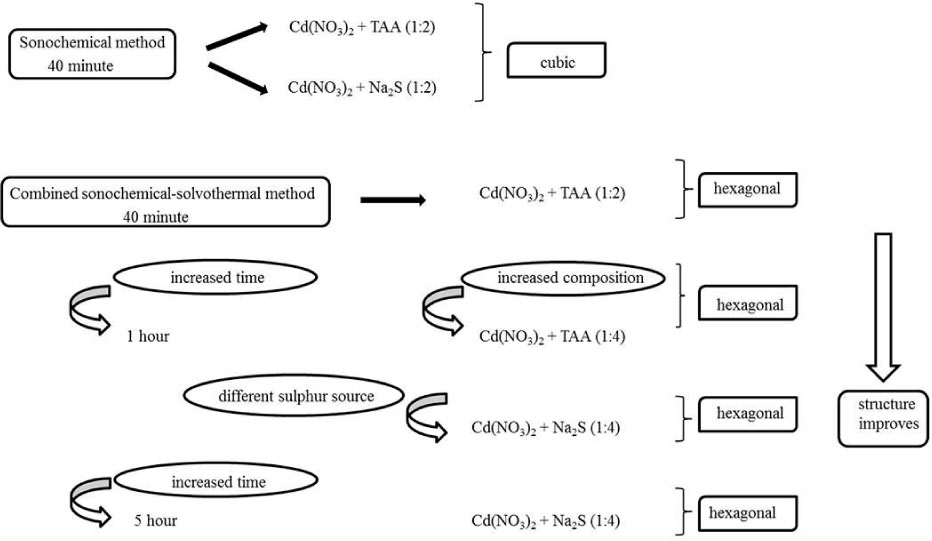
Fig. 4
Schematic presentation and structural development of synthesized CdS nanoparticles obtained using different experimental procedures.