
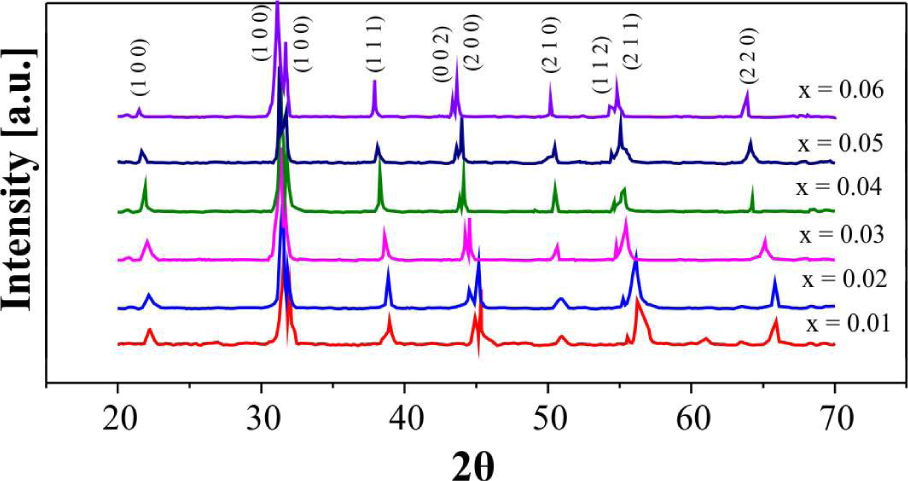
Fig. 1
X-ray diffractograms of Zr substituted 0.8Ba0.2(Bi0.5K0.5)Ti1 - xZrxO3 lead free ceramics.
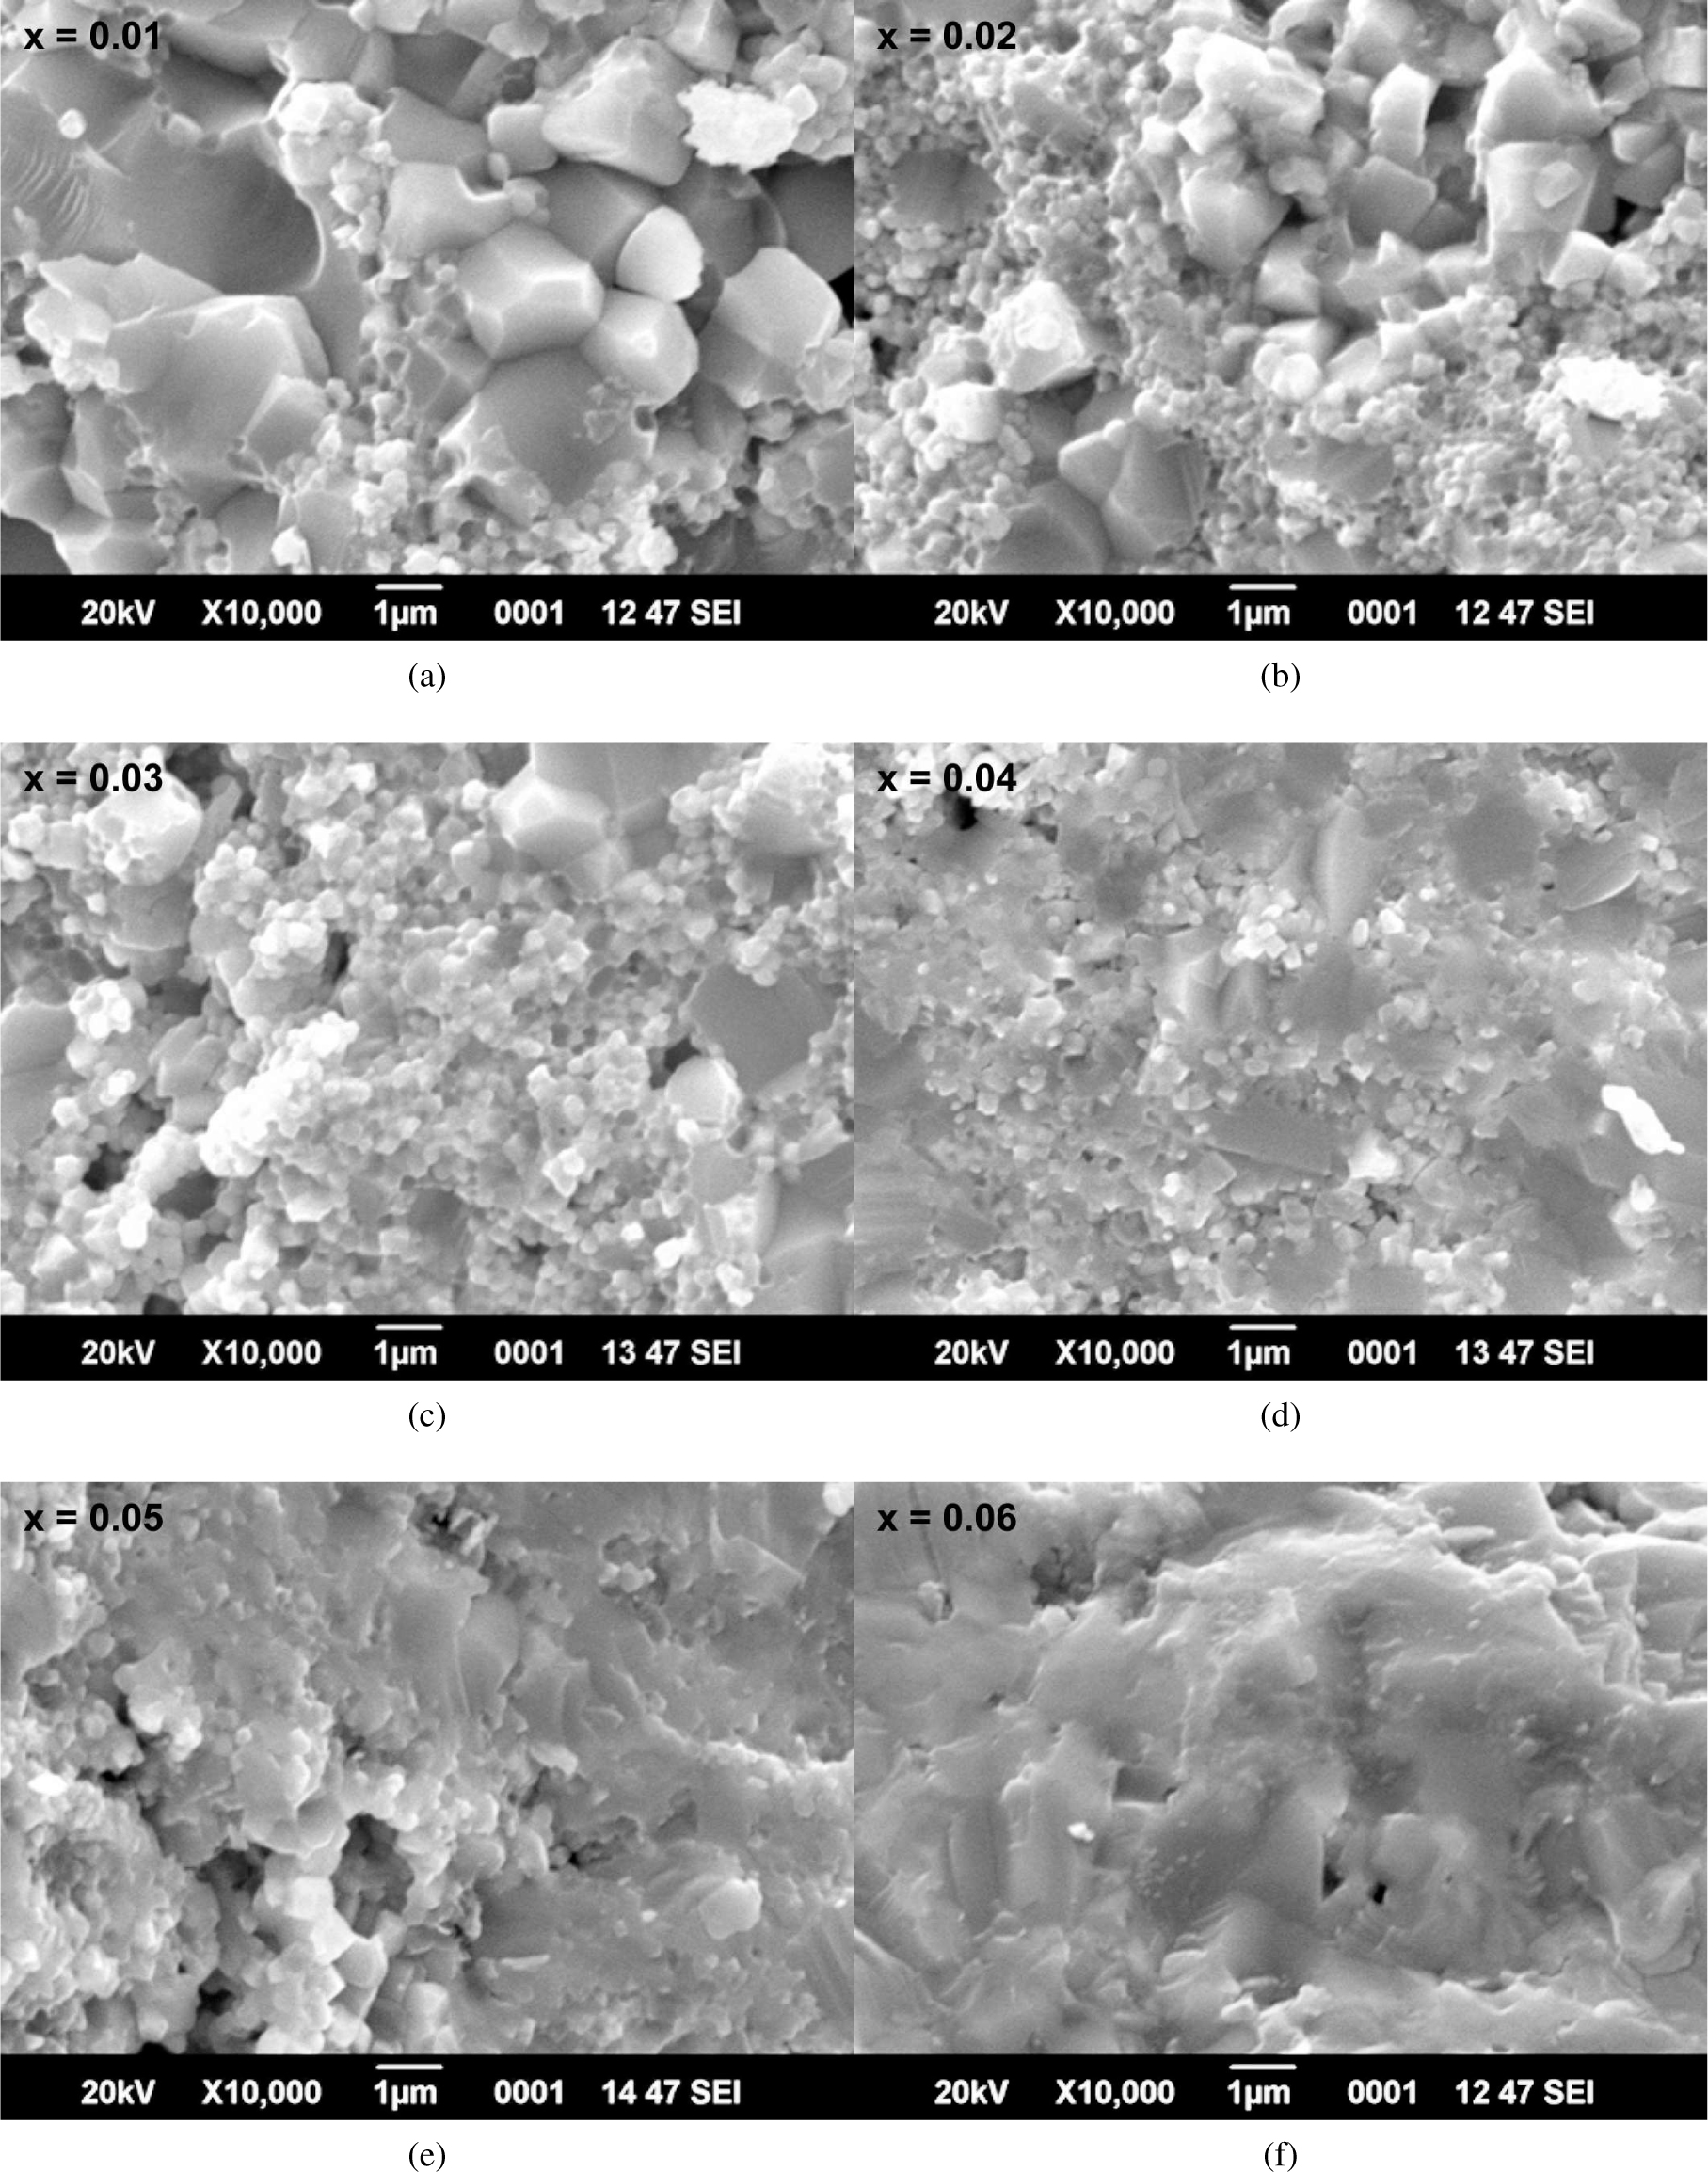
Fig. 2
Microstructure images of Zr substituted 0.8Ba0.2(Bi0.5K0.5)Ti1 - xZrxO3 (x = 0.01 to 0.06) lead free ceramics.
Table 1
Various parameters as a function of Zr substitution in 0.8Ba0.2(Bi0.5K0.5)Ti1 - xZrxO3 (x = 0.01 to 0.06) lead free ceramics.
| x | 0.01 | 0.02 | 0.03 | 0.04 | 0.05 | 0.06 |
|---|---|---|---|---|---|---|
| a [Å] | 3.995 | 4.003 | 4.012 | 4.022 | 4.032 | 4.045 |
| c [Å] | 4.096 | 4.103 | 4.111 | 4.118 | 4.126 | 4.133 |
| c/a | 1.025 | 1.0249 | 1.0246 | 1.0238 | 1.0233 | 1.0217 |
| Theoretical density[kg/m3] [11, 15] | 5860 | 5840 | 5810 | 5790 | 5760 | 5720 |
| Exp. density[kg/m3] | 5284 | 5269 | 5253 | 5234 | 5230 | 5222 |
| εRT [1 kHz] | 1650 | 1550 | 1451 | 1408 | 1361 | 1315 |
| εmax [1 kHz] | 2256 | 2065 | 2078 | 1605 | 1518 | 1466 |
| tanδ (at RT for 1 kHz) | 0.32 | 0.29 | 0.25 | 0.2 | 0.17 | 0.11 |
| γ[1 kHz] | 1.41 | 1.42 | 1.60 | 1.71 | 1.82 | 1.78 |
| EAC[eV] | 0.28 | 0.34 | 0.37 | 0.23 | 0.18 | 0.14 |
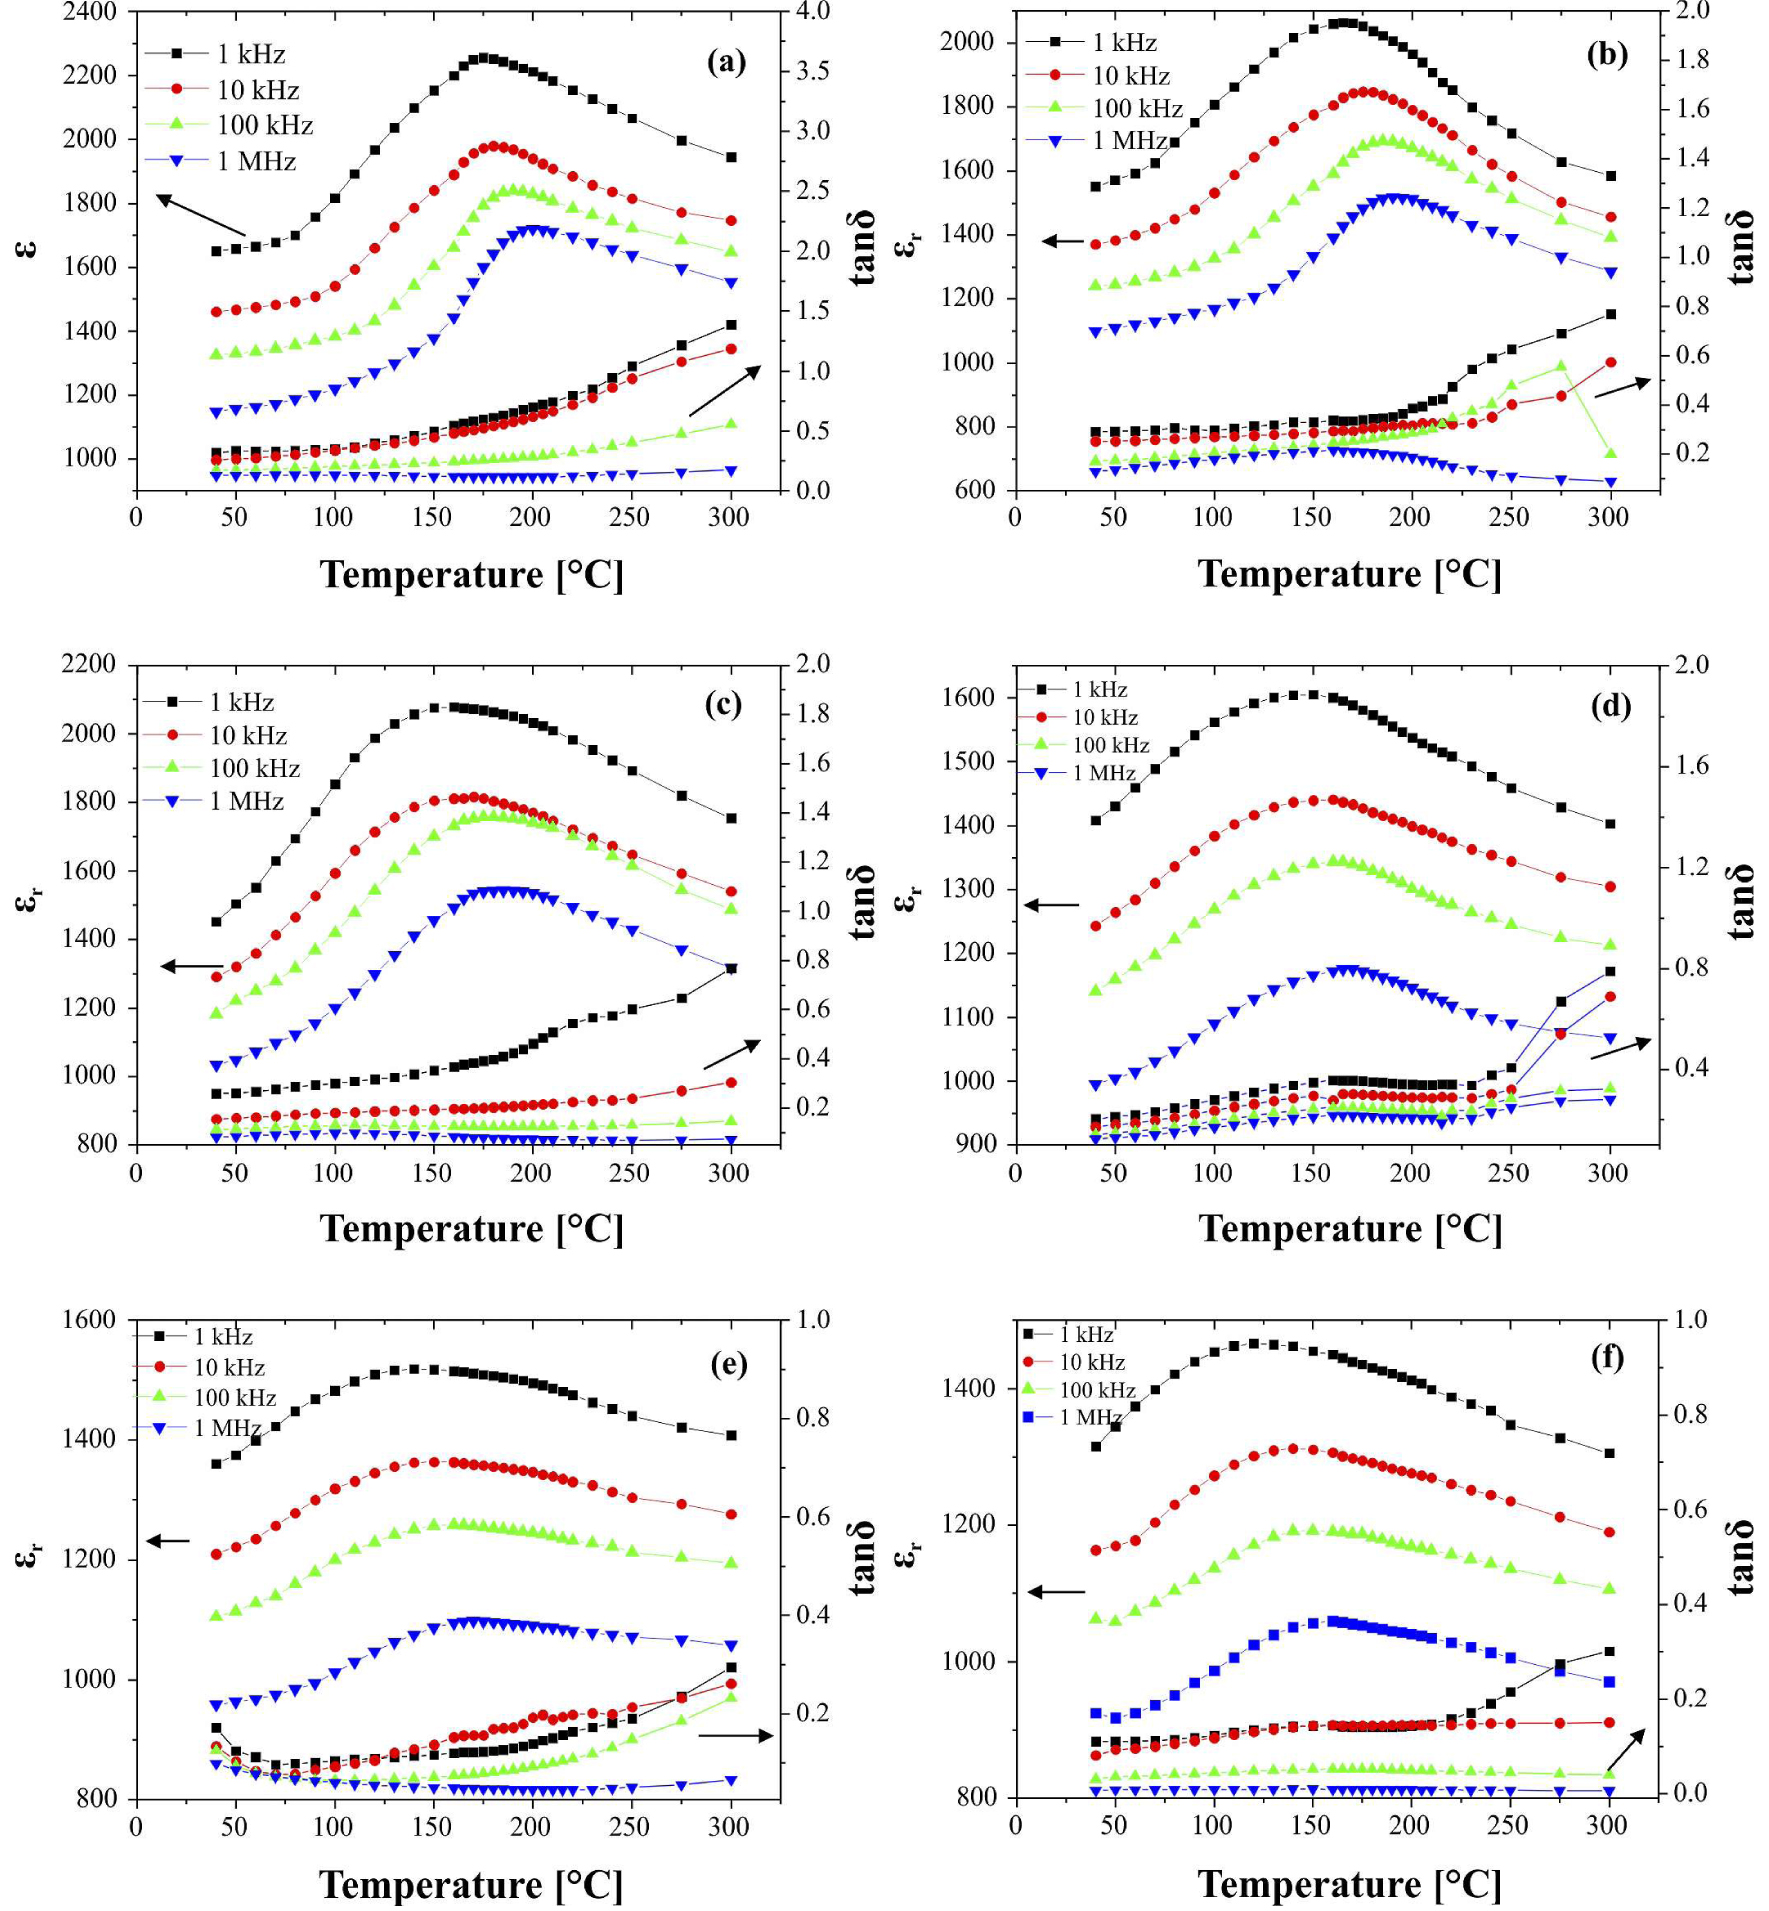
Fig. 3
Variation of dielectric constant and dielectric loss as a function of temperature at different frequencies for 0.8Ba0.2(Bi0.5K0.5)Ti1 - xZrxO3 (x = 0.01 to 0.06) lead free ceramics: (a) x = 0.01; (b) x = 0.02; (c) x = 0.03; (d) x = 0.04; (e) x = 0.05; (f) x = 0.06.
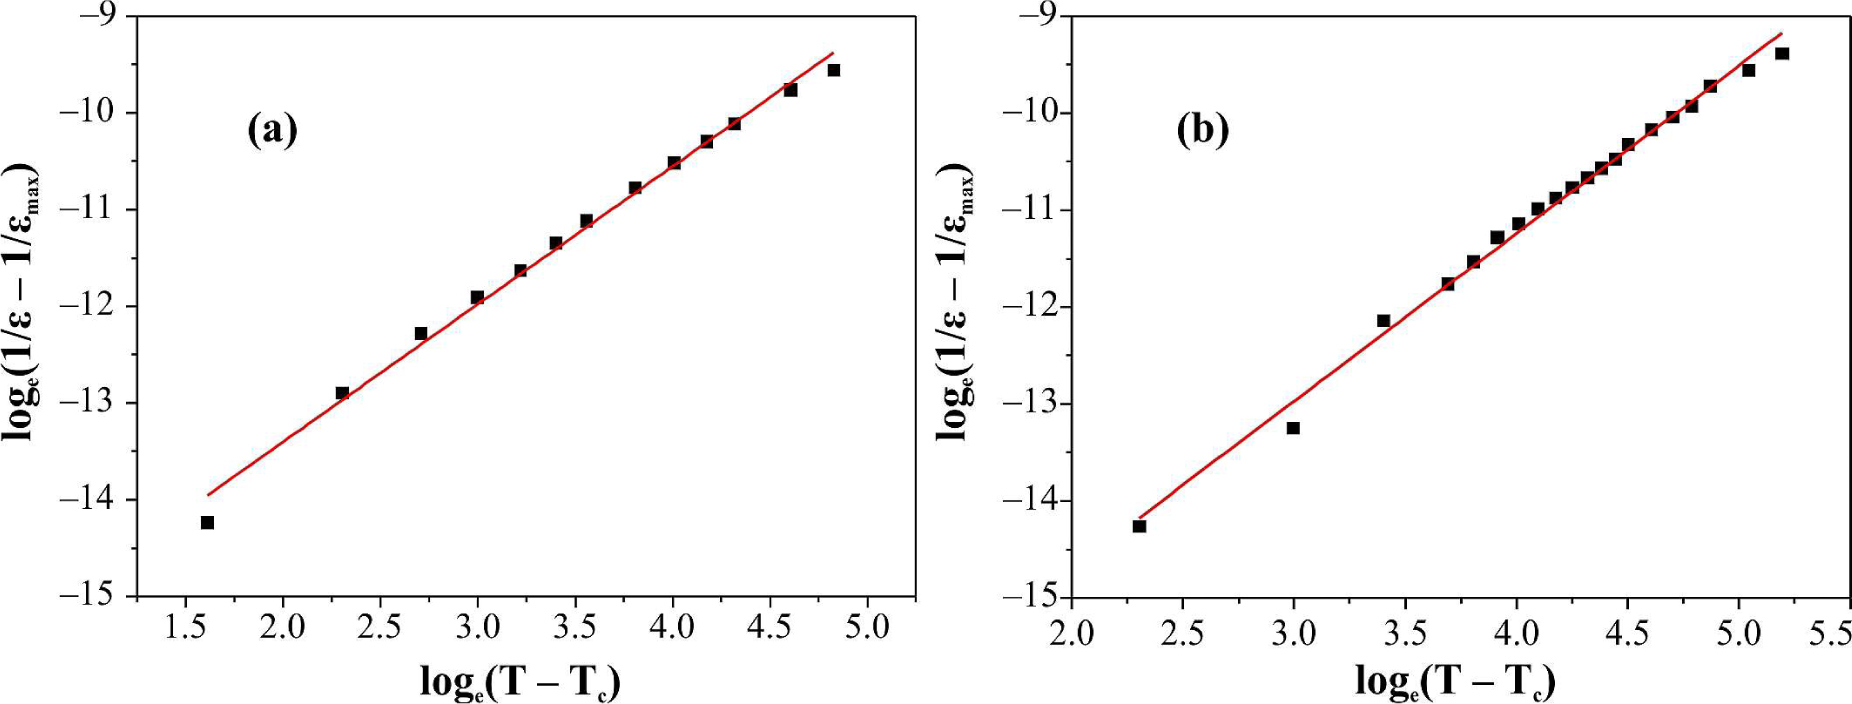
Fig. 4
Modified Curie-Weiss law for 0.8Ba0.2(Bi0.5K0.5)Ti1 - xZrxO3(x = 0.01 and 0.06) lead free ceramics (solid line represents linear fitting): (a) x = 0.01; (b) x = 0.06.
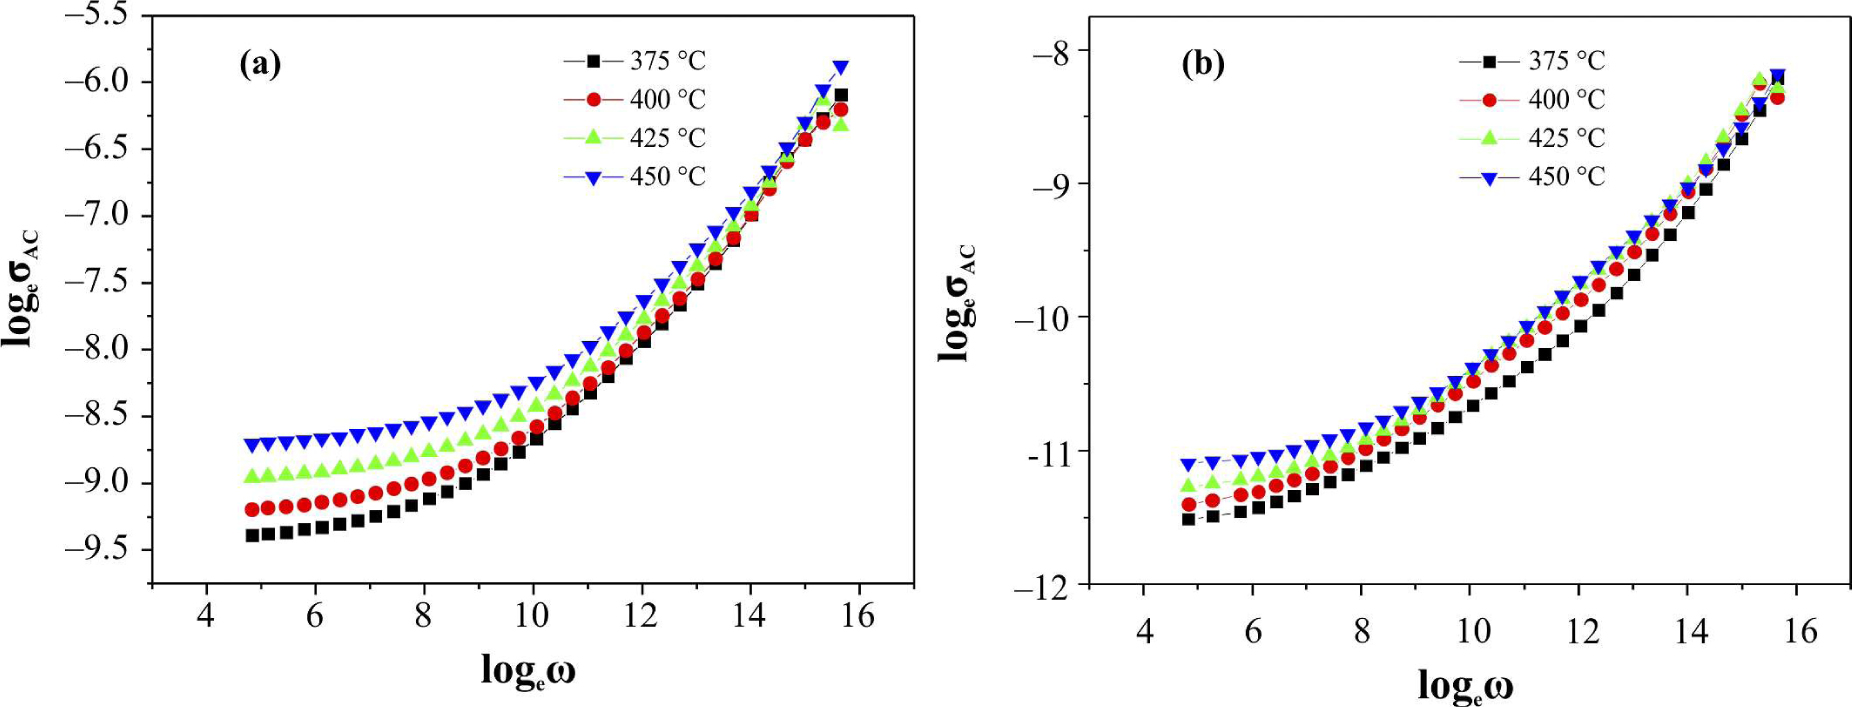
Fig. 5
Frequency dependent AC conductivity for 0.8Ba0.2(Bi0.5K0.5)Ti1 - xZrxO3(x = 0.01 and 0.06) lead free ceramics at different temperatures: (a) x = 0.01; (b) x = 0.06.
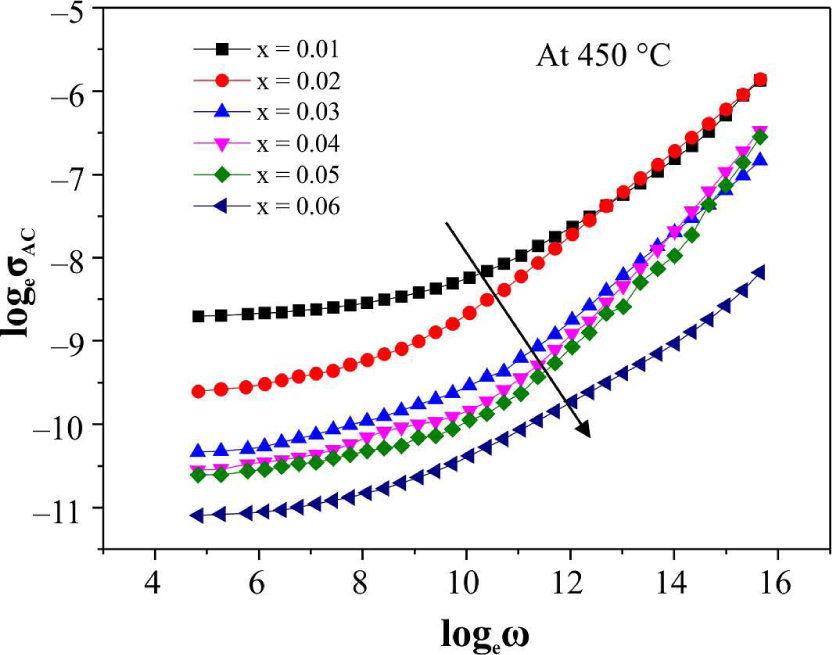
Fig. 6
Frequency dependent AC conductivity for 0.8Ba0.2(Bi0.5K0.5)Ti1 - xZrxO3 at 450 °C (x = 0.01 to 0.06).