
Fig. 1
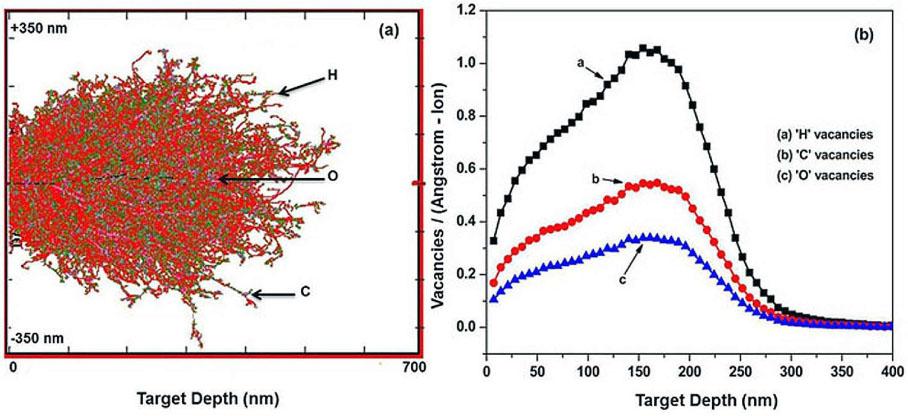
Fig. 2
Fig. 3
Fig. 4
Fig. 5
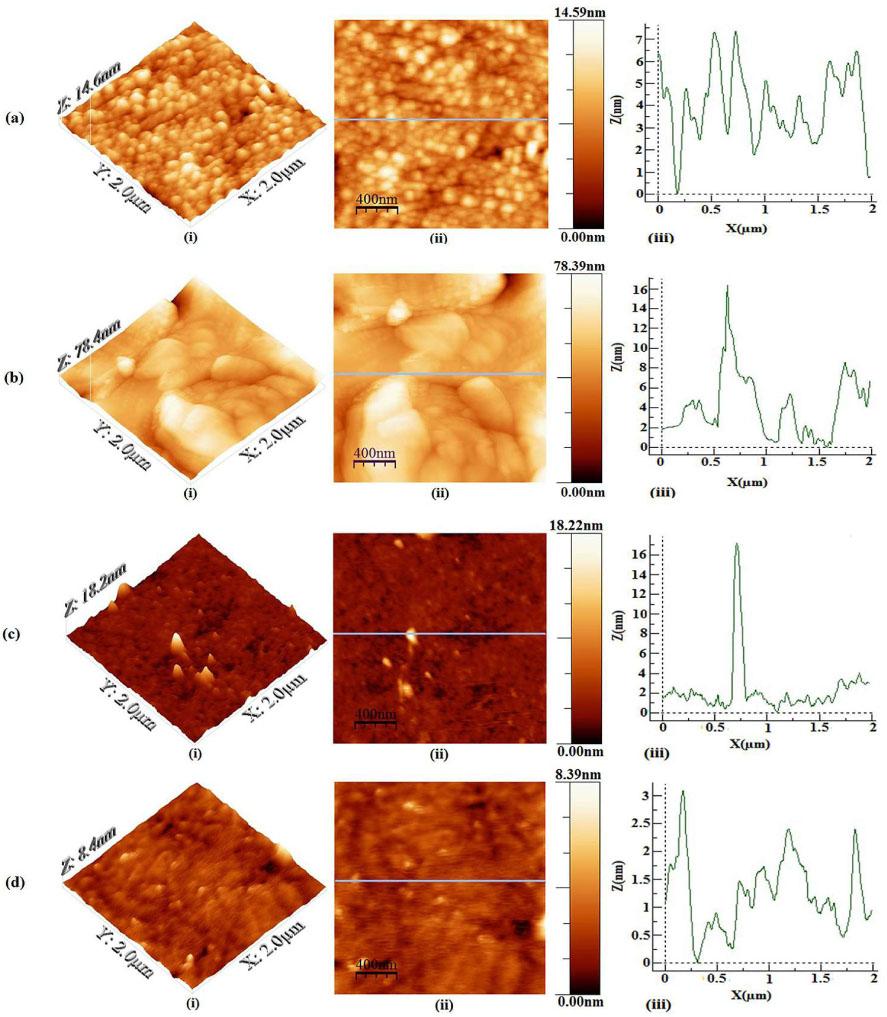
Fig. 6
Fig. 7
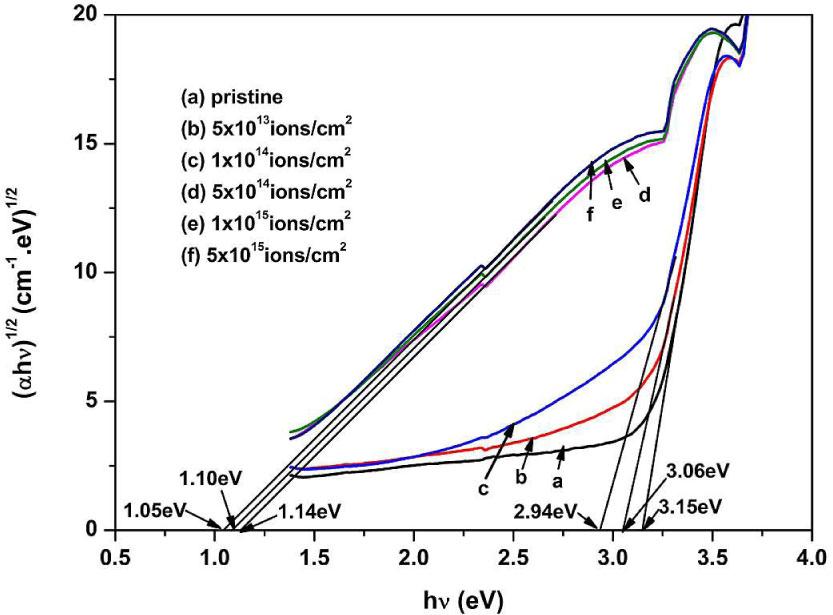
Fig. 8
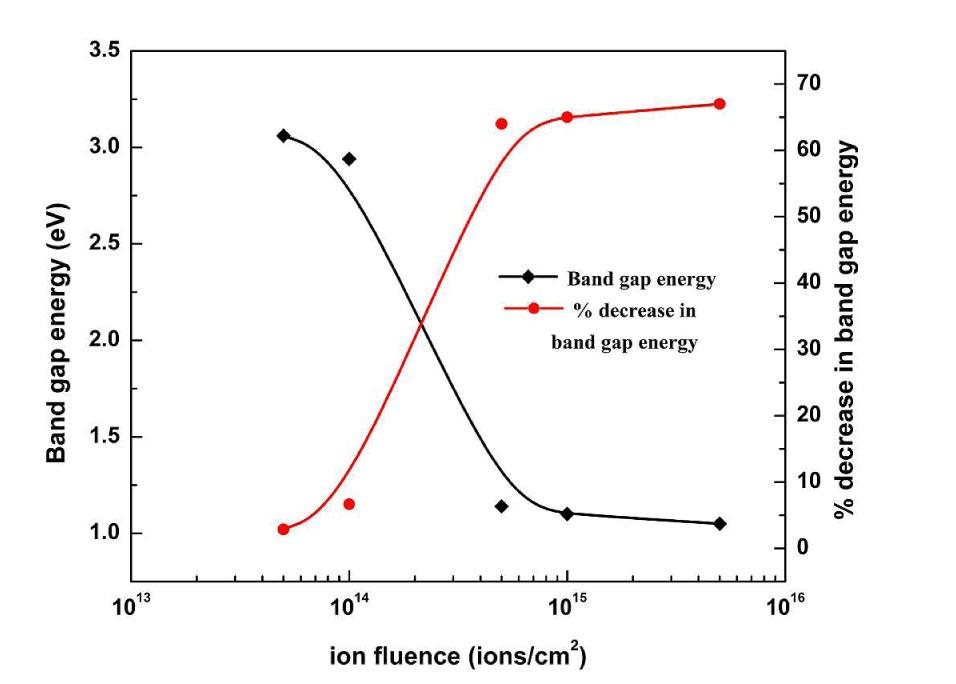
Fig. 9
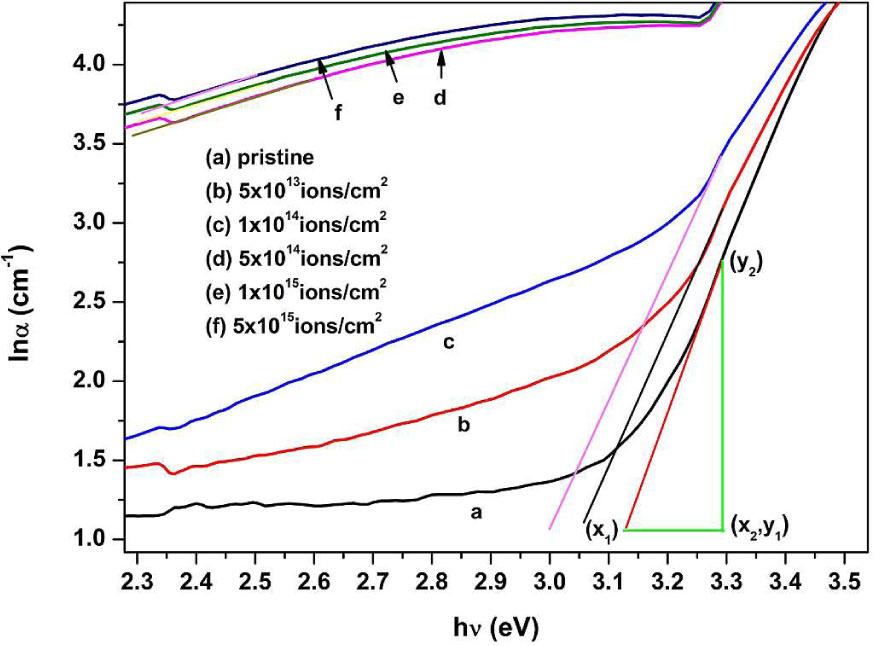
Fig. 10
Electrical conductivity of pristine and 400 keV Au+ ion implanted CR-39 with different ion fluences_
Fluence [ions/cm2] | Electrical conductivity [(Ω· cm)−1] |
|---|---|
Pristine | 6.84 × 10−09 |
5 × 10¹³ | 7.41 × 10−07 |
1 × 10¹⁴ | 7.45 × 10−07 |
5 × 10¹⁴ | 7.64 × 10−07 |
1 × 10¹⁵ | 1.06 × 10−06 |
5 × 10¹⁵ | 6.52 × 10−06 |
Calculated values of Se, Sn and projected range of 400 keV Au+ ions for CR-39_
Ion type | Energy [keV] | Se [eV/nm] | Sn [eV/nm] | Range [nm] |
|---|---|---|---|---|
Au+ | 400 | 6.673 × 10² | 1.689 × 10³ | 220 |
RMS roughness of pristine and 400 keV Au+ ion implanted CR-39 samples at different ion fluences_
Fluence [ions/cm2] | RMS roughness [nm] |
|---|---|
Pristine | 1.71 |
5 × 10¹³ | 8.95 |
5 × 10¹⁴ | 1.02 |
5 × 10¹⁵ | 0.66 |
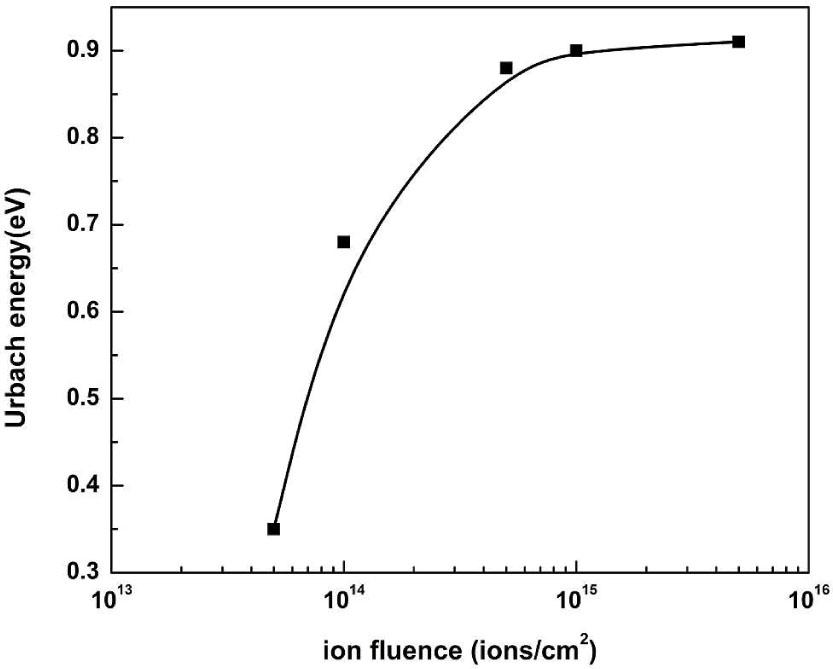
Variation of optical band gap energy Eg [eV], % decrease in band gap energy and Urbach energy Eu [eV], with different implanted fluences of CR-39_
Fluence [ions/cm2] | Optical band gap energy Eg [eV] | % decrease in band gap energy | Urbach energy Eu [eV] |
|---|---|---|---|
Pristine | 3.15 | – | 0.17 |
5 × 10¹³ | 3.06 | 2.86 | 0.35 |
1 × 10¹⁴ | 2.94 | 6.67 | 0.68 |
5 × 10¹⁴ | 1.14 | 64 | 0.88 |
1 × 10¹⁵ | 1.10 | 65 | 0.90 |
5 × 10¹⁵ | 1.05 | 67 | 0.91 |