
Fig. 1
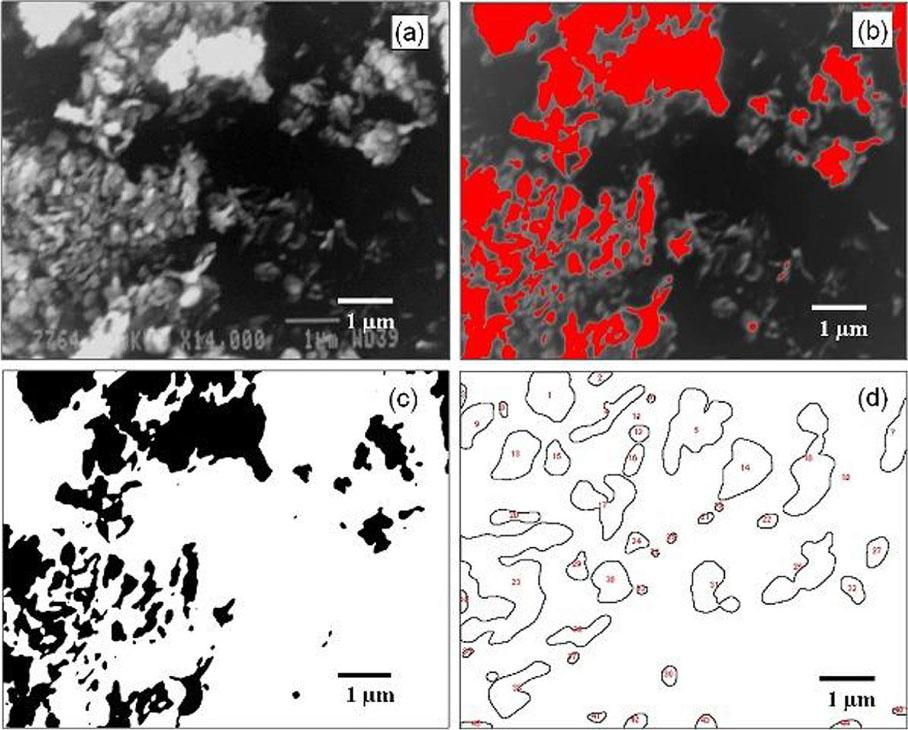
Fig. 2
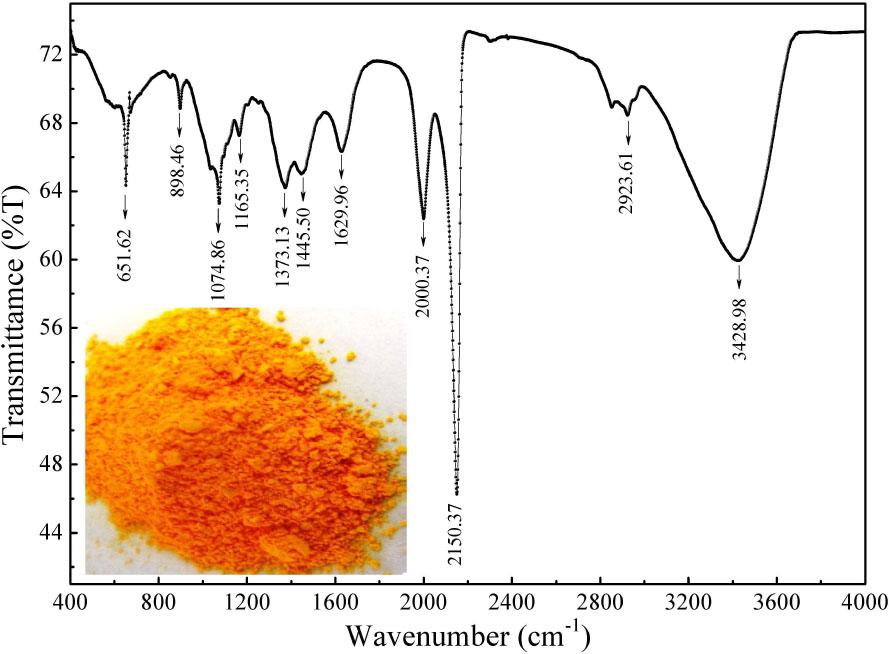
Fig. 3
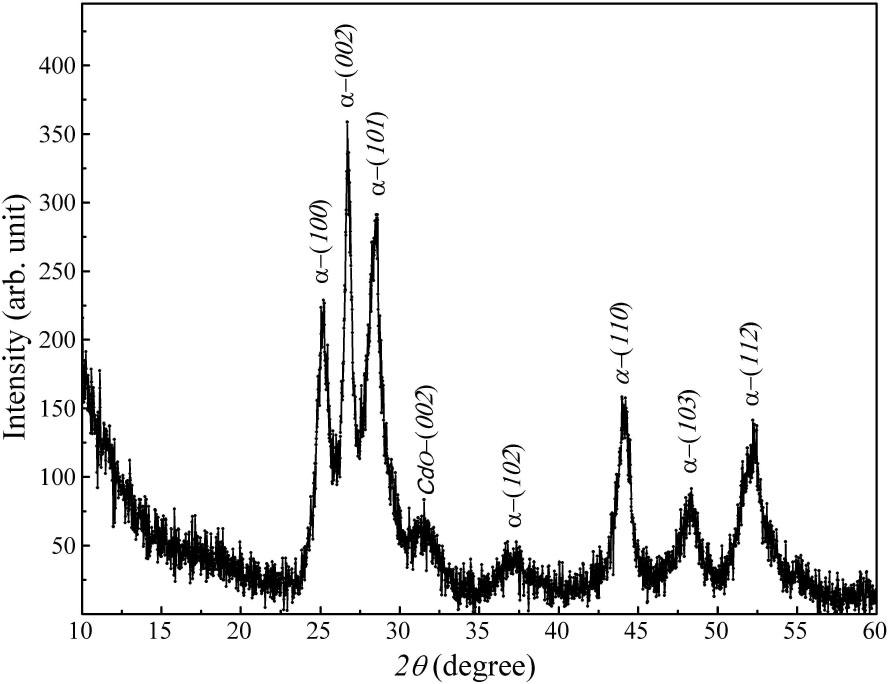
Fig. 4
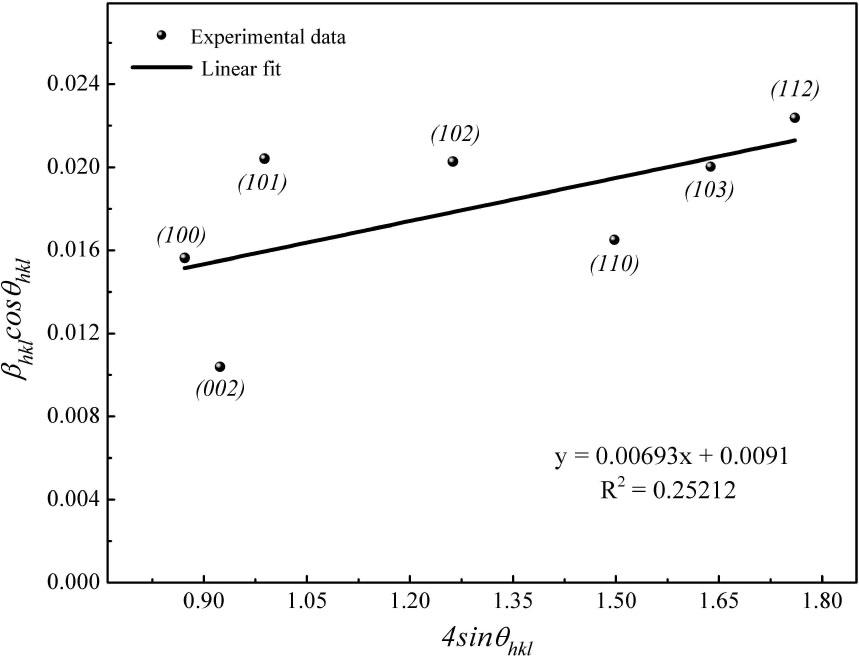
Fig. 5
Structural parameters for CdS nanoparticles with corresponding standard values_
| Observed values | Standard values | Miller planes | ||||
|---|---|---|---|---|---|---|
| 2θ [deg.] | dhkl [Å ] | Intensity | 2θ [deg.] | dhkl [Å ] | Intensity | |
| 25.17 | 3.535 | 60.72 | 24.85 | 3.582 | 59.21 | (1 0 0) |
| 26.74 | 3.331 | 100.00 | 26.55 | 3.357 | 42.68 | (0 0 2) |
| 28.44 | 3.135 | 79.94 | 28.23 | 3.160 | 100.00 | (1 0 1) |
| 37.10 | 2.421 | 13.75 | 36.68 | 2.439 | 25.83 | (1 0 2) |
| 44.08 | 2.053 | 43.97 | 43.76 | 2.068 | 45.25 | (1 1 0) |
| 48.21 | 1.886 | 24.41 | 47.92 | 1.892 | 45.29 | (1 0 3) |
| 52.18 | 1.751 | 39.21 | 51.92 | 1.761 | 15.27 | (1 1 2) |