
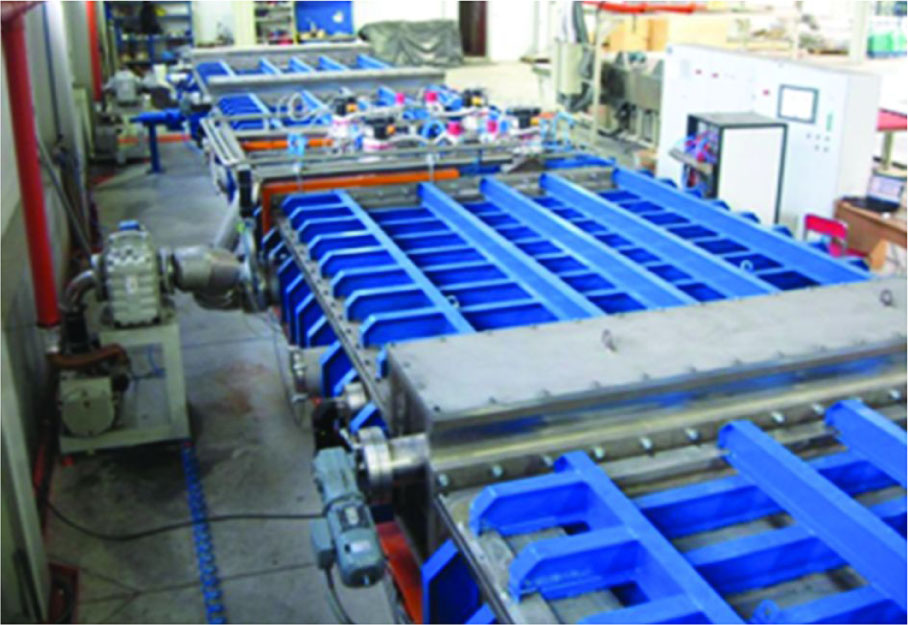
Fig. 1
Industrial facility for large area glasses covering built up and working at BOHAMET Company. The facility was used in the present work.
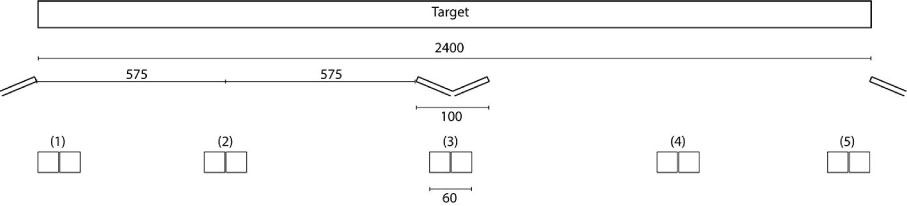
Fig. 2
Specimens location along the magnetron cath-ode. The numbered (1-5) positions were spe-cially chosen, taking into account the essential points with respect to the gas outlets (all of the dimensions are given in mm).
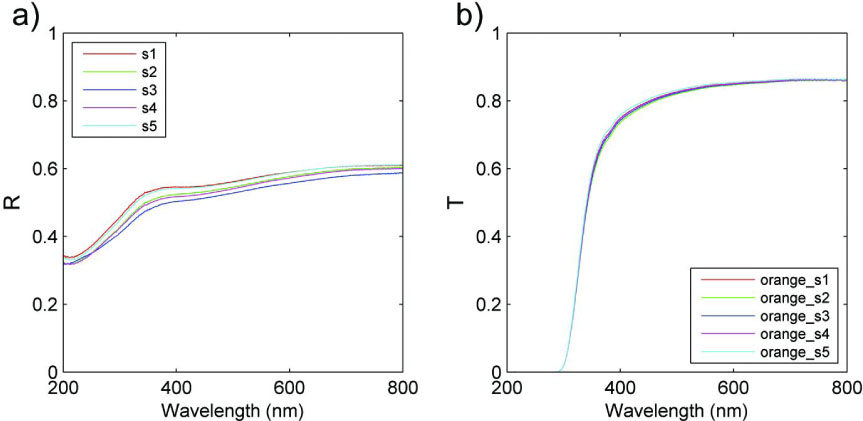
Fig. 3
Reflectance spectra for Ti samples (a) and trans-mittance spectra of transparent TiO₂ layers (b).
Table 1
Thickness and resistivity of the layers positioned along the target length.
| Layer type/position of specimen | 1 | 2 | 3 | 4 | 5 | |
|---|---|---|---|---|---|---|
| Ti | Thickness, nm | 131 | 152 | 150 | 149 | 141 |
| Resistance, Ohm | 13.48 | 11.55 | 13.01 | 11.53 | 11.41 | |
| T1O₂ on glass | Thickness, nm | 18.50 | 19.10 | 18.10 | 18.30 | 18.60 |
| 26.70 | 28.10 | 26.50 | 26.40 | 26.90 | ||
| 51.30 | 56.40 | 54.00 | 53.50 | 53.20 | ||
| TiO₂ on Ti/glass | Thickness, nm | 16.40 | 17.00 | 16.30 | 16.10 | 15.60 |
| 24.80 | 26.00 | 24.70 | 24.60 | 23.90 | ||
| 49.30 | 51.80 | 51.00 | 49.80 | 48.30 | ||
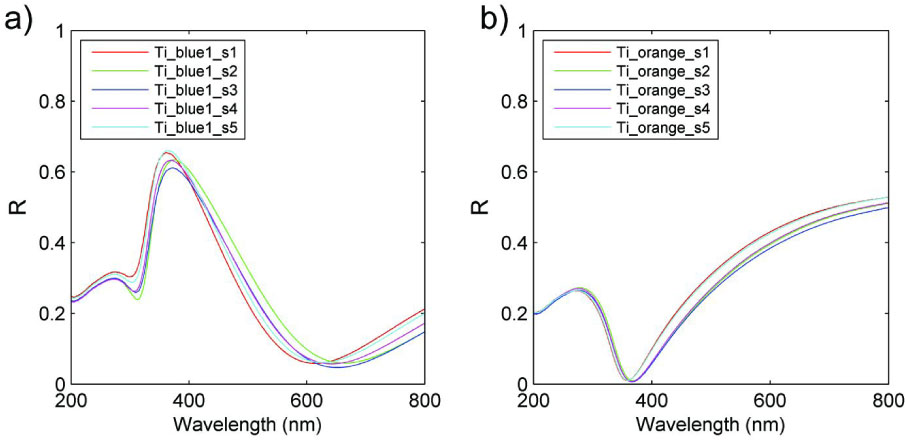
Fig. 4
Reflectance spectra of the colored TiO₂/Ti/glass coatings for the thinner (a) and thicker (b) tita-nium oxide layers.