
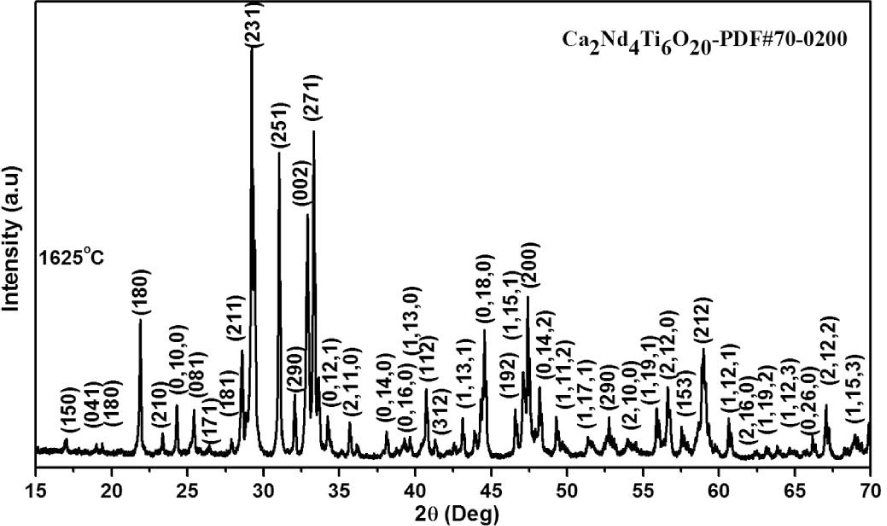
Fig. 1
X-ray diffraction pattern of CNT sintered at 1625 °C.
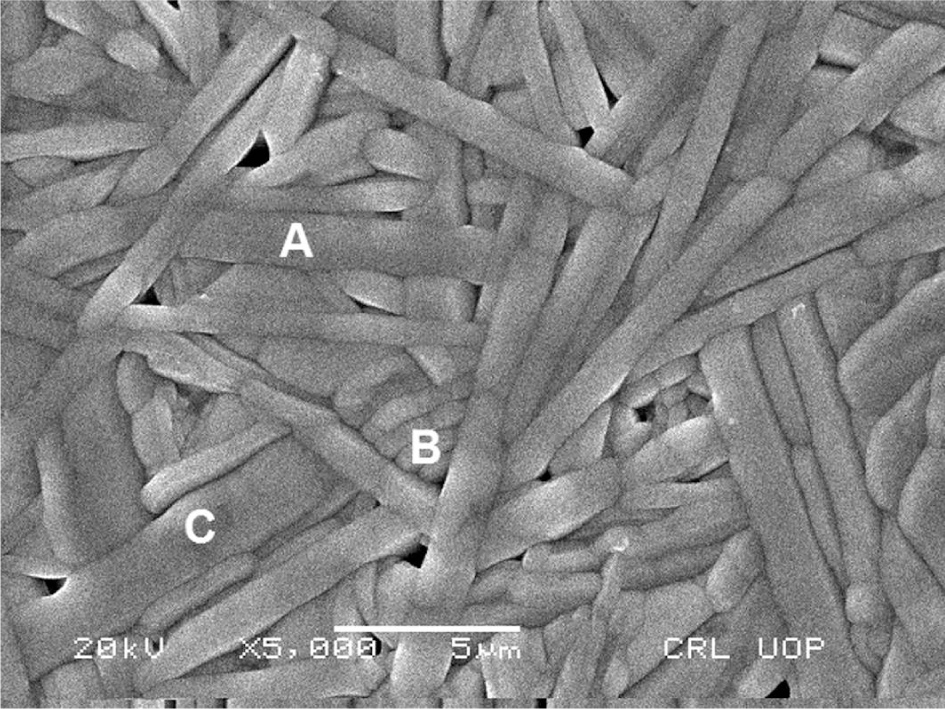
Fig. 2
Secondary electron SEM micrograph of CNT sintered at 1625 °C.
Table 2
EDX data of CNT sample sintered at 1625 °C.
| Elements | Ca [wt.%] | Ti [wt.%] | Nd [wt.%] |
|---|---|---|---|
| Grain (A) | 7.2 | 29.1 | 63.7 |
| Grain (B) | 7.9 | 30.3 | 61.7 |
| Grain (C) | 7.4 | 29.8 | 62.8 |
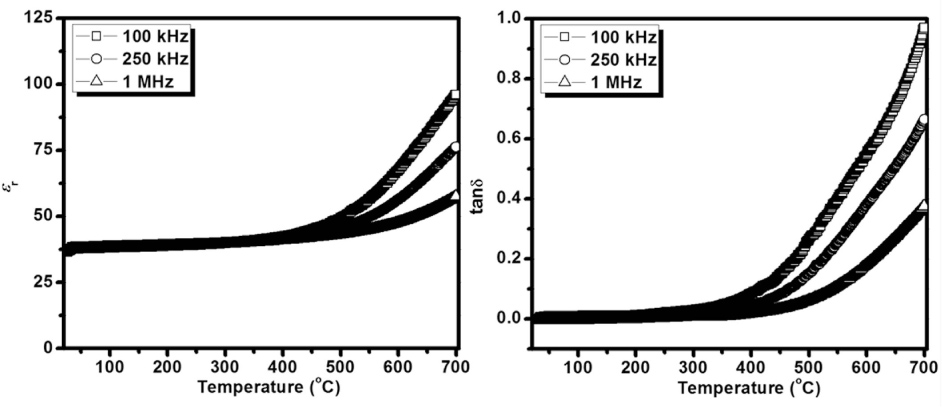
Fig. 3
Temperature dependence of ∊r and tanδ of CNT sample measured at different frequencies.
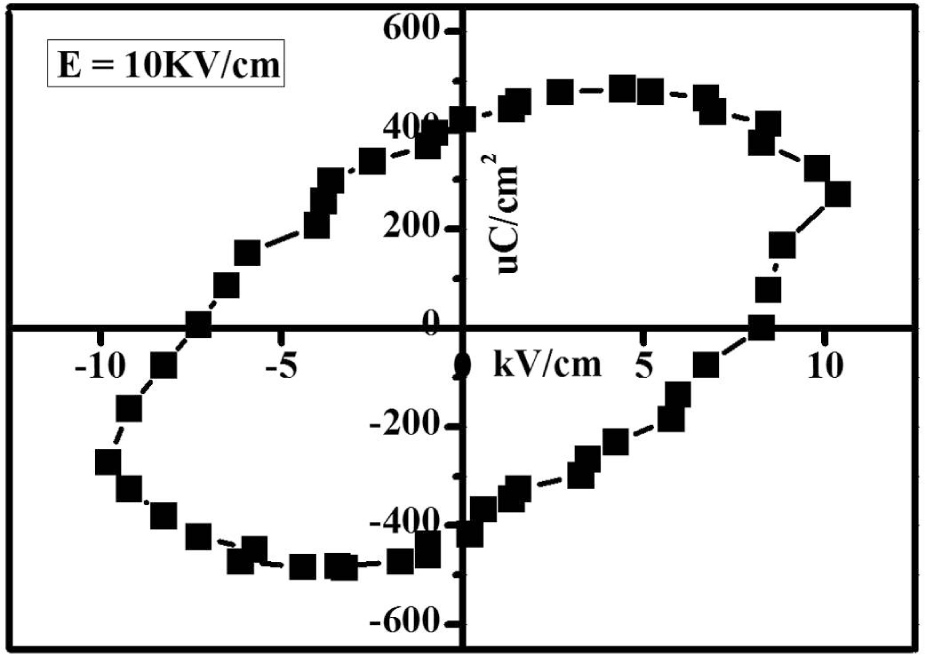
Fig. 4
P-E hysteresis loop of CNT sample.
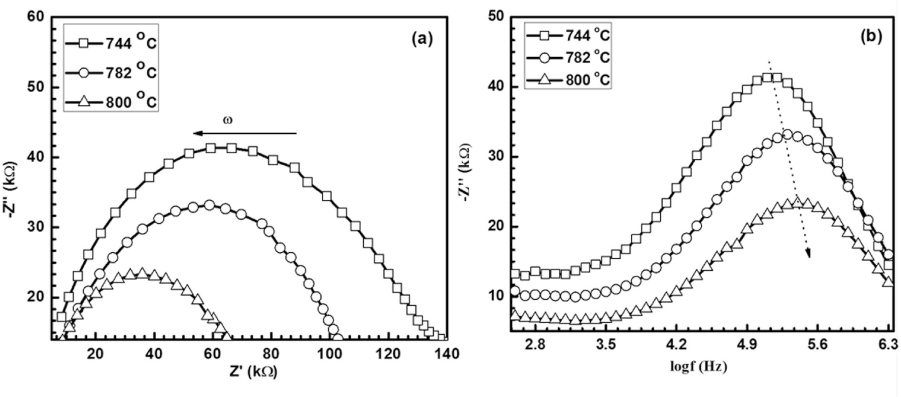
Fig. 5
(a) Plot of real part Z´ vs. imaginary part −Z˝ of the complex impedance Z* (b) spectroscopic plot of Z˝ and log f at different temperatures.
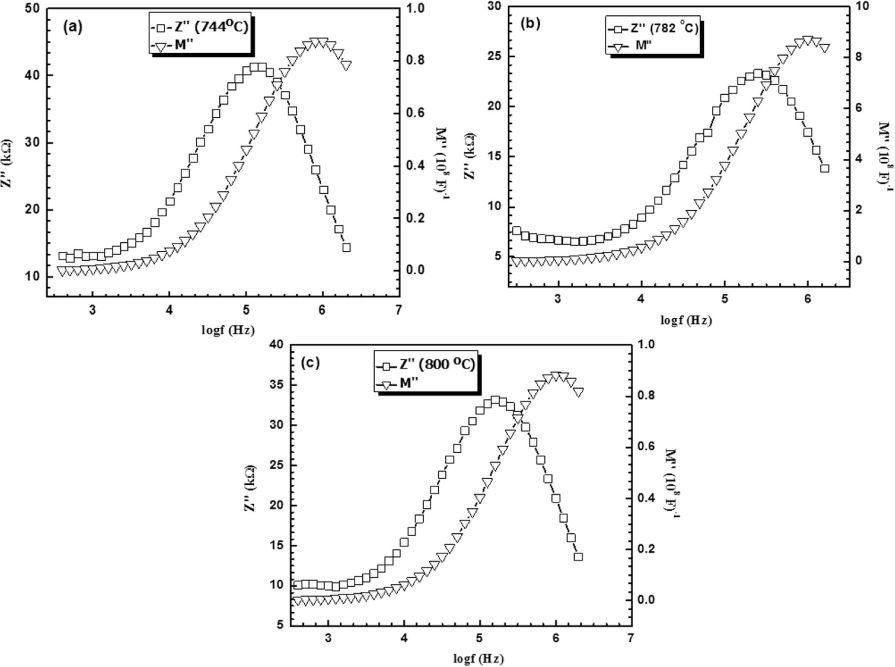
Fig. 6
Spectroscopic plots of impedance Z˝ and modulus M˝ at temperatures (a) 744 °C (b) 782 °C and (c) 800 °C.
Table 3
Values of R and C extracted from Z˝max and from M˝max.
| Temp. [°C] | Rgb [kW] | Cgb [pF] | Rg [kW] | Cg [pF] |
|---|---|---|---|---|
| Extracted | from Z˝max | Extracted | from M˝max | |
| 744 | 92.13 | 13.72 | 35.080 | 5.71 |
| 782 | 73.82 | 13.57 | 28.133 | 5.70 |
| 800 | 51.03 | 12.41 | 22.190 | 5.66 |
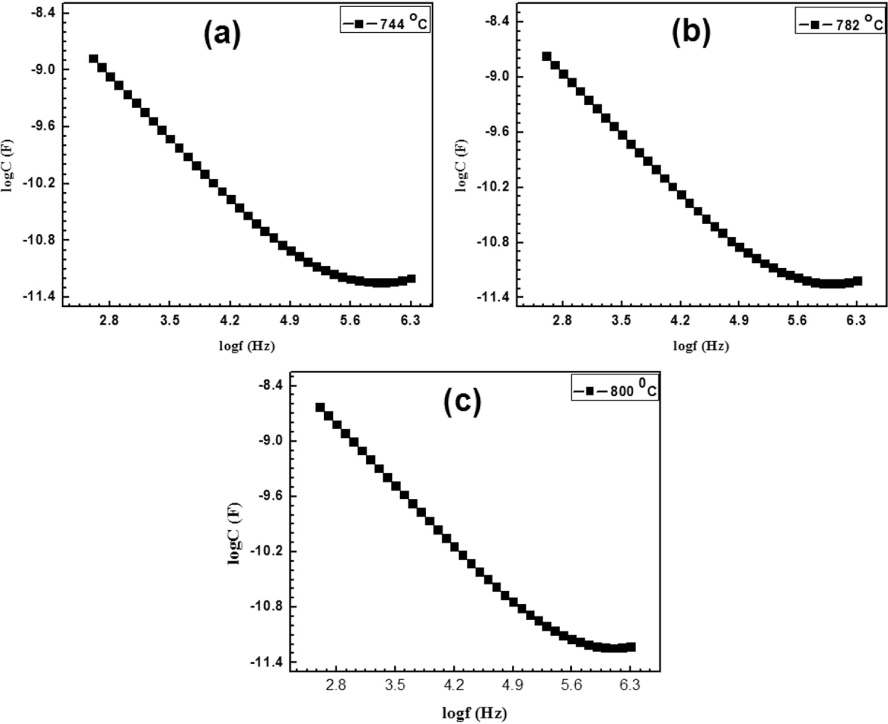
Fig. 7
Plots of frequency dependence of capacitance of grain and grain boundary regions at different temperatures.