
Table 1
Mechanical properties of the as-cast Cu–Sn–Fe alloys.
| As-cast Alloys | Tensile strength [MPa] | Mechanical elongation in [%] | |
|---|---|---|---|
| Cu–1Sn–5Fe | 316 | 5.3 | |
| Cu–2Sn–5Fe | 349 | 4.1 | |
| Cu–3Sn–5Fe | 380 | 3.5 | |
| Cu–5Sn–5Fe | 405 | 2.8 | |
| Cu–3Sn–10Fe | 430 | 2.0 |
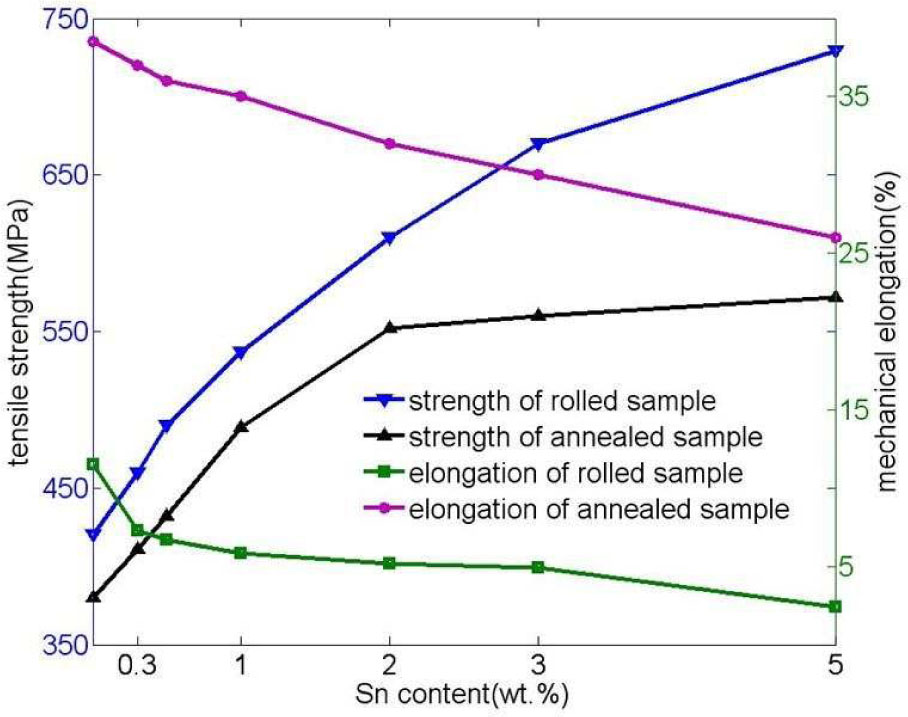
Fig. 1
The dependence of mechanical properties of the Cu–5Fe–xSn alloys on Sn content.
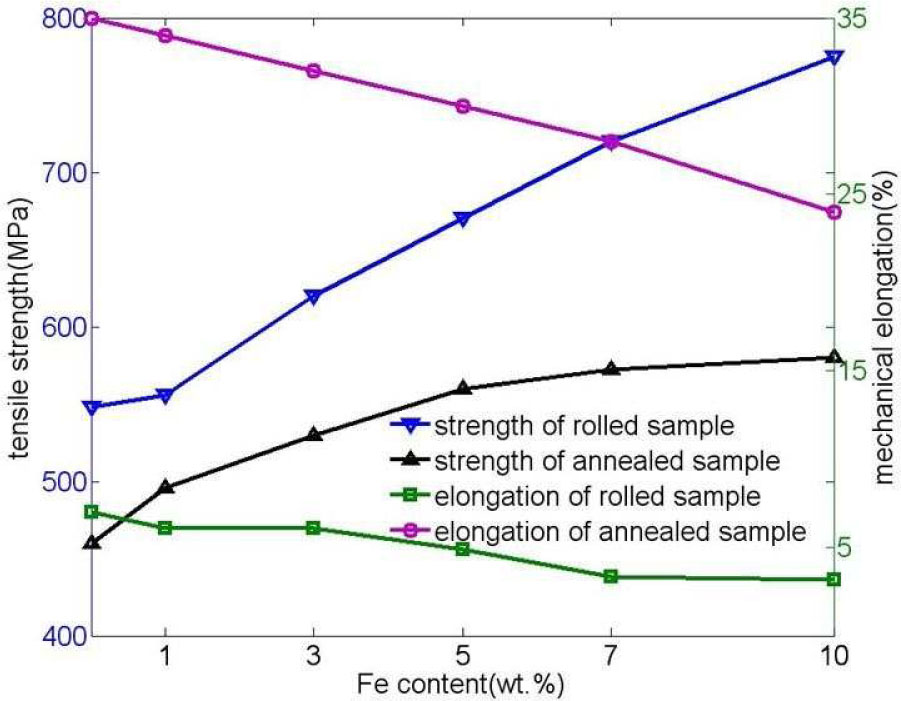
Fig. 2
The dependence of mechanical properties of the Cu–3Sn–xFe alloys on Fe content.
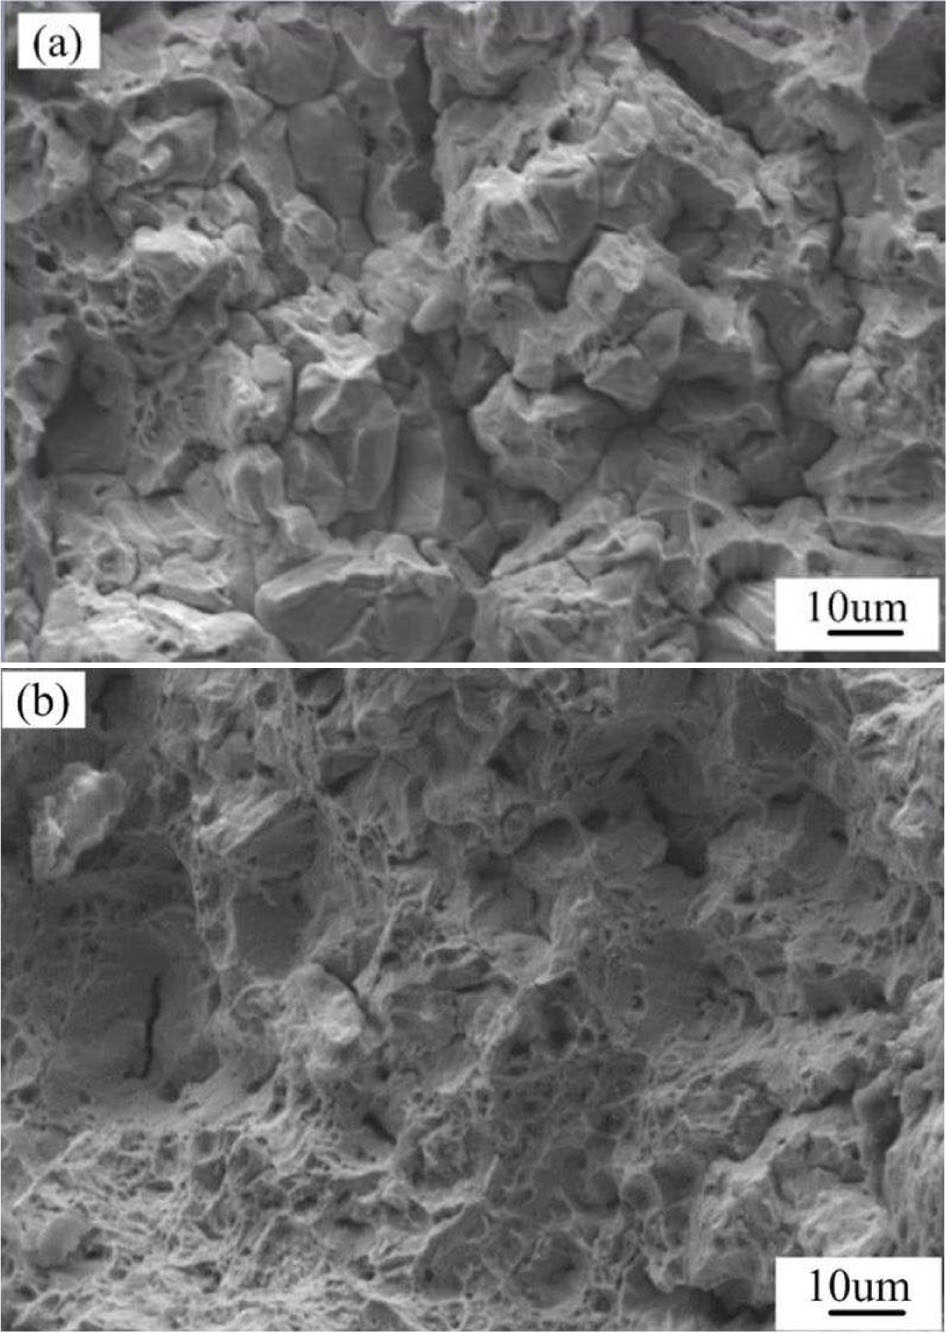
Fig. 3
SEM images of tension fractures of Cu–2Sn–5Fe alloys: (a) fracture surface of the rolled Cu–2Sn–5Fealloy, (b) fracture surface of the annealed Cu–2Sn–5Fe alloy.
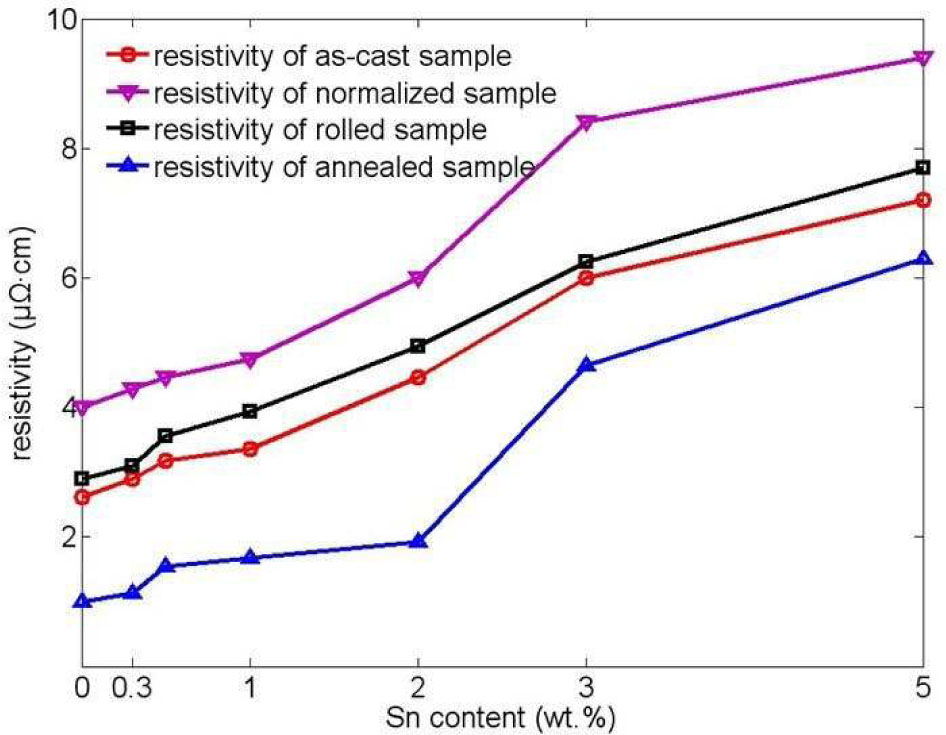
Fig. 4
Influence of the Sn content on resistivity of the Cu–5Fe–xSn alloy.
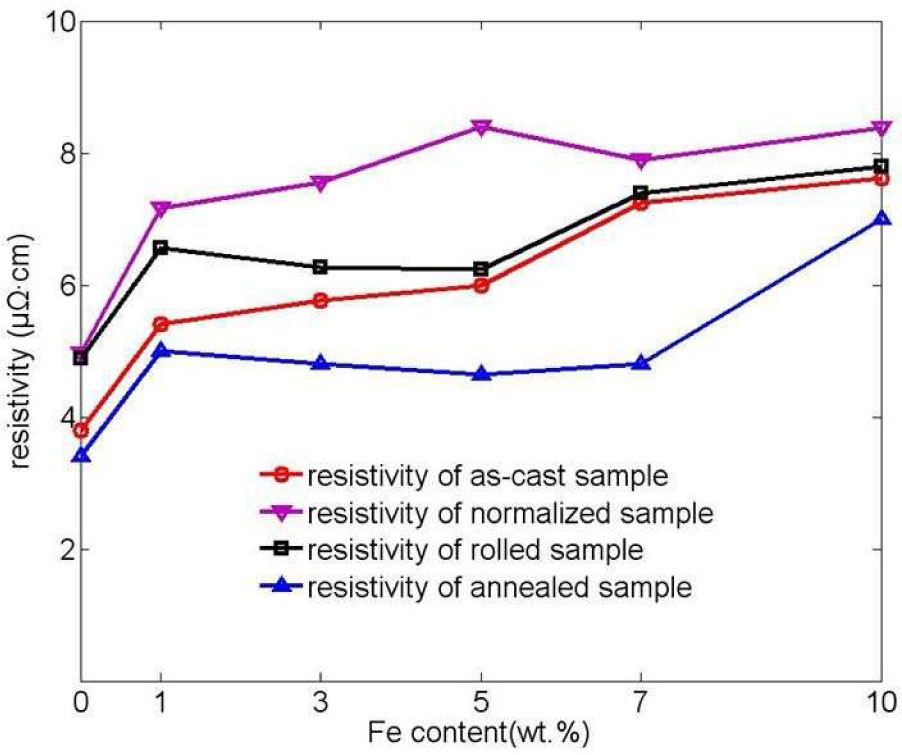
Fig. 5
Influence of the Fe content on resistivity of the Cu–3Sn–xFe alloy.
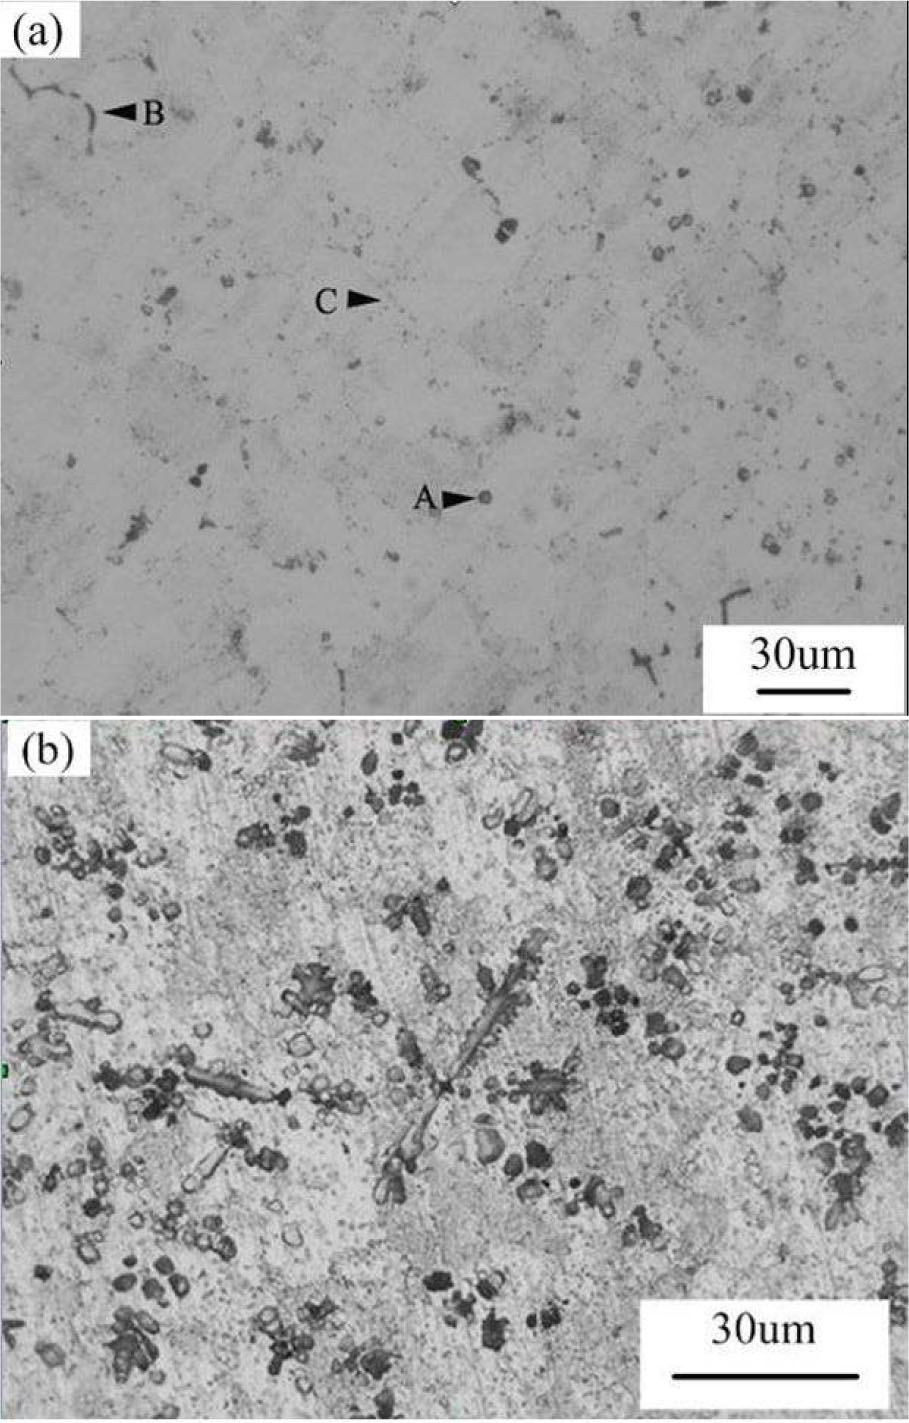
Fig. 6
Microstructures of the as-cast Cu–Sn–Fe alloys: (a) Cu–2Sn–5Fe alloy, (b) Cu–3Sn–10Fe alloy.
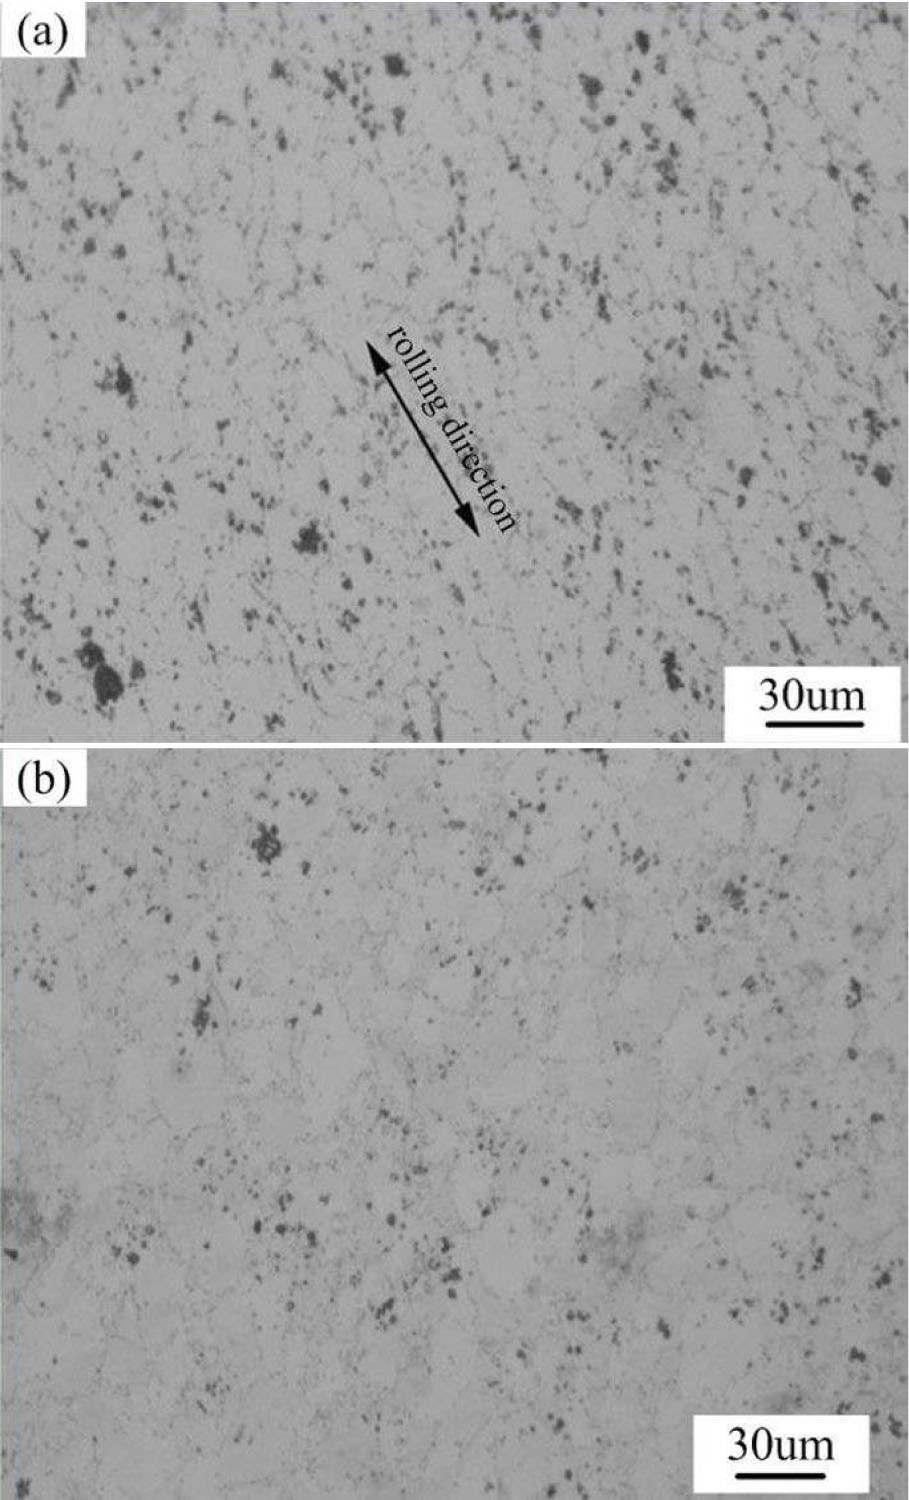
Fig. 7
Microstructures of the treated Cu–2Sn–5Fe alloys: (a) the cold-rolled Cu–2Sn–5Fe alloy, (b) the annealed Cu–2Sn–5Fe alloy.