
Fig. 1
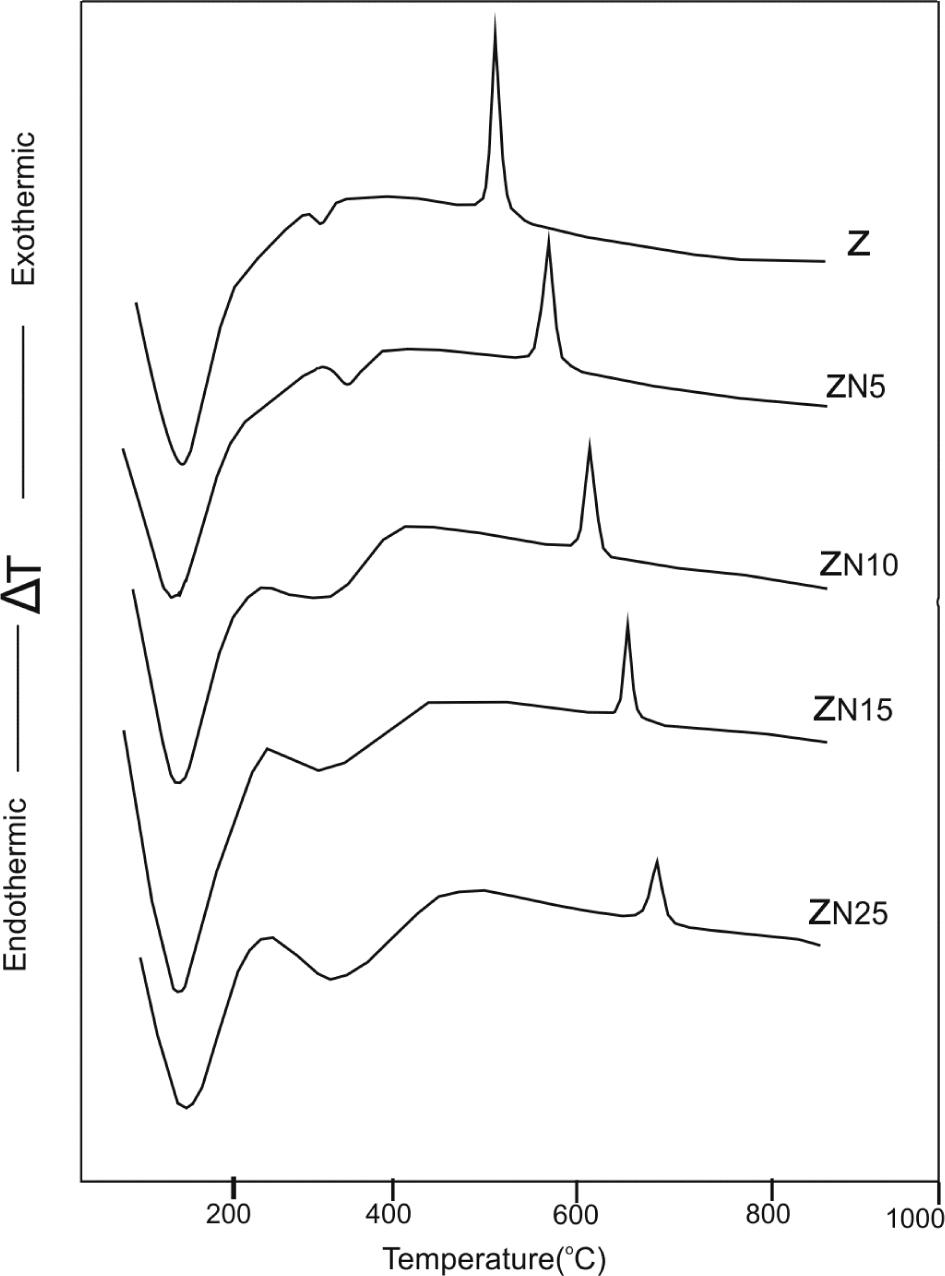
Fig. 2
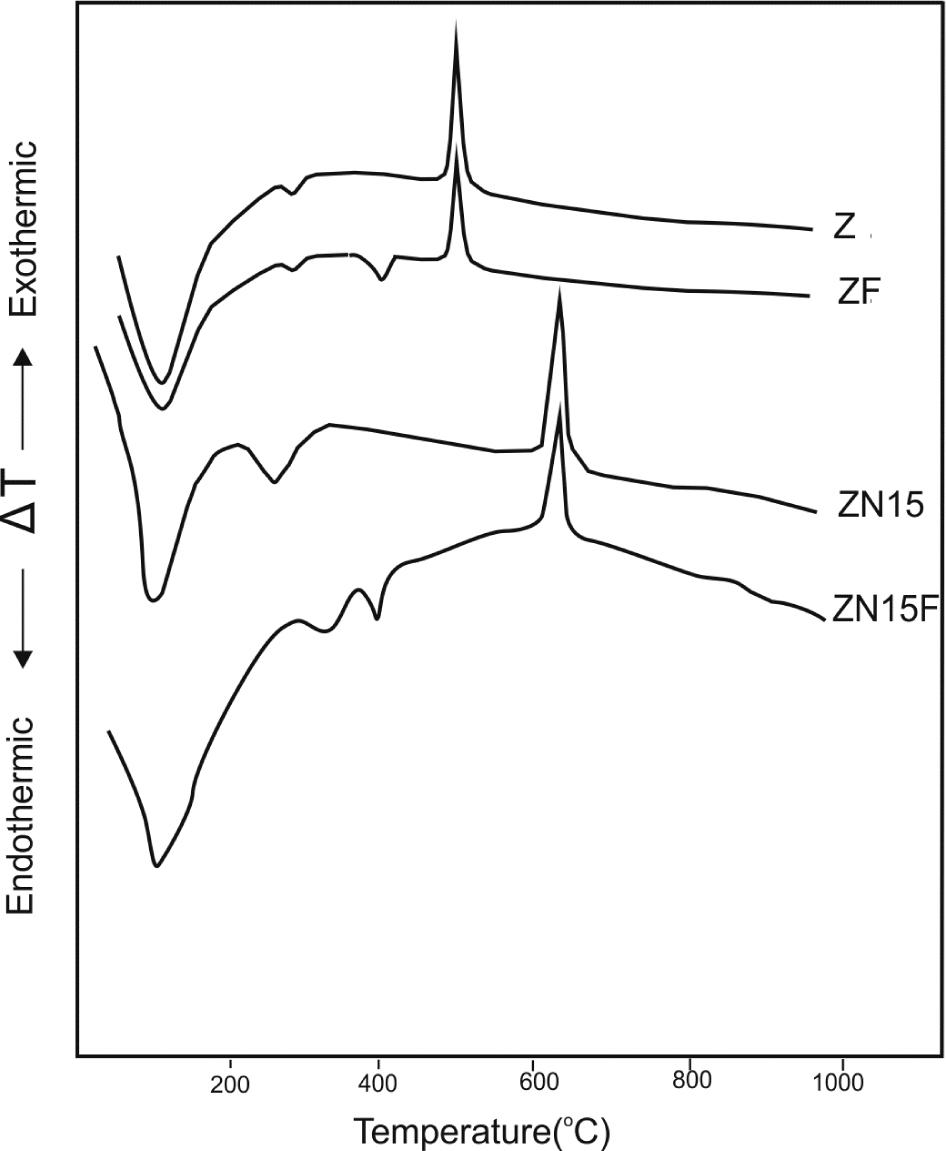
Fig. 3

Fig. 4
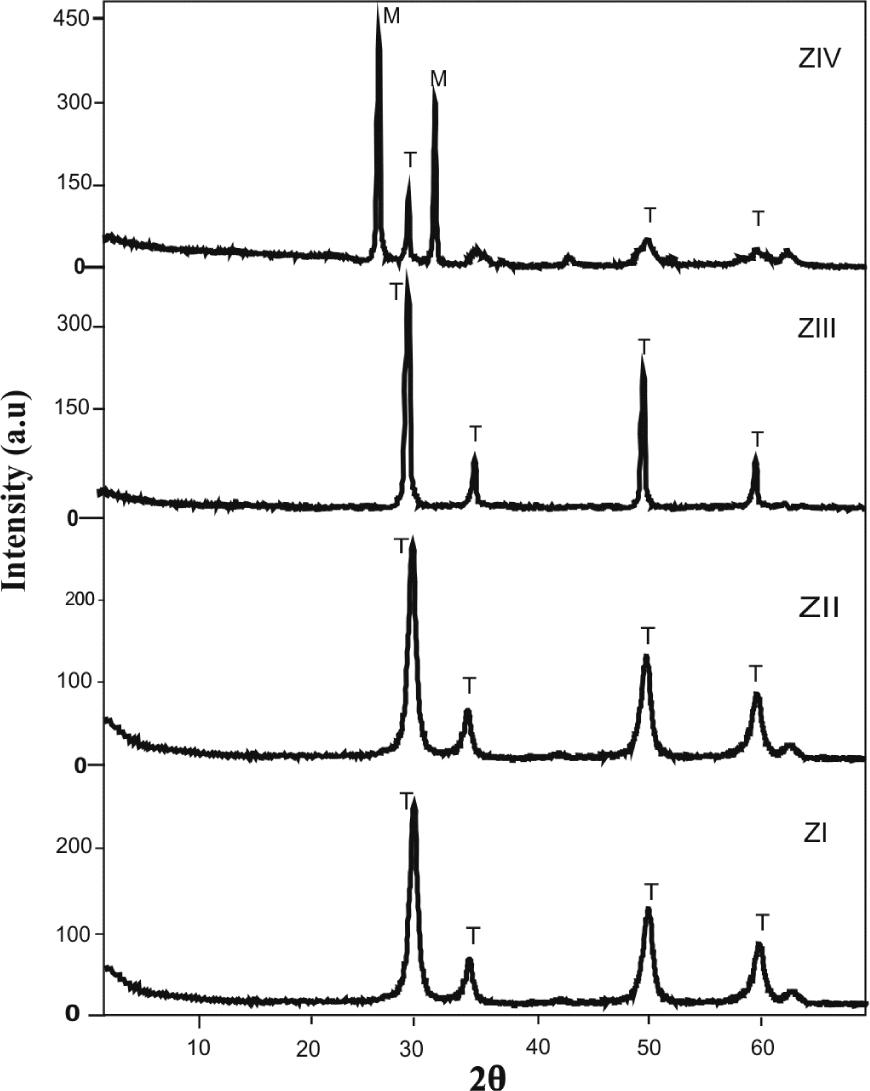
Fig. 5
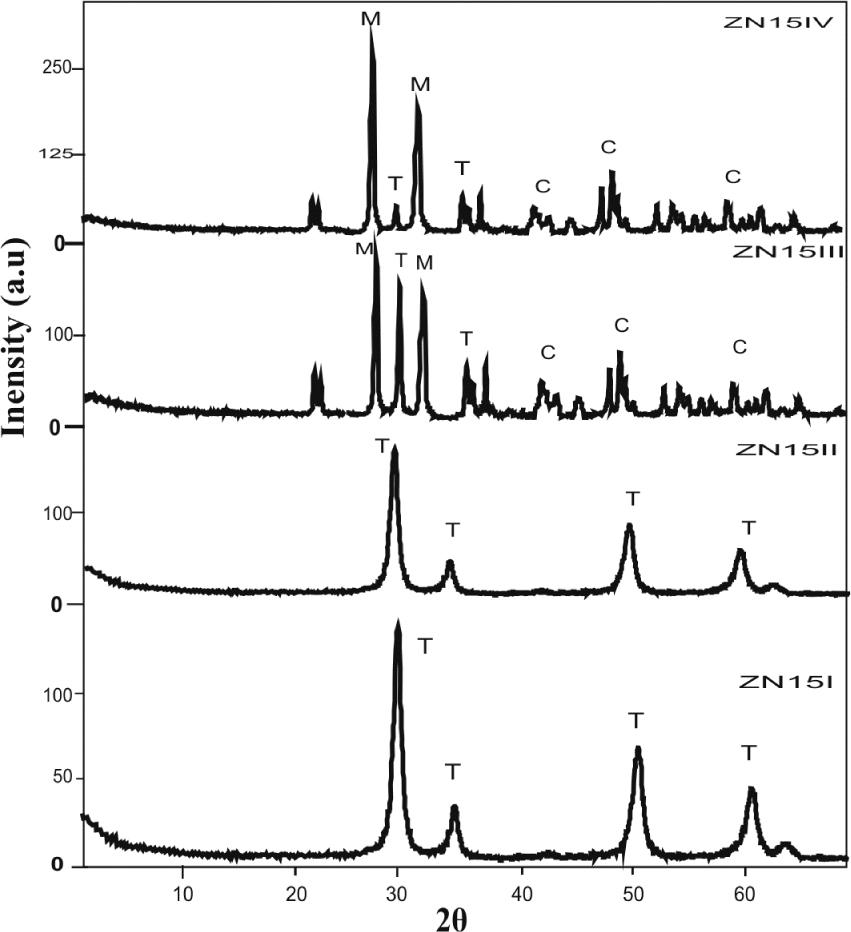
Fig. 6
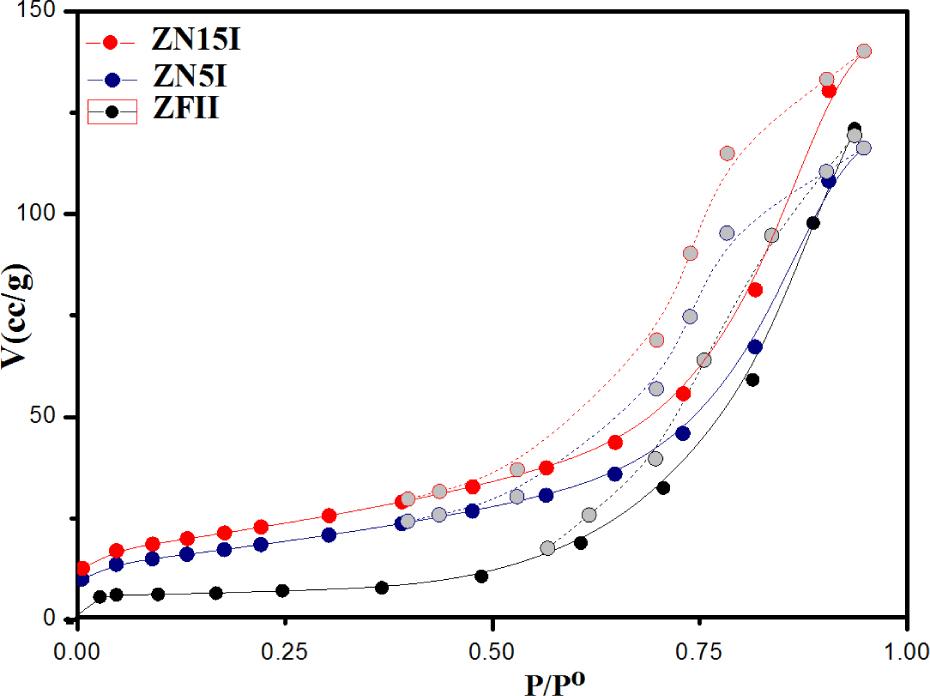
Fig. 7
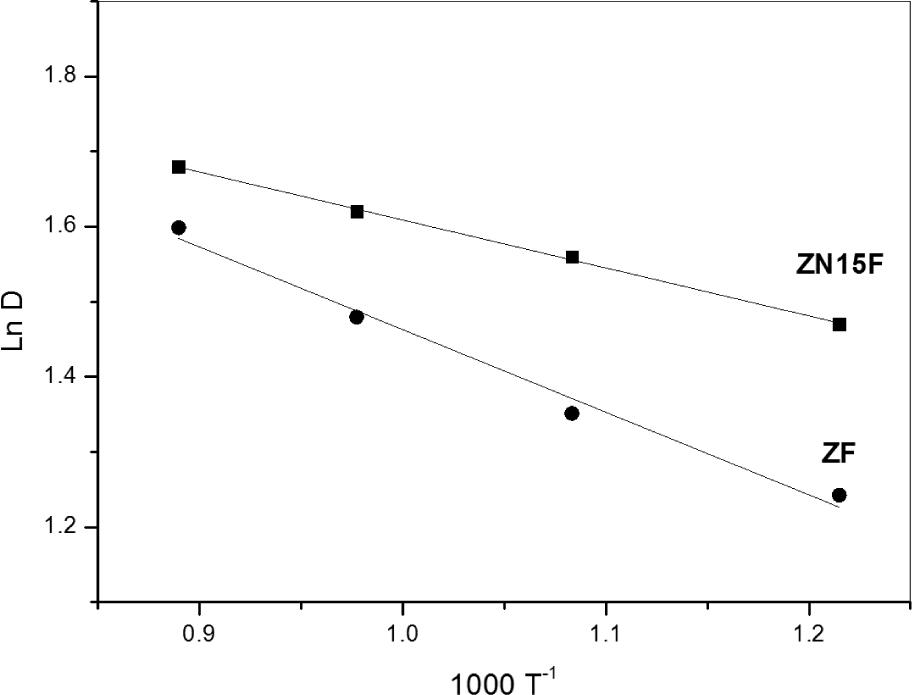
Fig. 8
Crystal structure and crystal size of the samples doped with fluoride ions_
| Catalyst | Phases detected M: monoclinic ZrO2, T: tetragonal ZrO2 and C: cubic NiO. | Major phase [%] | Crystal size [D] of major phase [nm] | Degree of crystallinity [a.u.] The peak height of the major line of each phase was taken as a measure of the degree of crystallinity of the ZrO2. | Es [kJ_mol−1] | |
|---|---|---|---|---|---|---|
| M(2θ = 28.2) | T(2 θ = 30.3) | |||||
| ZFI | T | 100 (T) | 30.0 | 280 | – | |
| ZFII | T | 100 (T) | 36.8 | 265 | – | 13.21 |
| ZFIII | T | 100 (T) | 42.0 | 290 | – | |
| ZFIV | M+T | 86.2(M) | 48.5 | 110 | 210 | |
| ZN15FI | T | 100 (T) | 18.0 | 130 | – | |
| ZN15FII | T | 100 (T) | 22.0 | 212 | – | 23.16 |
| ZN15FIII | M+T+C | 73.6(M) | 30.0 | 140 | 118 | |
| ZN15FIV | M+T+C | 85.5(M) | 41.0 | 24 | 160 | |
Crystal structure and crystal size of undoped catalysts_
| Catalyst | Phases detected M: monoclinic ZrO2, T: tetragonal ZrO2 and C: cubic NiO. | Major phase [%] | Crystal size (D) of major phase [nm] | Degree of crystallinity [a.u.] The peak height of the major line of each phase was taken as a measure of the degree of crystallinity of the ZrO2. | Es [kJ_mol−1] | |
|---|---|---|---|---|---|---|
| M(2θ = 28.2) | T(2θ = 30.3) | |||||
| ZI | T | 100(T) | 29.5 | 225 | – | |
| ZII | T | 100(T) | 38.0 | 268 | – | 13.8 |
| ZIII | T | 100 (T) | 44.5 | 380 | – | |
| ZIV | M+T | 83.8(M) | 49.5 | 130 | 300 | |
| ZN5I | T | 100(T) | 19.5 | 210 | – | |
| ZN10I | T | 100(T) | 23.4 | 190 | – | |
| ZN15I | T | 100(T) | 29.5 | 145 | – | |
| ZN25I | T | 100(T) | 39.5 | 36 | – | |
| ZN15I | T | 100(T) | 29.5 | 145 | – | |
| ZN15II | T | 100(T) | 21.4 | 282 | – | 24.89 |
| ZN15III | M+T+C | 64.1(M) | 31.0 | 178 | 195 | |
| ZN15IV | M+T+C | 91.3(M) | 40.5 | 48 | 343 | |
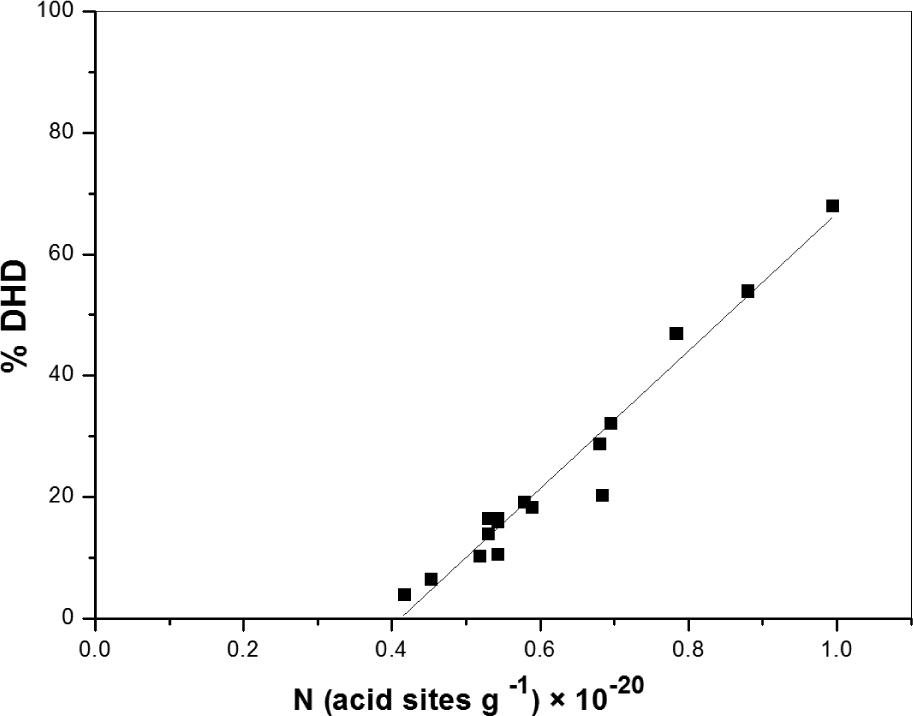
Surface characteristics, acidic and catalytic properties of the investigated catalysts_
| Sample | SBET [m2·g−1] | St [m2·g−1] | Vp [ml·g−1] | ¯r [A˚ ] | Ei [mV] | N (acid sites g−1) × 10−20 | DHD [%] | DHG [%] |
|---|---|---|---|---|---|---|---|---|
| ZI | 76.03 | 70.5 | 0.21 | 54.4 | 41 | 0.72 | 37.3 | 0 |
| ZII | 58.0 | 58.2 | 0.18 | 56.7 | 35 | 0.680 | 28.8 | 0 |
| ZIII | 50.6 | 28.4 | 0.13 | 72.2 | 30 | 0.590 | 18.4 | 0 |
| ZIV | 18 | 11.8 | 0.09 | 96.0 | 13 | 0.518 | 10.4 | 0 |
| ZN5I | 98.6 | 100.2 | 0.34 | 96.08 | 52 | 0.578 | 20.4 | 14.6 |
| ZN10I | 127.6 | 130.4 | 0.38 | 71.37 | 62 | 0.530 | 19.2 | 20.4 |
| ZN15I | 138.0 | 144.0 | 0.342 | 53.46 | 70 | 0.542 | 16.5 | 28.6 |
| ZN25I | 100.0 | 98.0 | 0.159 | 31.0 | 78 | 0.430 | 10.6 | 38.0 |
| ZN15I | 138.0 | 144.0 | 0.342 | 53.46 | 70 | 0.542 | 16.5 | 28.6 |
| ZN15II | 80.0 | 78.6 | 0.26 | 59.8 | 71 | 0.542 | 16.0 | 27.8 |
| ZN15III | 36.0 | 34.4 | 0.18 | 68.53 | 56 | 0.452 | 6.6 | 9.6 |
| ZN15IV | 20.4 | 18.0 | 0.114 | 72.0 | 44 | 0.380 | 4.0 | 6.0 |
| ZFI | 70.6 | 69.5 | 0.206 | 58.3 | 81 | 0.994 | 68.0 | 0 |
| ZFII | 50.4 | 49.0 | 0.189 | 75.0 | 72 | 0.78 | 47.0 | 0 |
| ZFIII | 27.8 | 31.0 | 0.14 | 90.3 | 63 | 0.693 | 32.3 | 0 |
| ZFIV | 12.4 | 20.4 | 0.102 | 113 | 66 | 0.530 | 14.0 | 0 |
| ZN15FI | 118.0 | 117.6 | 0.306 | 51.8 | 98 | 0.879 | 54.0 | 12.0 |