
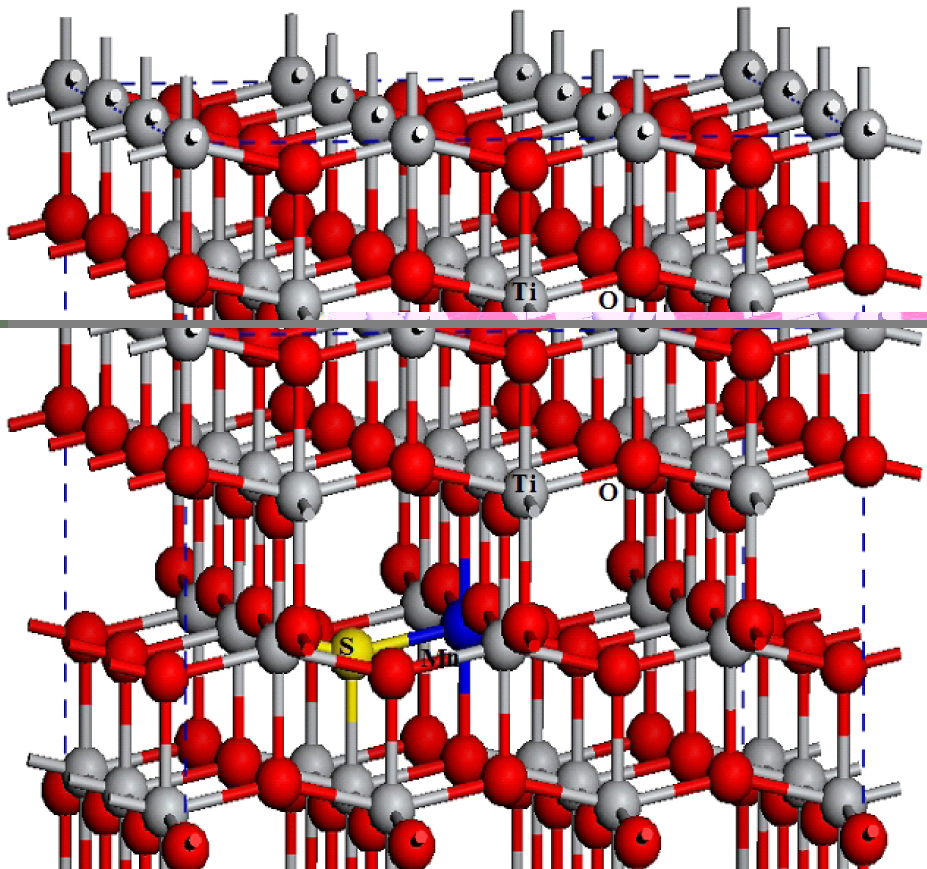
Fig. 1
Structural model of the Mn–S/TiO2.
Table 1
Formation energies (eV) Eform for Mn, S, and Mn–S co-doped TiO2.
| Eform | Ti-rich | O-rich |
|---|---|---|
| Mn-doped | 7.00083 | –3.60248 |
| S-doped | 3.96403 | 9.26558 |
| Mn–S codoped | 9.99344 | 4.69175 |
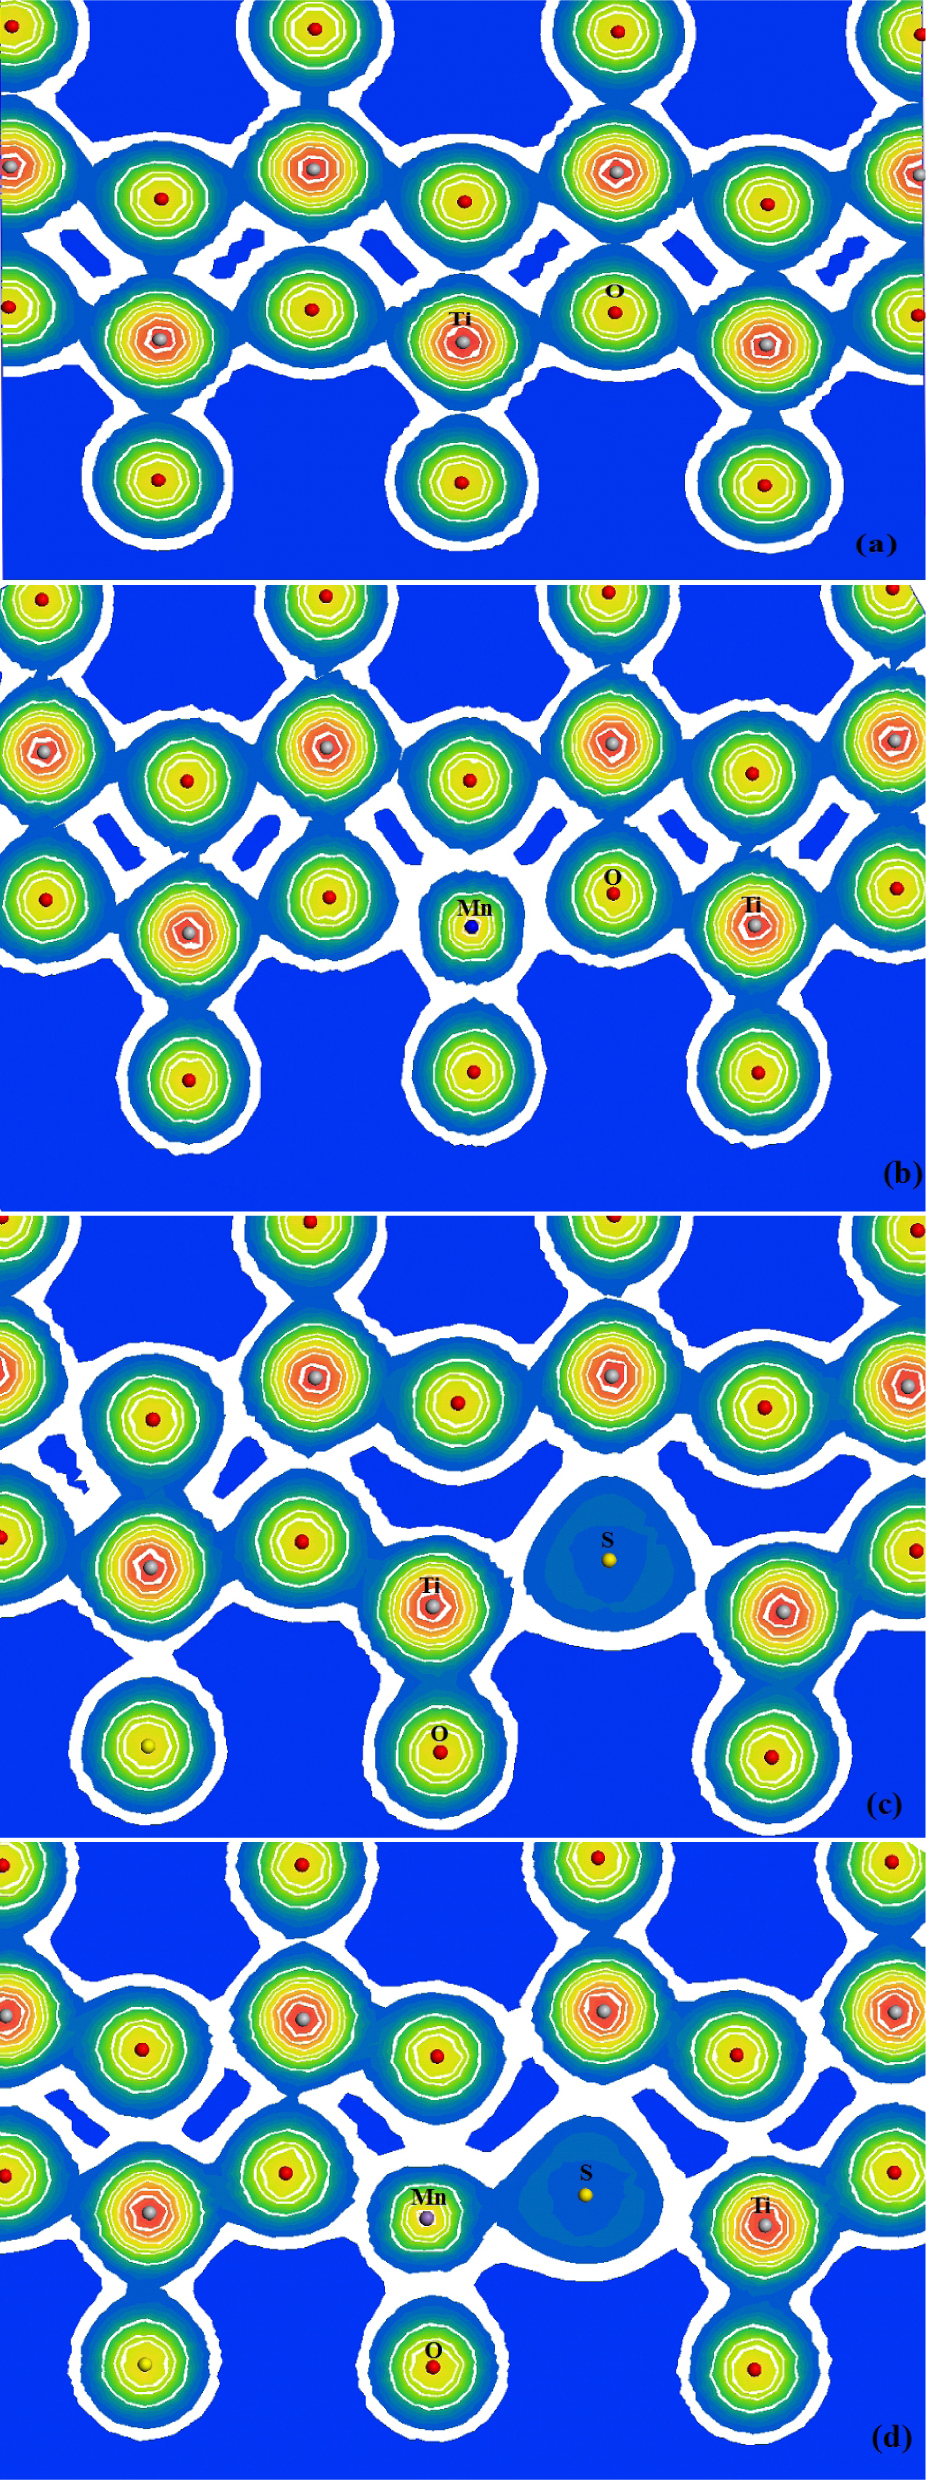
Fig. 2
Two-dimensional profiles of (a) pure TiO2, (b) Mn/TiO2, (c) S/TiO2, (d) Mn–S/TiO2.
Table 2
Atomic populations of doped TiO2 supercell.
| Species | s | p | d | Total | charge [e] |
|---|---|---|---|---|---|
| Mn/TiO2:Mn | 0.30 | 0.32 | 5.44 | 6.06 | 0.94 |
| S/TiO2:S | 1.80 | 4.54 | 0.00 | 6.34 | -0.34 |
| Mn–S/ TiO2:Mn | 0.29 | 0.36 | 5.59 | 6.24 | 0.76 |
| Mn–S/ TiO2:S | 1.82 | 4.35 | 0.00 | 6.17 | -0.17 |
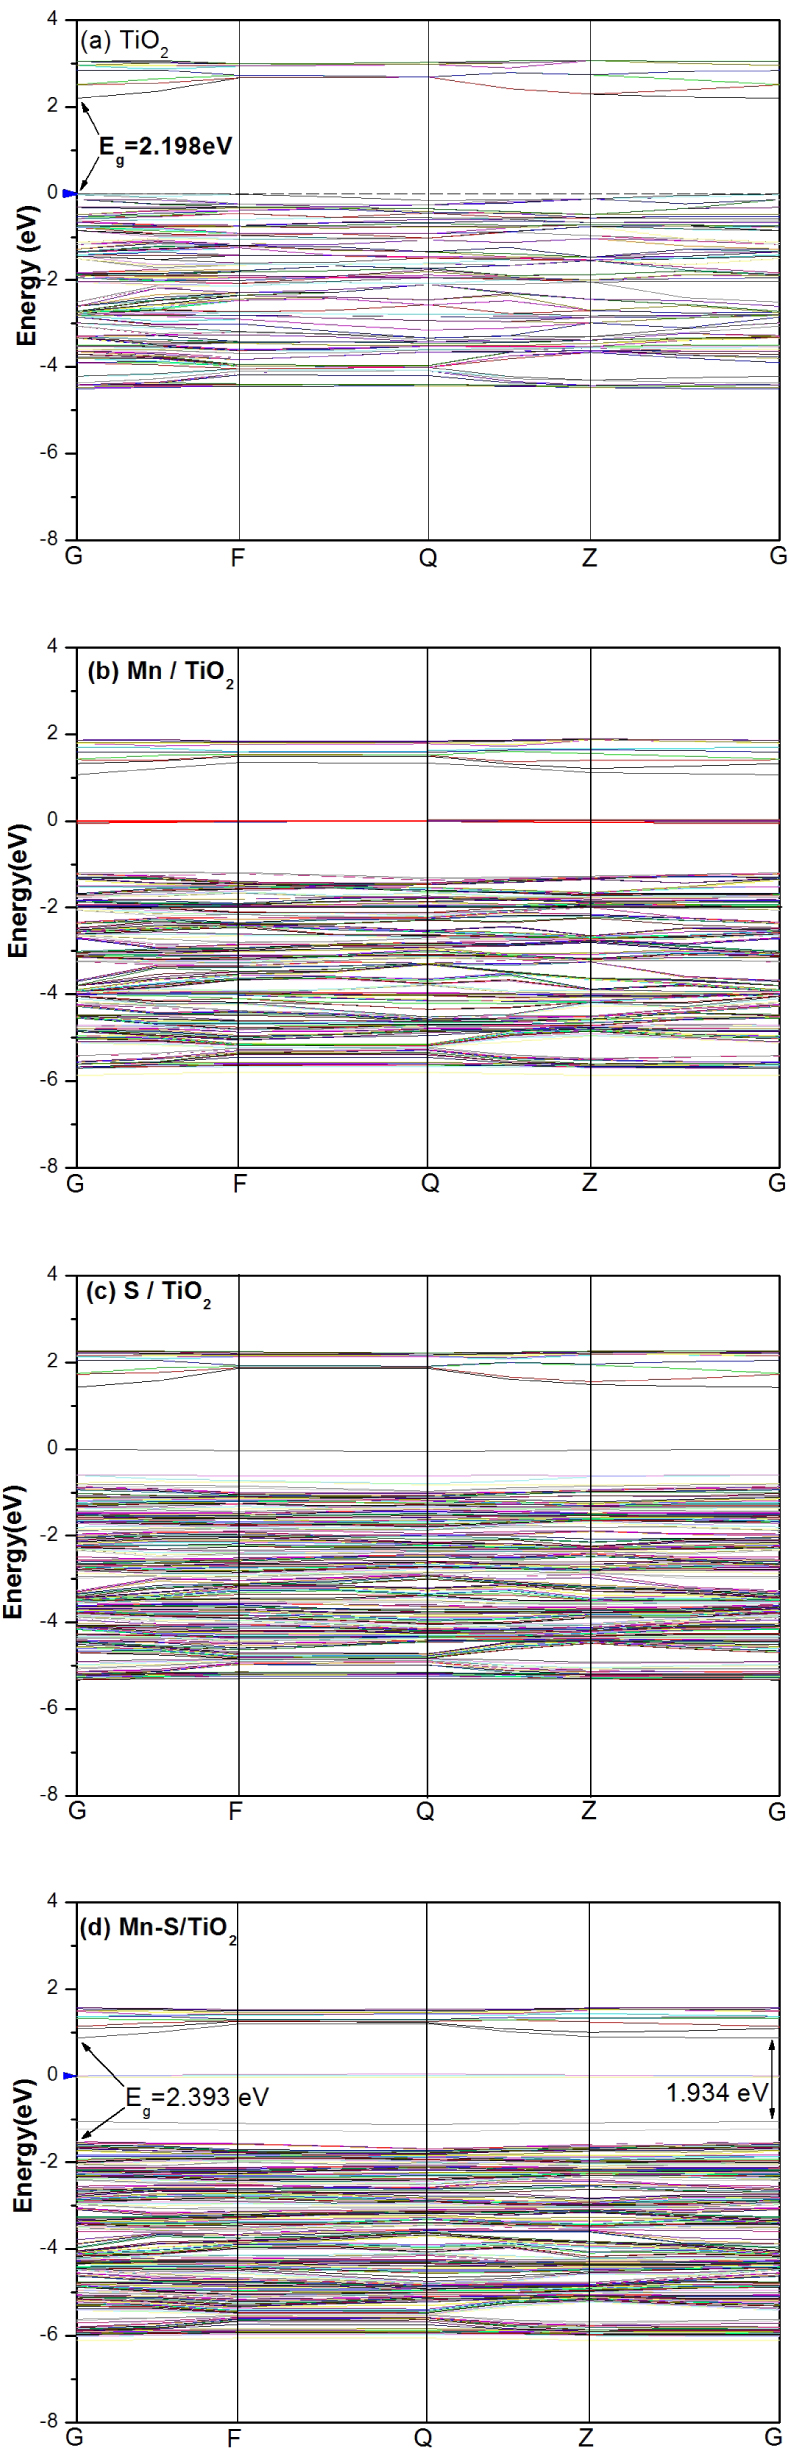
Fig. 3
Band structures of (a) pure TiO2, (b) Mn/TiO2, (c) S/TiO2, (d) Mn–S/TiO2.
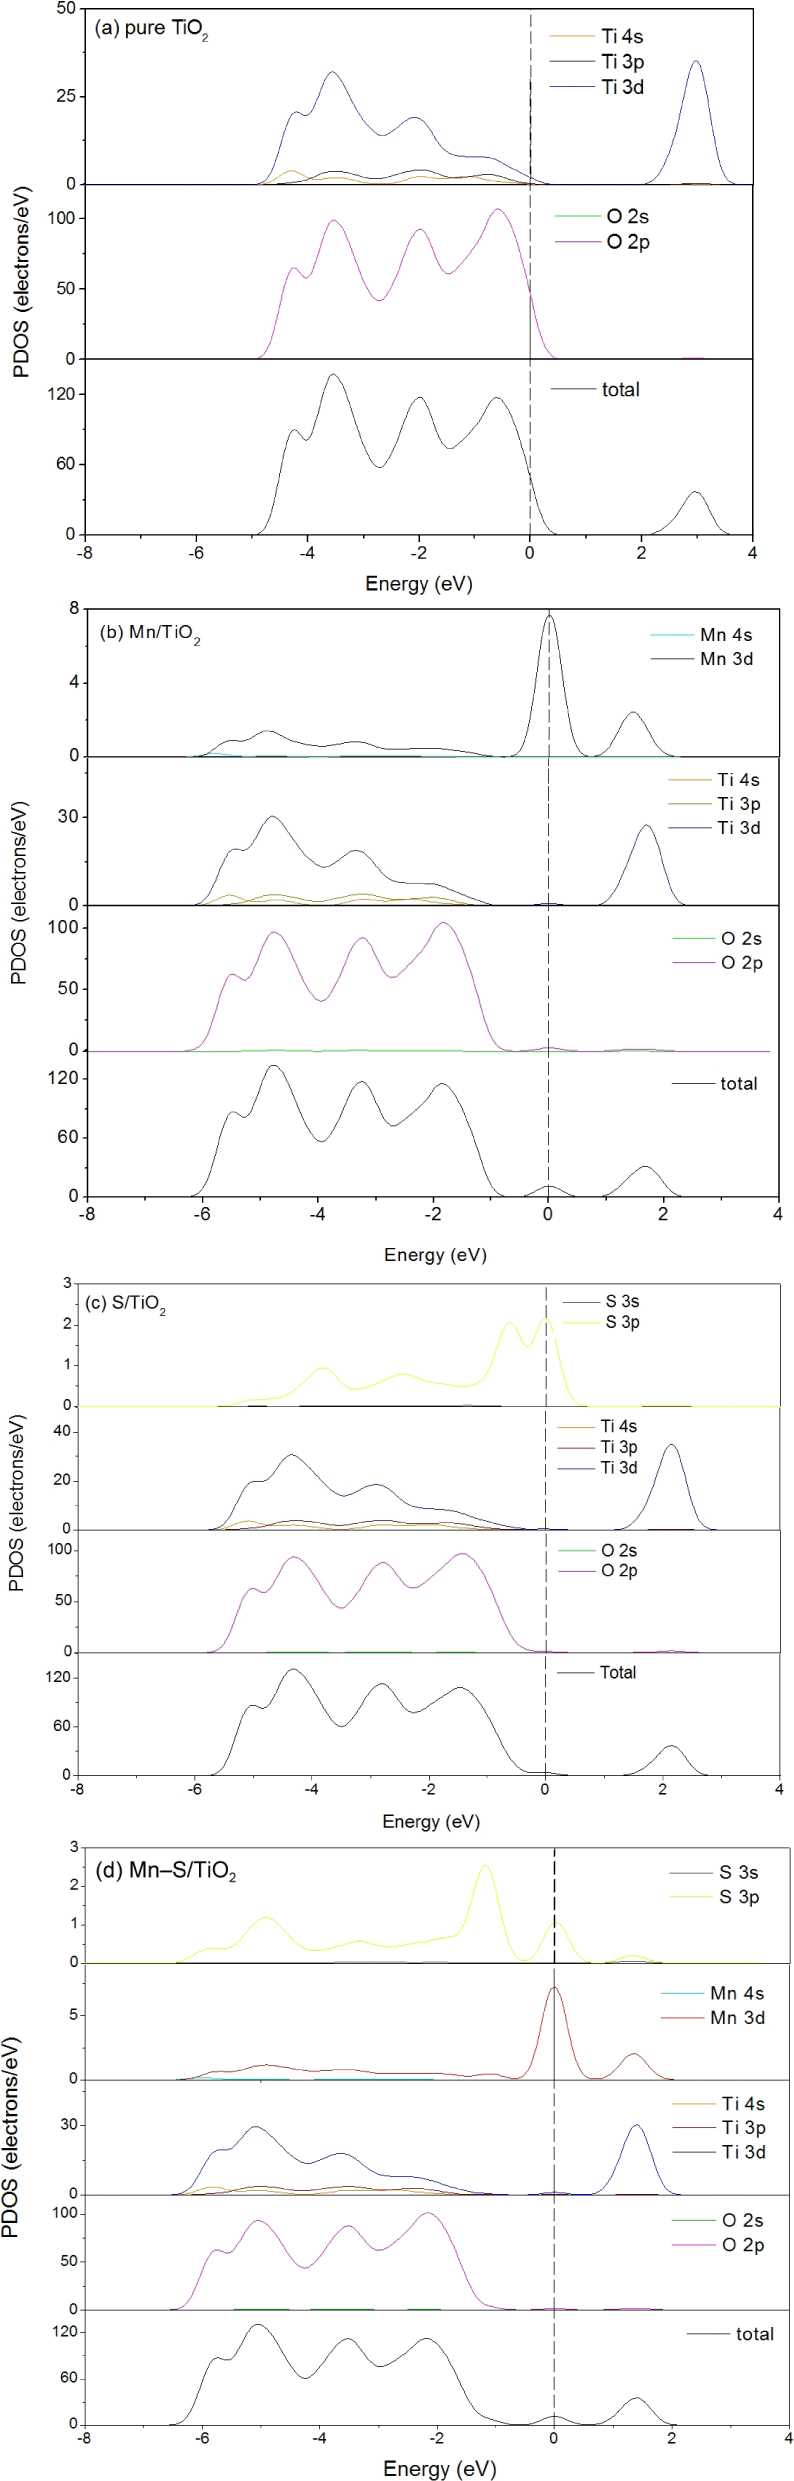
Fig. 4
PDOS of (a) pure TiO2, (b) Mn/TiO2, (c) S/TiO2, (d) Mn–S/TiO2.
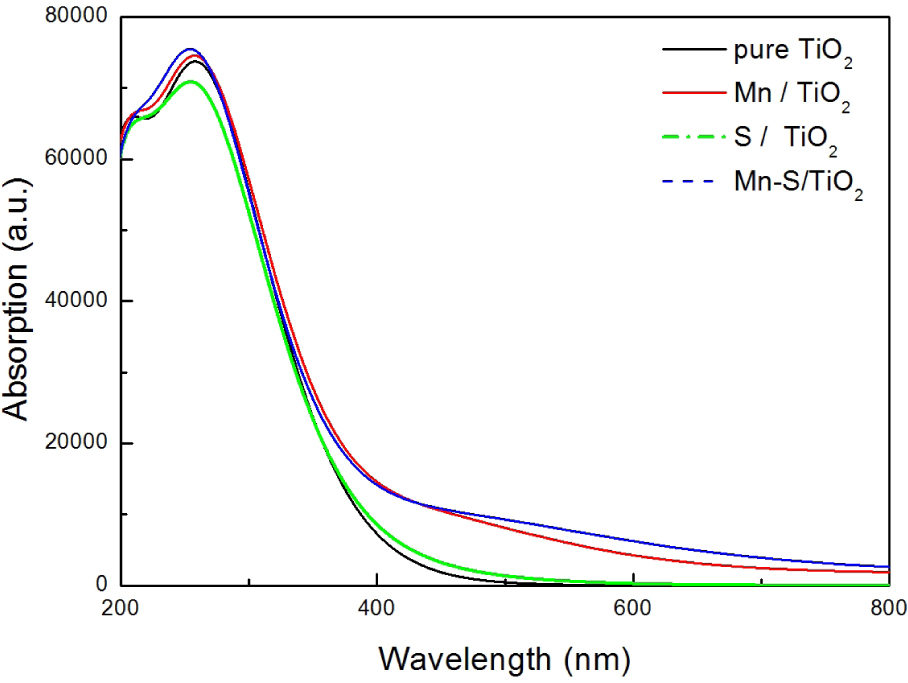
Fig. 5
Absorption spectra of pure TiO2, Mn/TiO2, S/TiO2 and Mn–S/TiO2.