
Table 1
Greatest gain and greatest loss of cities in the ranking 1992-2013
| Greatest gain 1992-2013 | Greatest loss 1992-2013 | |||
|---|---|---|---|---|
| 1 | Kutno | +43 | Racibórz | -60 |
| 2 | Piła | +36 | Bytom | -51 |
| 3 | Bełchatów | +35 | Świętochłowice | -46 |
| 4 | Koszalin | +35 | Zabrze | -38 |
| 5 | Głogów | +34 | Siemianowice Śląskie | -35 |
| 6 | Puławy | +30 | Jastrzębie-Zdrój | -35 |
| 7 | Świdnica | +27 | Ruda Śląska | -32 |
| 8 | Pruszków | +27 | Wodzisław Śląski | -31 |
| 9 | Siedlce | +25 | Piekary Śląskie | -31 |
| 10 | Radomsko | +25 | Zawiercie | -27 |
[i] Source: own calculations
Table 2
Pearson correlation coefficients among changes of position in rankings
| Changes: | |||||||||
|---|---|---|---|---|---|---|---|---|---|
| 1992-1998 | 1992-2004 | 1992-2008 | 1998-2004 | 1998-2008 | 1998-2013 | 2004-2008 | 2004-2013 | 2008-2013 | |
| Change 1992-2013 | +0.65*** | +0.90*** | +0.91*** | +0.73*** | +0.70*** | +0.85*** | 0.10 | +0.39*** | +0.31*** |
Source: own calculations
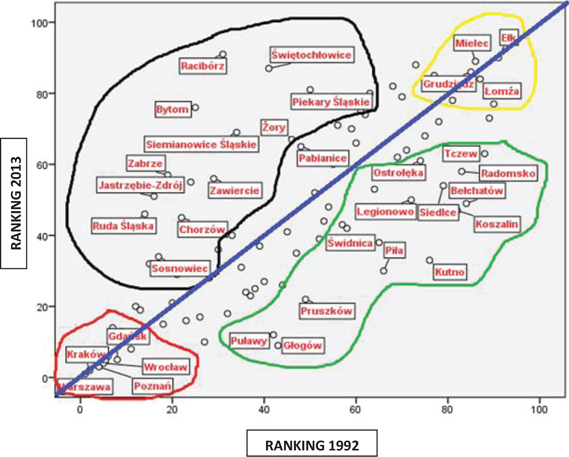
Figure 1
Four groups of Polish big cities separated due to the change in the economic position between the ranking from 1992 and 2013 Source: own calculations
Table 3
Operationalisation of factors explaining changes in economic hierarchies of Polish large cities
| Explanatory variables | Expected sign | |
|---|---|---|
| European integration | – Location on the course of route TEN-T (including roads, railways, airports and seaports; one-zero variable; years 2004, 2013) | + |
| – Distance to the EU core cities: Hamburg, Frankfurt, vienna, Berlin, Munich (measured by distance to the city with direct or connecting flights to the above cities) (in km) | - | |
| – Distance to the Polish-German border (in km) | - | |
| – Turn-out in the elections to European Parliament (in %; 2004, 2009) | + | |
| – Turn-out in the EU accession referendum (in %, 2003) | + | |
| – EU accession referendum – number of votes „in favor” as % of potential votes (in %, 2003) | + | |
| – Academic exchanges within ERASMUS (number of student placements per 10 thousand inhabitants, number of teacher placements per 10 thousand inhabitants; years: 2001, 2007, 2012 and one-zero variable: the Erasmus agreements signed by institutions of higher education between 2000-2007 and 2011-2012) | + | |
| – Expenditures of local budget within EU grants (sum for 2005-2013 per capita) (in PLN) | + | |
| – The availability of the EU funds in 1991-2006 period | + | |
| Location | – Distance to the nearest city with more than 300 thousand inhabitants (in km and minutes, departure on weekdays at noon) | - |
| – Distance to the nearest airport with regular passenger flights (in km and minutes, departure on weekdays at noon) | - | |
| Degree of sectoral diversification of cities’ economy | – Local budget revenues from fee on exploitation of natural resources (minerals) over PLN 200,000 (one-zero variable; 2004, 2008, 2013) | - |
| Human capital | – % of population with higher education (2002, 2011) | + |
| – The quality of higher education institutions (based on rankings from „Wprost” magazine: 1998, 2004, 2007; the average ranking of public and non-public institutions of higher education in the city, in points, maximum value = 100) | + | |
| Social capital | – Turn-out in local elections (in %; 1990,1994,1998,2002,2006,2010) | + |
| – The number of NGO’s per capita (1995, 1998, 2004, 2008, 2013) | + | |
| Administrative status | – Losing the status of regional capital (one-zero variable, 1998) | - |
| Modernisation of private sector | – Change in gross value of fixed assets in enterprises (2004-2013, in %) | + |
| – The number of firms from the list of 500 of the biggest companies in the country located within the city per 100 thousand inhabitants (based on the rankings from „Polityka” magazine; 1998, 2012) | + | |
| – The value of exports per capita (in PLN; 2005, 2007) |
[i] Source: own calculations
Table 4
Results of OLS regression analyses (progressive selection method)
| Dependent variable | |||
|---|---|---|---|
| Change in the ranking 1992-2013 | Change in the ranking 1992-2004 | Change in the ranking 2004 -2013 | |
| R square | 0.552 | 0.623 | 0.213 |
| Adjusted R square | 0.513 | 0.580 | 0.185 |
| Significance of the model | 0.000 | 0.000 | 0.000 |
| Explanatory variables | |||
| Distance to the airport in vienna by plane | 0.469*** | ||
| % of population with higher education 2002 | 0.370*** | 0.203* | |
| TEN-T (location of the airport in the city) | -0.271** | ||
| Turn-out in local elections 1998 | 0.332** | ||
| The value of export per capita 2005 | 0.203* | ||
| Distance to the airport in Hamburg | -0.214* | ||
| Losing the status of regional capital | 0.216** | ||
| Turn-out in local elections 1990 | -0.471*** | ||
| Turn-out in local elections 1994 | 0.282* | ||
| Distance to the city with direct flight to Munich | -0.198* | ||
| Distance to the nearest city with more than 300 thousand inhabitants (in minutes) | 0.312** | ||
| Turn-out in the elections to European Parliament in 2003 (w %) | 0.672*** | ||
| Number of votes „in favor“ as % of potential votes in EU accession referendum | -0.396** | ||
| Change in gross value of fixed assets in enterprises per capita 2004-2013 | 0.385*** | ||
| TEN-T (railway) | 0.235* | ||
| The availability of the EU funds in 1991-2006 period | 0.217* | ||
Source: own calculations
Table 5
Changes in the explanatory power of regression models after adding the variables related to EU integration (hierarchical multiple regression)
| Dependent variable | ||||
|---|---|---|---|---|
| Change in the ranking 1992-2013 | Change in the ranking 1992-2004 | Change in the ranking 2004 -2013 | ||
| Significance of the model | 0.001 | 0.000 | 0.306 | |
| R square | 0.578 | 0.612 | 0.366 | |
| R square after entering to the model block of „EU integration“ variables | 0.868 | 0.765 | 0.715 | |
| R square change | 0.290 | 0.153 | 0.349 | |
| Significance of R square change | 0.029 | 0.075 | 0.401 | |
[i] Source: own calculations