
Figure 1
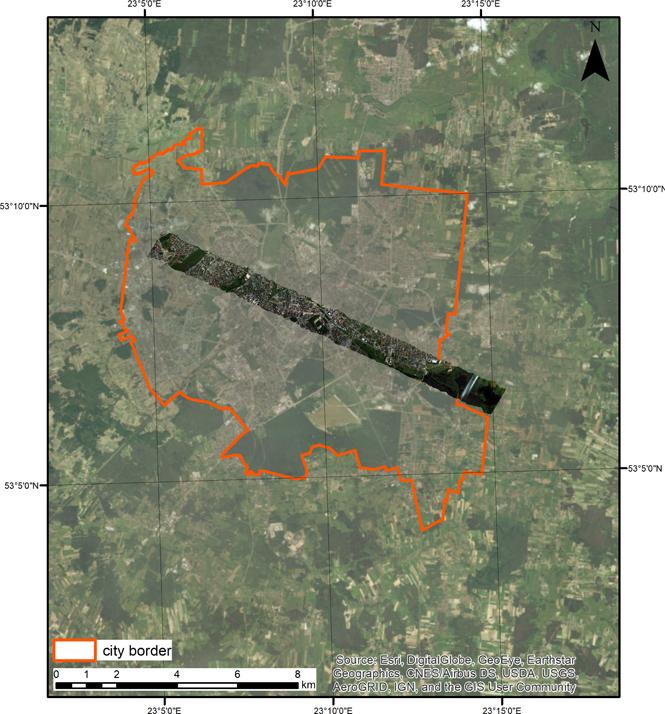
Figure 2
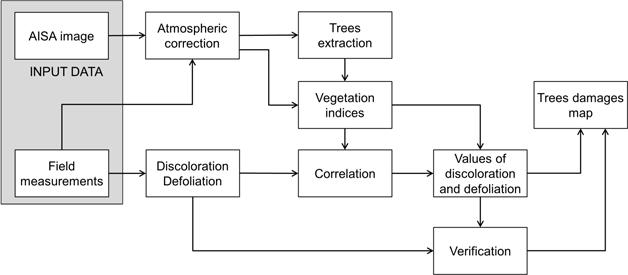
Figure 3
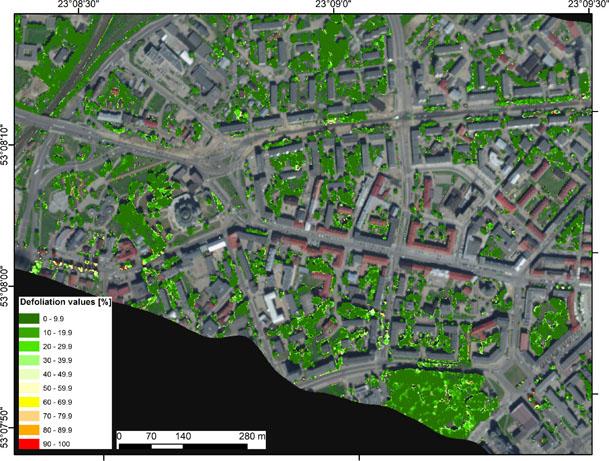
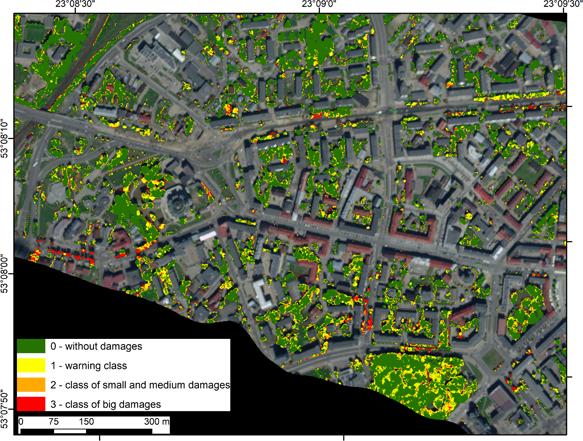
Figure 4
Results of the statistical analysis: Pearson’s correlation coefficient, regression equation and coefficients of determination R2 calculated for values of selected vegetation indices and biophysical parameters acquired during field measurements (N=30, p<0_05)
| Variable | mNDVI705 | SIPI | PSRI | |
|---|---|---|---|---|
| Discolouration | Pearson’s correlation coefficient | -0.64 | 0.64 | 0.66 |
| regression equation | y = -75 ln(x) - 33.101 | y = 413.95 ln(x) + 0.7012 | y = 422.32x + 1.9608 | |
| coefficients of determination R2 | 0.5088 | 0.4020 | 0.4365 | |
| Defoliation | Pearson’s correlation coefficient | -0.56 | 0.76 | 0.71 |
| regression equation | y = -66.17 ln(x) - 29.177 | y = 511.95 ln(x) - 2.7063 | y = 475.26x - 0.2346 | |
| coefficients of determination R2 | 0.3651 | 0.5666 | 0.5095 | |
Tree damage classes based on discolouration and defoliation values
| Class and values | Discolouration | ||||
|---|---|---|---|---|---|
| 0-10% | 11-25% | 26-60% | >60% | ||
| Defoliation | 0-10% | 0 | 0 | 1 | 2 |
| 11-25% | 1 | 1 | 2 | 2 | |
| 26-60% | 2 | 2 | 3 | 3 | |
| >60% | 3 | 3 | 3 | 3 | |