
Table 1
Muscle larval count in control and treated groups
| Control (n=7) | Group 1 (n=7) | Group 2 (n=7) | |
|---|---|---|---|
| Mean ± SD | 25,428 ± 1,397 | 15,428 ± 975 | 8,142 ± 1,069 |
| IE | --------- | 40.4 % | 67.9 % |
| F. test | 14.526 | ||
| P. value | 0.001 | ||
| Control & G1 | Control & G2 | G1 & G2 | |
| 0.001 | 0.001 | 0.001 | |
Intensity effect (IE): IE (%) = [(N-n) /N] X 100
Where N is the average number of larvae in control group and n is the average number of larvae in treated groups.
Group 1 received low dose of GA (0.5 mg/kg), while group 2 received higher dose (1 mg/kg).
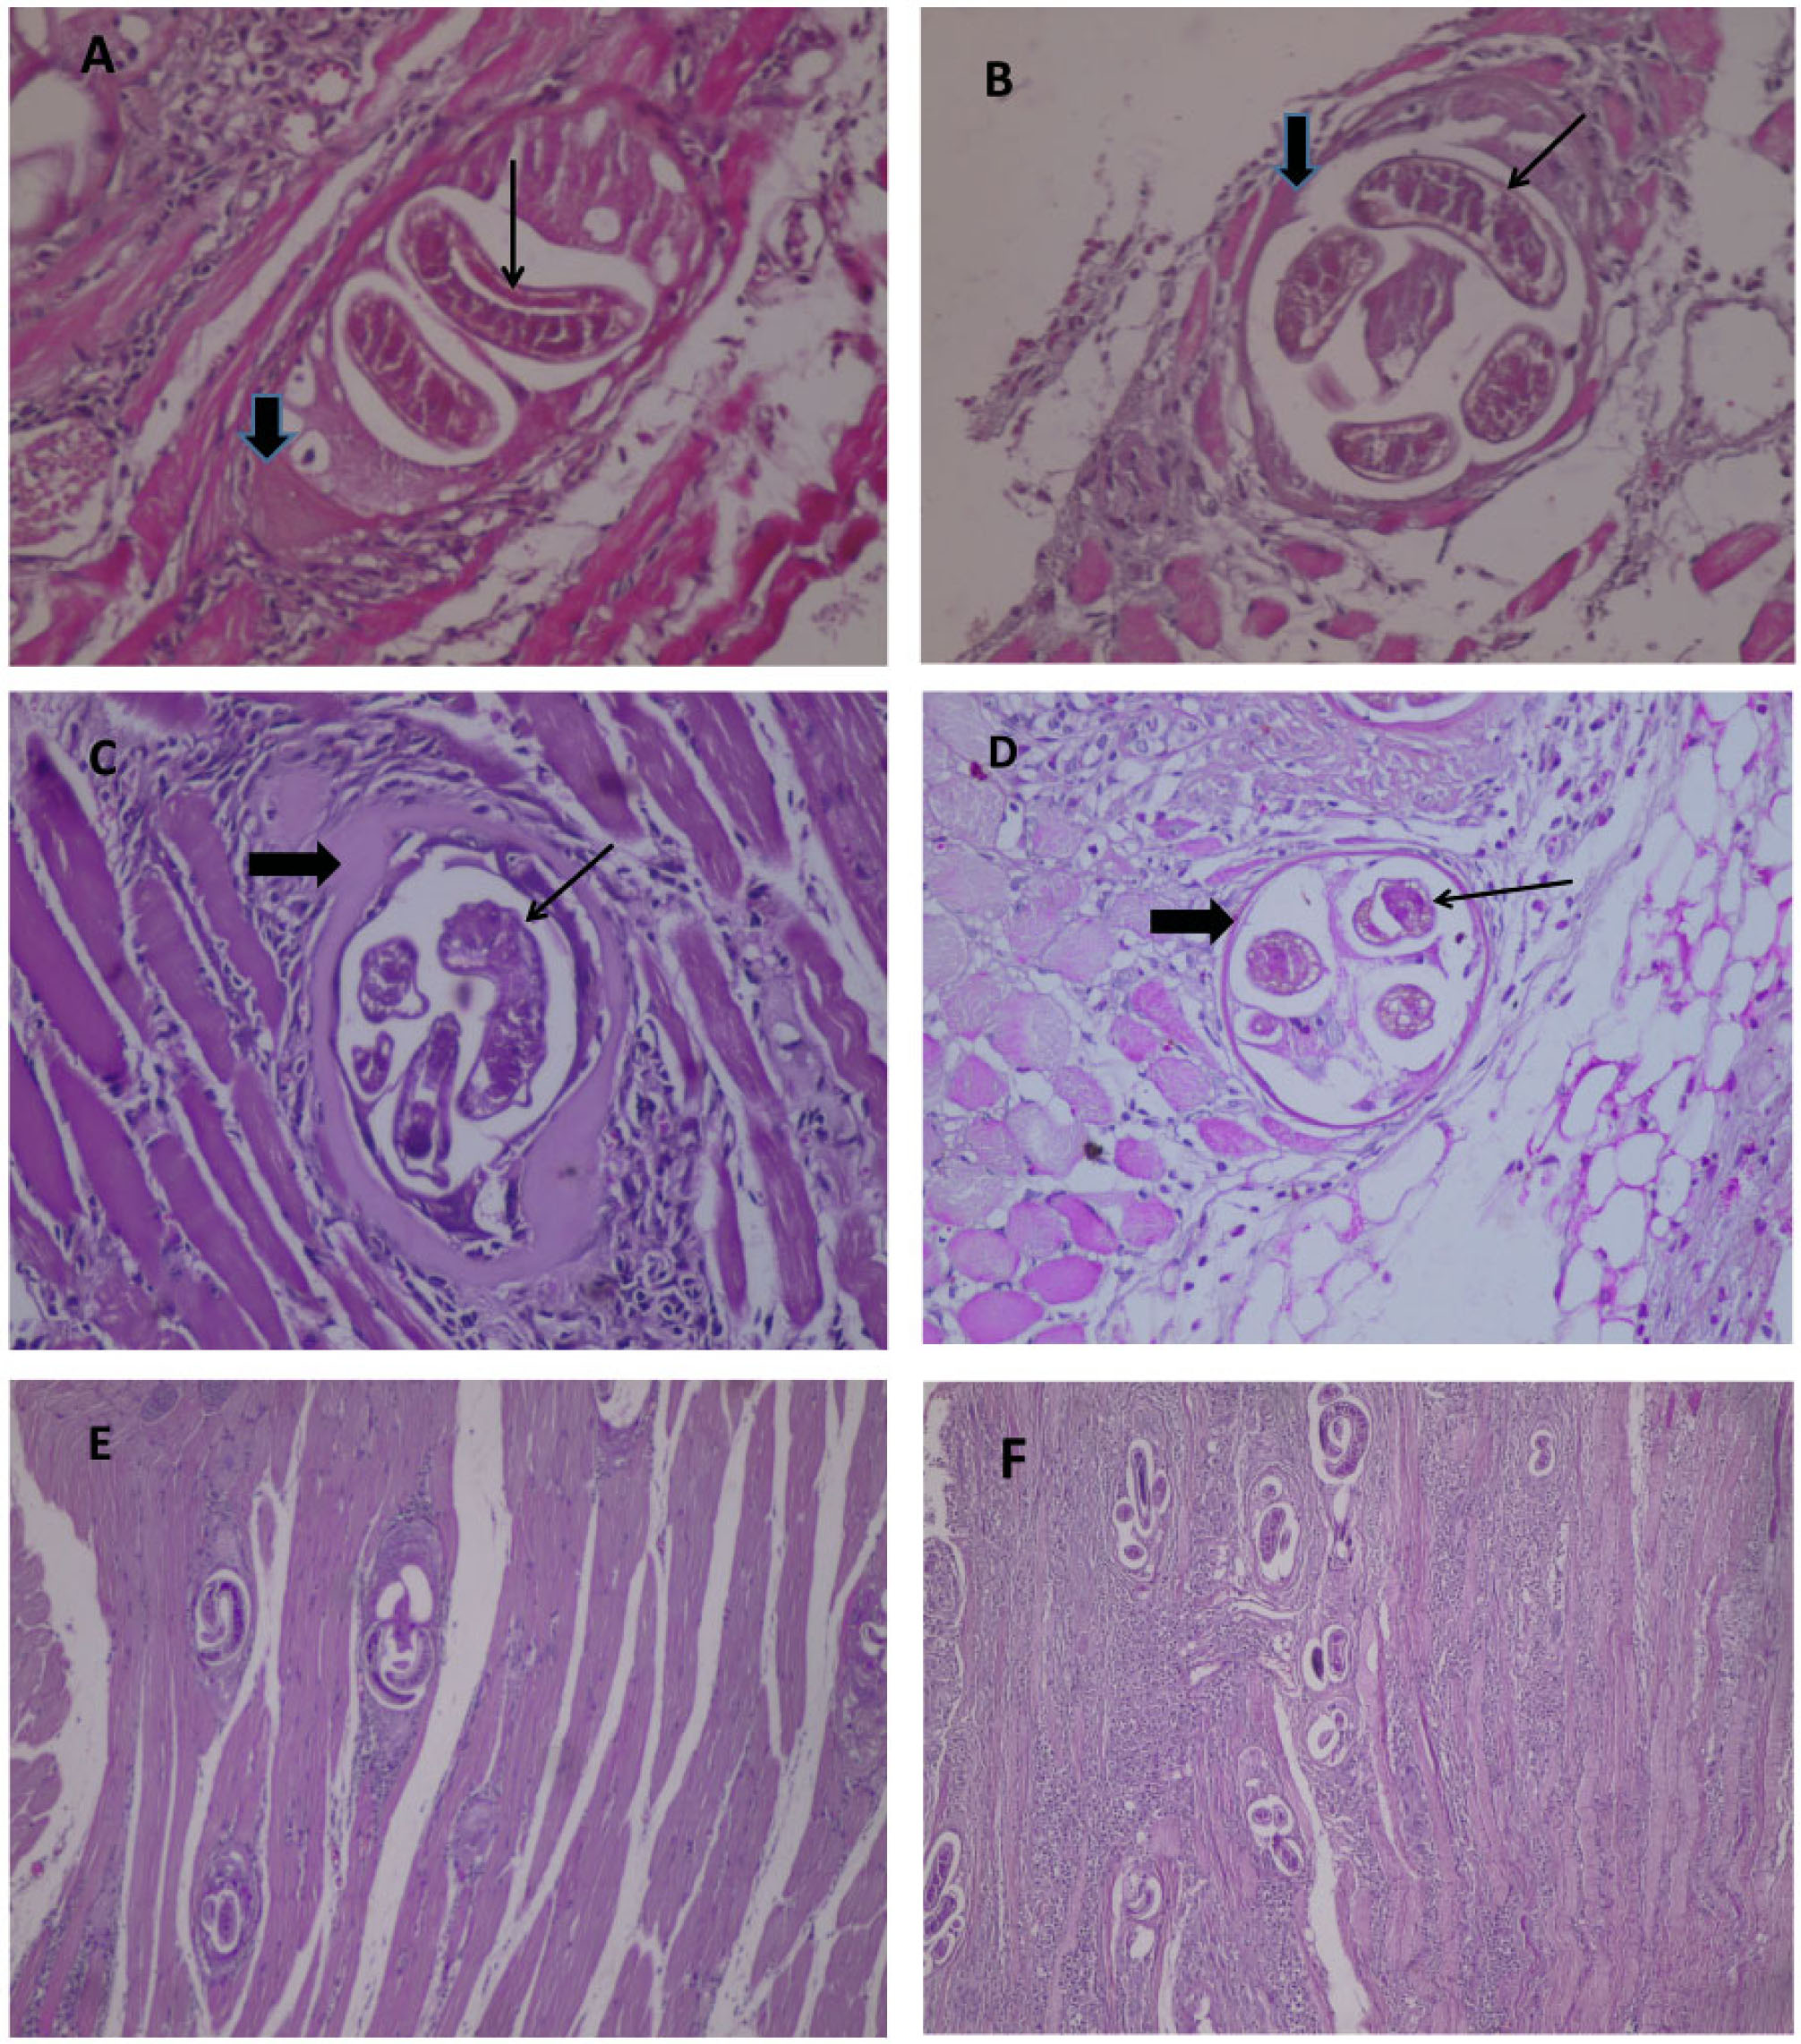
Fig. 1
Photomicrographs of skeletal muscle sections 5 weeks p.i. showing: A,C encapsulated larvae from the control infected mice. The collagenous capsule (thick arrow) surrounds sections of Trichinella larvae (thin arrow) (PAS, H&E × 400). B,D thinning of the capsule (thick arrow) around the larvae (thin arrow) in the treated mice (PAS, H&E × 400). E, mild to moderate inflammatory reactions around larvae in the control group (H&E × 100). F, moderate to marked intensity of inflammation around the encapsulated larvae and in between muscle fibres in the treated group (H&E × 65)
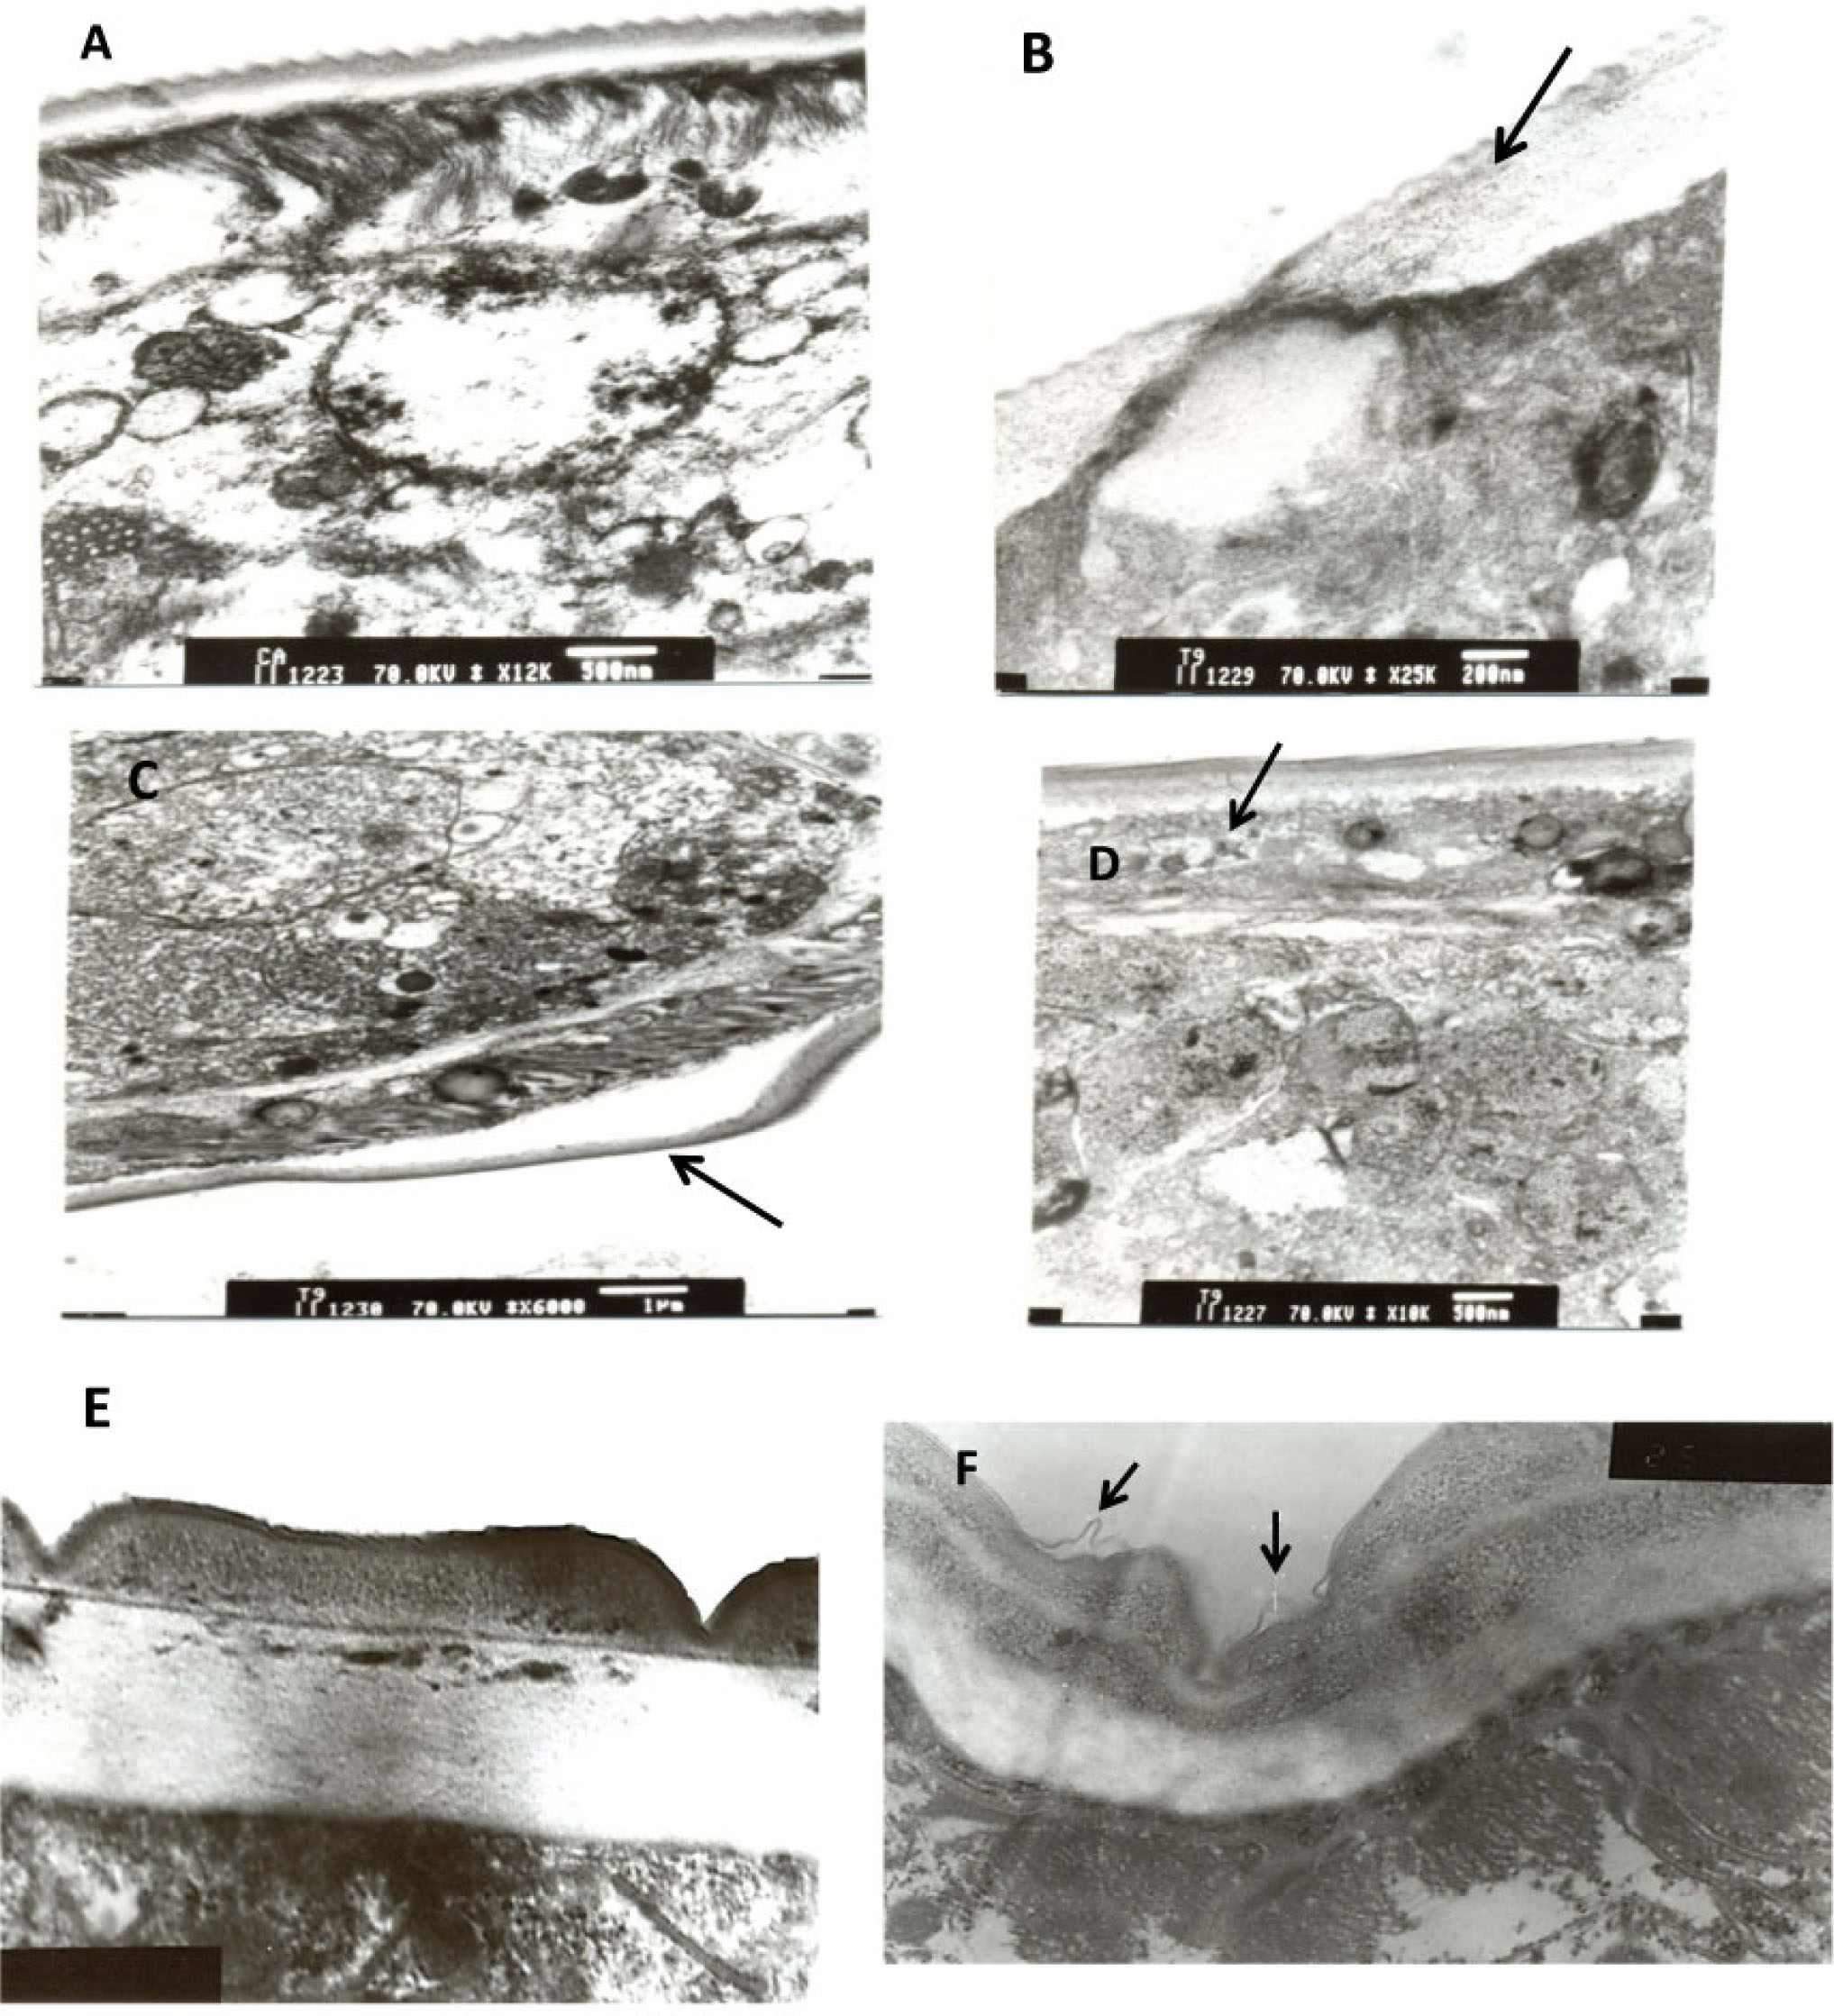
Fig. 2
Electron micrographs ofthebody wall of adult worms (A-D) and larvae (E,F):A, section in the body wall of an adult from control infected mouse (× 12,000). B, loss of the electron dense layer in the cuticle (arrow) is observed (× 25,000). C, separation of the cuticle from the underlying hypodermis (arrow) is noted (× 6000). D, there are blunting of the epicuticle and washed-out image of the cytoplasm (arrow) (× 10,000). E, section in the cuticle of a larva from the control group (× 20,000). F, disruption of the layers of the cuticle (arrows) is noted (× 25,000)