
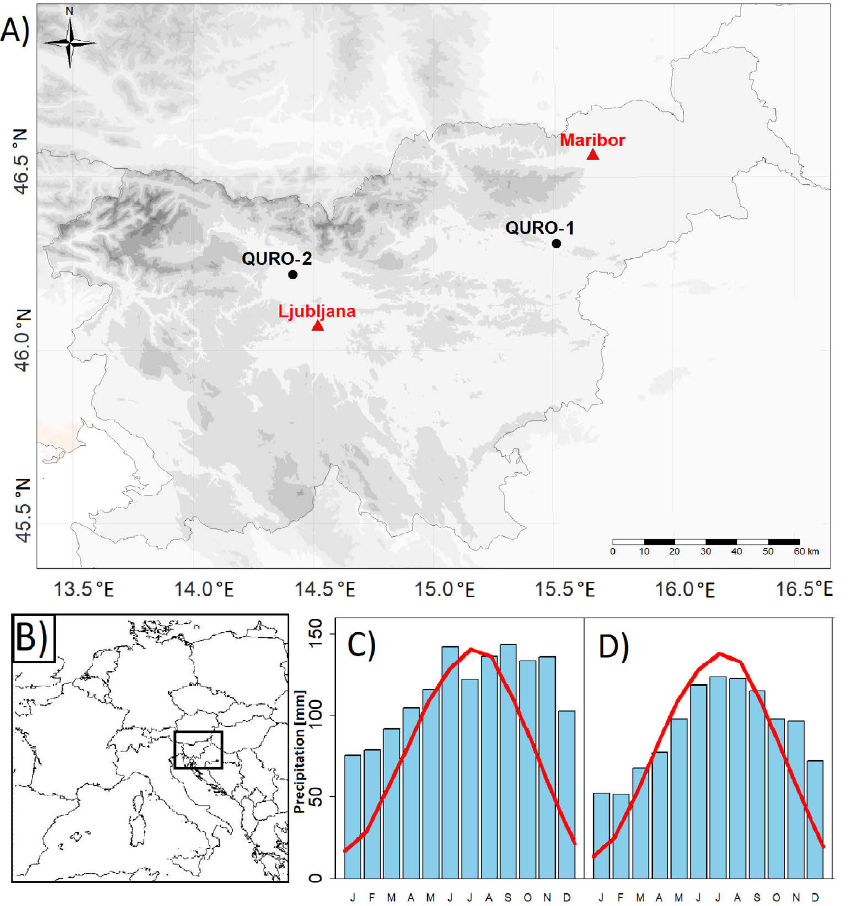
Fig. 1
A) Locations of the research sites (circles) and the meteorological stations (triangles), B) location of Slovenia in Europe and climagraphs of C) Ljubljana and D) Maribor. The lines of climagraphs represent mean monthly temperature and the blocks represent monthly amounts of precipitation.
Table 1
General description of the analysed sites.
| Location / Site denotation | Year of sampling | Latitude | Longitude | Elevation (m) | Bedrock | Forest soil type | Meteorological station | Average age of measured tree |
|---|---|---|---|---|---|---|---|---|
| Mlace/ QURO-1 | 2012 | N46°18′21′′ | E15°30′35′′ | 280–315 | Marl | Eutric brown soil | Maribor | 150 |
| Sorsko Plain / QURO-2 | 2015 | N46°11′23′′ | E14°25′26′′ | 360–365 | Alluvial loams and clays | Dystric brown soil | Ljubljana | 90 |
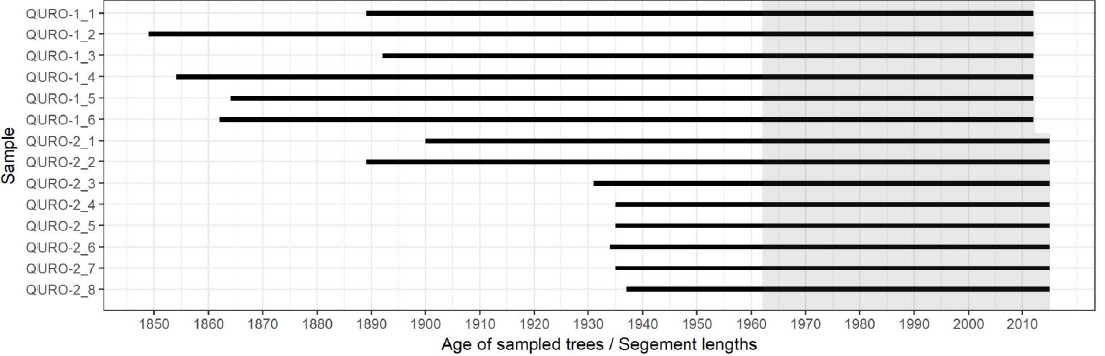
Fig. 2
Individual sample lengths. The shaded area represents the analysed period used for model comparison for QURO-1 and QURO-2.
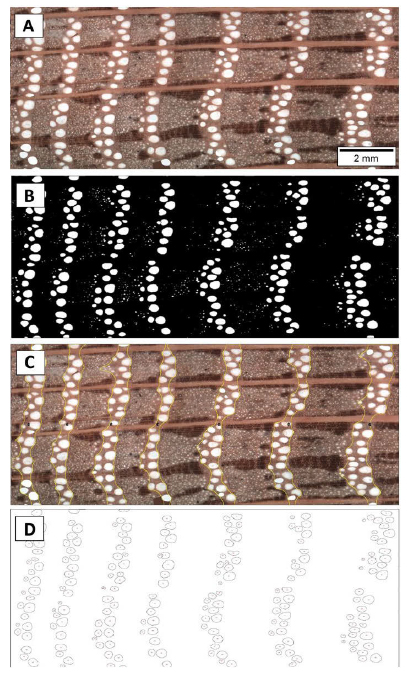
Fig. 3
An example of a workflow of earlywood vessel analysis with ImageJ and macro EWVA: A) original image, B) image converted to a black and white mask for segmentation of the original image, vessels below the threshold were excluded from the analysis, C) recognised groups of earlywood vessels belonging to different years overlaid over the original image and D) measured earlywood vessels.
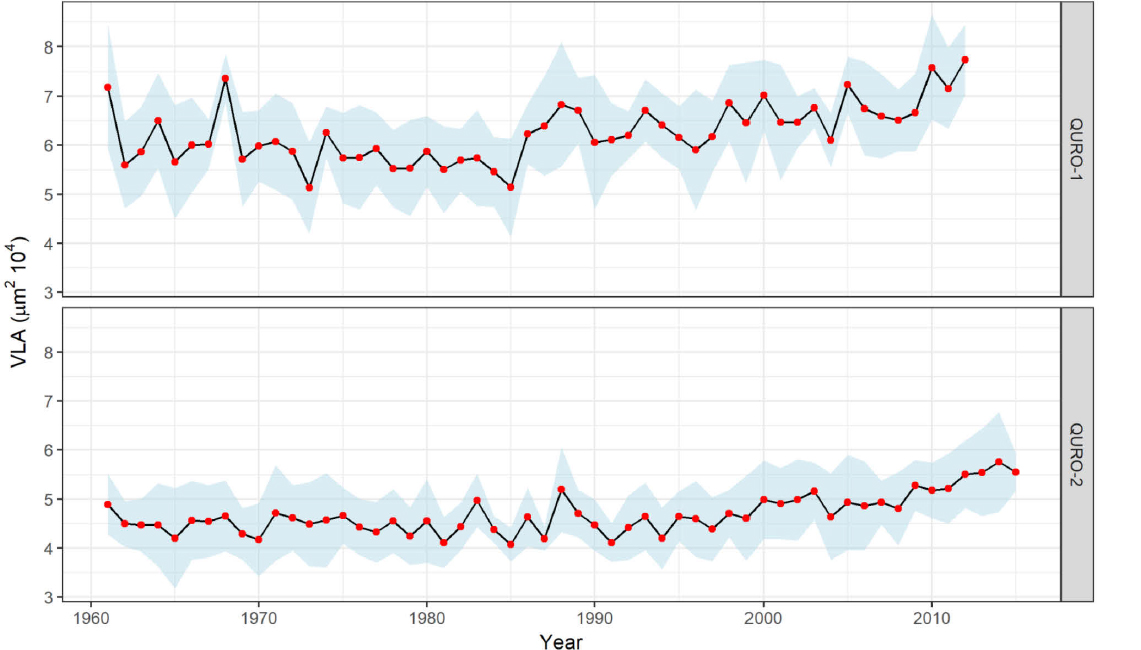
Fig. 4
Chronologies of vessel lumen area (VLA) for QURO-1 and QURO-2 with 95% confidence interval of the mean.
Table 2
Characteristics of site chronologies: number of samples (N), chronology span, mean and standard deviation (Std) of vessel areas, minimum and maximum range of vessel areas (Min – Max), rbar (r̄) and autocorrelation with lag 1, 2 and 3 (AC).
| Mean ± Std | Min – Max | |||||||
|---|---|---|---|---|---|---|---|---|
| Site | N | Chronology span | (μm2 104) | (μm2 104) | r̄ | AC_1 | AC_2 | AC_3 |
| QURO-1 | 6 | 2012–1961 | 6.259 ± 0.603 | 5.133–7.743 | 0.44 | 0.42 | 0.40 | 0.31 |
| QURO-2 | 8 | 2015–1961 | 4.691 ± 0.395 | 4.072–5.756 | 0.32 | 0.61 | 0.52 | 0.46 |
Table 3
Pearson correlation coefficients between vessel lumen area (VLA) and climate data: mean monthly temperatures (TEMP) and sum of monthly precipitation (PREC) for QURO-1 and QURO-2. Months with capital letters refer to the current growing season, while months with lowercase letters refer to the year of the previous growing season. Only correlation coefficients with p ≤ 0.01 are shown.
| Month | QURO-1 | QURO-2 | |||
|---|---|---|---|---|---|
| TEMP | PREC | TEMP | PREC | ||
| Previous growing season | Jul | 0.45 | 0.53 | ||
| Aug | 0.49 | 0.46 | |||
| Sep | 0.37 | 0.38 | |||
| Oct | 0.35 | ||||
| Nov | 0.37 | ||||
| Dec | |||||
| Jul–Sep | 0.57 | ||||
| Jul–Nov | 0.71 | ||||
| Current growing season | JAN | –0.41 | 0.44 | ||
| FEB | |||||
| MAR | 0.38 | –0.33 | |||
| APR | 0.60 | 0.63 | |||
| MAY | 0.32 | 0.47 | |||
| JUN | 0.47 | 0.50 | |||
| JAN–MAR | –0.43 | ||||
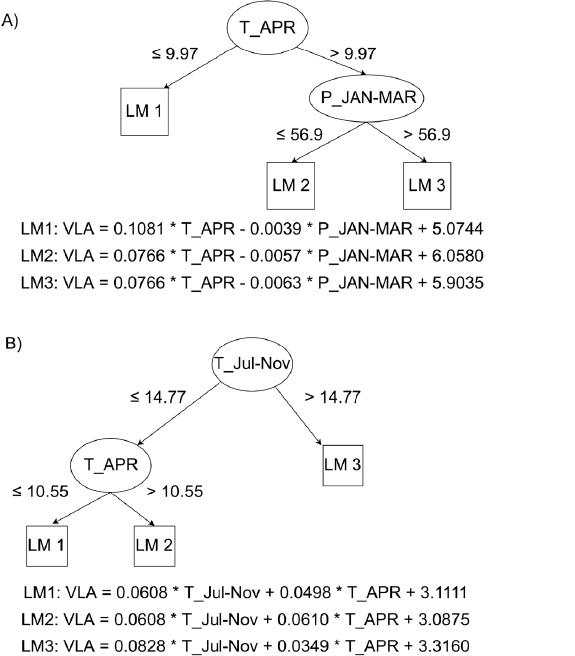
Fig. 5
Examples of the Model Tree (MT) for A) QURO-1 and B) QURO-2 sites.
Table 4
Description of predictors of the VLA for QURO-1 and QURO-2.
| Predictor | Description | |
|---|---|---|
| QURO-1 | T_Jul_Sep | Average temperature from July to September, previous growing season |
| T_MAR | Average March temperature, current growing season | |
| T_APR | Average April temperature, current growing season | |
| T_MAY | Average May temperature, current growing season | |
| T_JUN | Average June temperature, current growing season | |
| P_JAN-MAR | Sum of precipitation from January to March, current growing season | |
| QURO-2 | T_Jul-Nov | Average temperature from July to November, previous growing season |
| T_JAN | Average January temperature, current growing season | |
| T_APR | Average April temperature, current growing season | |
| T_MAY | Average May temperature, current growing season | |
| T_JUN | Average June temperature, current growing season |
Table 5
Multiple linear regression summary statistics for QURO-1 and QURO-2.
| Variable | Coefficients | t value | p value | |
|---|---|---|---|---|
| QURO-1 | Intercept | 0.496164 | 0.418 | 0.67767 |
| T_Jul–Sep | 0.165491 | 2.617 | 0.01196 | |
| T_MAR | 0.042491 | 1.437 | 0.15744 | |
| T_APR | 0.159552 | 3.474 | 0.00113 | |
| T_JUN | 0.064903 | 1.422 | 0.16164 | |
| P_JAN–MAR | –0.00598 | –2.294 | 0.02639 | |
| R2 | Adj R2 | |||
| 0.6304 | 0.5903 | |||
| QURO-2 | Intercept | 1.08324 | 1.792 | 0.07914 |
| T_Jul–Nov | 0.12812 | 2.570 | 0.01319 | |
| T_JAN | 0.03792 | 2.501 | 0.01569 | |
| T_APR | 0.08273 | 2.879 | 0.00586 | |
| T_ JUN | 0.04669 | 1.800 | 0.07782 | |
| R2 | Adj R2 | |||
| 0.6241 | 0.5941 |
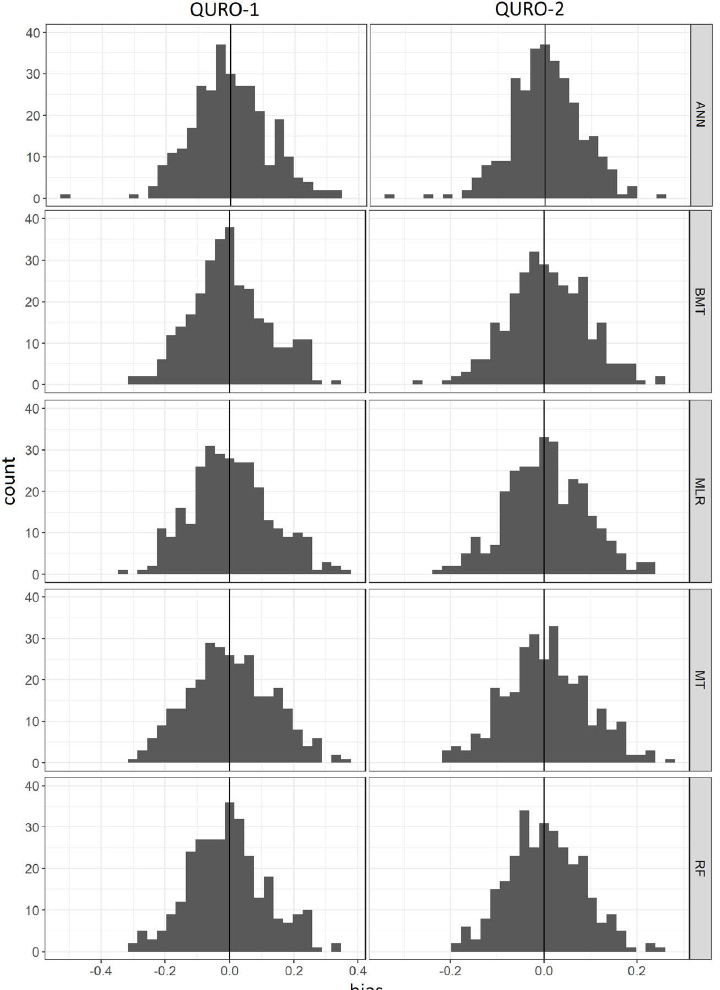
Fig. 6
Histograms of mean bias, calculated as the difference between observed and estimated mean responses for validation data.
Table 6
Comparison of the performance of five predictive modelling methods for A) QURO_1 and B) QURO_2 sites. Methods were evaluated by 3-fold cross-validation repeated 100 times. The five predictive modelling methods were Multiple Linear Regression (MLR), Artificial Neural Networks (ANN), Model Trees (MT), Bagging of Model Trees (BMT) and Random Forests of Regression Trees (RF). The performance measures were the correlation coefficient (r), root relative squared error (RRSE), root mean squared error (RMSE), index of agreement (d), reduction of error (RE), coefficient of efficiency (CE) and detrended efficiency (DE), calculated on the training (train) and testing (test) data of cross-validation splits. Across the 100 runs of cross-validation, we present the mean, standard deviations (Std), mean rank and share of rank 1 for each performance measure. The best values of each performance measure on the test set are highlighted in bold.
| MLR | ANN | MT | BMT | RF | |||||||
|---|---|---|---|---|---|---|---|---|---|---|---|
| mean | std | mean | std | mean | std | mean | std | mean | std | ||
| (A) QURO-1 | |||||||||||
| rtrain | 0.797 | 0.037 | 0.815 | 0.043 | 0.789 | 0.059 | 0.810 | 0.030 | 0.898 | 0.018 | |
| rtest | 0.694 | 0.103 | 0.726 | 0.095 | 0.633 | 0.134 | 0.692 | 0.112 | 0.689 | 0.097 | |
| RMSEtrain | 0.356 | 0.027 | 0.343 | 0.042 | 0.359 | 0.047 | 0.360 | 0.025 | 0.302 | 0.022 | |
| RMSEtest | 0.453 | 0.063 | 0.428 | 0.066 | 0.488 | 0.079 | 0.447 | 0.065 | 0.453 | 0.066 | |
| RRSEtrain | 0.601 | 0.048 | 0.580 | 0.077 | 0.606 | 0.080 | 0.608 | 0.041 | 0.510 | 0.035 | |
| RRSEtest | 0.786 | 0.134 | 0.741 | 0.123 | 0.845 | 0.148 | 0.771 | 0.106 | 0.778 | 0.083 | |
| dtrain | 0.877 | 0.026 | 0.878 | 0.059 | 0.871 | 0.042 | 0.851 | 0.030 | 0.898 | 0.019 | |
| dtest | 0.794 | 0.066 | 0.808 | 0.073 | 0.753 | 0.081 | 0.757 | 0.067 | 0.723 | 0.069 | |
| REtest | 0.405 | 0.227 | 0.473 | 0.184 | 0.312 | 0.257 | 0.435 | 0.158 | 0.429 | 0.110 | |
| CEtest | 0.364 | 0.237 | 0.436 | 0.202 | 0.265 | 0.273 | 0.394 | 0.174 | 0.387 | 0.132 | |
| DEtest | 0.317 | 0.249 | 0.394 | 0.215 | 0.210 | 0.289 | 0.348 | 0.188 | 0.339 | 0.155 | |
| rank | rank1 | rank | rank1 | rank | rank1 | rank | rank1 | rank | rank1 | ||
| rtrain | 3.92 | 0.00 | 2.67 | 0.02 | 4.16 | 0.03 | 2.95 | 0.00 | 1.05 | 0.95 | |
| rtest | 2.91 | 0.11 | 1.85 | 0.50 | 3.93 | 0.06 | 2.93 | 0.15 | 3.12 | 0.20 | |
| RMSEtrain | 3.45 | 0.00 | 2.33 | 0.05 | 3.93 | 0.07 | 3.90 | 0.00 | 1.13 | 0.88 | |
| RMSEtest | 2.95 | 0.14 | 1.89 | 0.49 | 3.86 | 0.06 | 2.82 | 0.12 | 3.22 | 0.21 | |
| RRSEtrain | 3.45 | 0.00 | 2.33 | 0.05 | 3.93 | 0.07 | 3.90 | 0.00 | 1.13 | 0.88 | |
| RRSEtest | 2.95 | 0.14 | 1.89 | 0.49 | 3.86 | 0.06 | 2.82 | 0.12 | 3.22 | 0.21 | |
| dtrain | 2.64 | 0.07 | 2.52 | 0.13 | 3.39 | 0.13 | 4.71 | 0.00 | 1.49 | 0.68 | |
| dtest | 2.18 | 0.24 | 1.50 | 0.65 | 3.32 | 0.09 | 3.45 | 0.02 | 4.29 | 0.03 | |
| REtest | 2.96 | 0.14 | 1.89 | 0.49 | 3.86 | 0.06 | 2.82 | 0.12 | 3.22 | 0.21 | |
| CEtest | 2.96 | 0.14 | 1.89 | 0.49 | 3.86 | 0.06 | 2.82 | 0.12 | 3.22 | 0.21 | |
| DEtest | 2.95 | 0.14 | 1.89 | 0.49 | 3.86 | 0.06 | 2.82 | 0.12 | 3.22 | 0.21 | |
| Overalltrain | 3.37 | 0.02 | 2.46 | 0.06 | 3.85 | 0.08 | 3.86 | 0.00 | 1.20 | 0.85 | |
| Overalltest | 2.75 | 0.16 | 1.79 | 0.53 | 3.74 | 0.07 | 3.00 | 0.11 | 3.46 | 0.16 | |
| (B) QURO-2 | |||||||||||
| rtrain | 0.796 | 0.044 | 0.843 | 0.035 | 0.800 | 0.039 | 0.839 | 0.028 | 0.907 | 0.020 | |
| rtest | 0.717 | 0.093 | 0.781 | 0.084 | 0.687 | 0.104 | 0.740 | 0.087 | 0.747 | 0.094 | |
| RMSEtrain | 0.232 | 0.019 | 0.209 | 0.027 | 0.232 | 0.019 | 0.216 | 0.015 | 0.180 | 0.013 | |
| RMSEtest | 0.293 | 0.041 | 0.257 | 0.042 | 0.297 | 0.040 | 0.278 | 0.040 | 0.274 | 0.043 | |
| RRSEtrain | 0.601 | 0.058 | 0.541 | 0.080 | 0.602 | 0.052 | 0.560 | 0.044 | 0.465 | 0.044 | |
| RRSEtest | 0.792 | 0.164 | 0.694 | 0.150 | 0.801 | 0.147 | 0.745 | 0.126 | 0.733 | 0.107 | |
| dtrain | 0.874 | 0.032 | 0.899 | 0.059 | 0.866 | 0.030 | 0.883 | 0.024 | 0.921 | 0.018 | |
| dtest | 0.793 | 0.057 | 0.839 | 0.077 | 0.765 | 0.068 | 0.789 | 0.052 | 0.782 | 0.058 | |
| REtest | 0.410 | 0.253 | 0.546 | 0.202 | 0.401 | 0.234 | 0.483 | 0.189 | 0.503 | 0.142 | |
| CEtest | 0.346 | 0.299 | 0.496 | 0.248 | 0.337 | 0.283 | 0.428 | 0.230 | 0.451 | 0.179 | |
| DEtest | 0.297 | 0.356 | 0.457 | 0.295 | 0.286 | 0.359 | 0.384 | 0.300 | 0.409 | 0.236 | |
| rank | rank1 | rank | rank1 | rank | rank1 | rank | rank1 | rank | rank1 | ||
| rtrain | 4.54 | 0.00 | 2.44 | 0.00 | 4.30 | 0.00 | 2.72 | 0.00 | 1.00 | 1.00 | |
| rtest | 3.61 | 0.06 | 1.70 | 0.61 | 4.21 | 0.04 | 2.82 | 0.07 | 2.65 | 0.22 | |
| RMSEtrain | 4.42 | 0.00 | 2.22 | 0.01 | 4.26 | 0.00 | 3.08 | 0.00 | 1.01 | 0.99 | |
| RMSEtest | 3.70 | 0.03 | 1.75 | 0.64 | 4.05 | 0.03 | 2.78 | 0.11 | 2.72 | 0.20 | |
| RRSEtrain | 4.42 | 0.00 | 2.22 | 0.01 | 4.26 | 0.00 | 3.08 | 0.00 | 1.01 | 0.99 | |
| RRSEtest | 3.70 | 0.03 | 1.75 | 0.64 | 4.05 | 0.03 | 2.78 | 0.11 | 2.72 | 0.20 | |
| dtrain | 4.05 | 0.00 | 1.99 | 0.11 | 4.34 | 0.00 | 3.49 | 0.00 | 1.13 | 0.89 | |
| dtest | 3.09 | 0.03 | 1.30 | 0.85 | 4.02 | 0.03 | 3.15 | 0.04 | 3.44 | 0.05 | |
| REtest | 3.70 | 0.03 | 1.75 | 0.64 | 4.05 | 0.03 | 2.78 | 0.11 | 2.72 | 0.20 | |
| CEtest | 3.70 | 0.03 | 1.75 | 0.64 | 4.05 | 0.03 | 2.78 | 0.11 | 2.72 | 0.20 | |
| DEtest | 3.70 | 0.03 | 1.75 | 0.64 | 4.05 | 0.03 | 2.78 | 0.11 | 2.72 | 0.20 | |
| Overalltrain | 4.36 | 0.00 | 2.22 | 0.03 | 4.29 | 0.00 | 3.09 | 0.00 | 1.04 | 0.97 | |
| Overalltest | 3.53 | 0.04 | 1.62 | 0.68 | 4.08 | 0.03 | 2.88 | 0.08 | 2.88 | 0.17 | |