
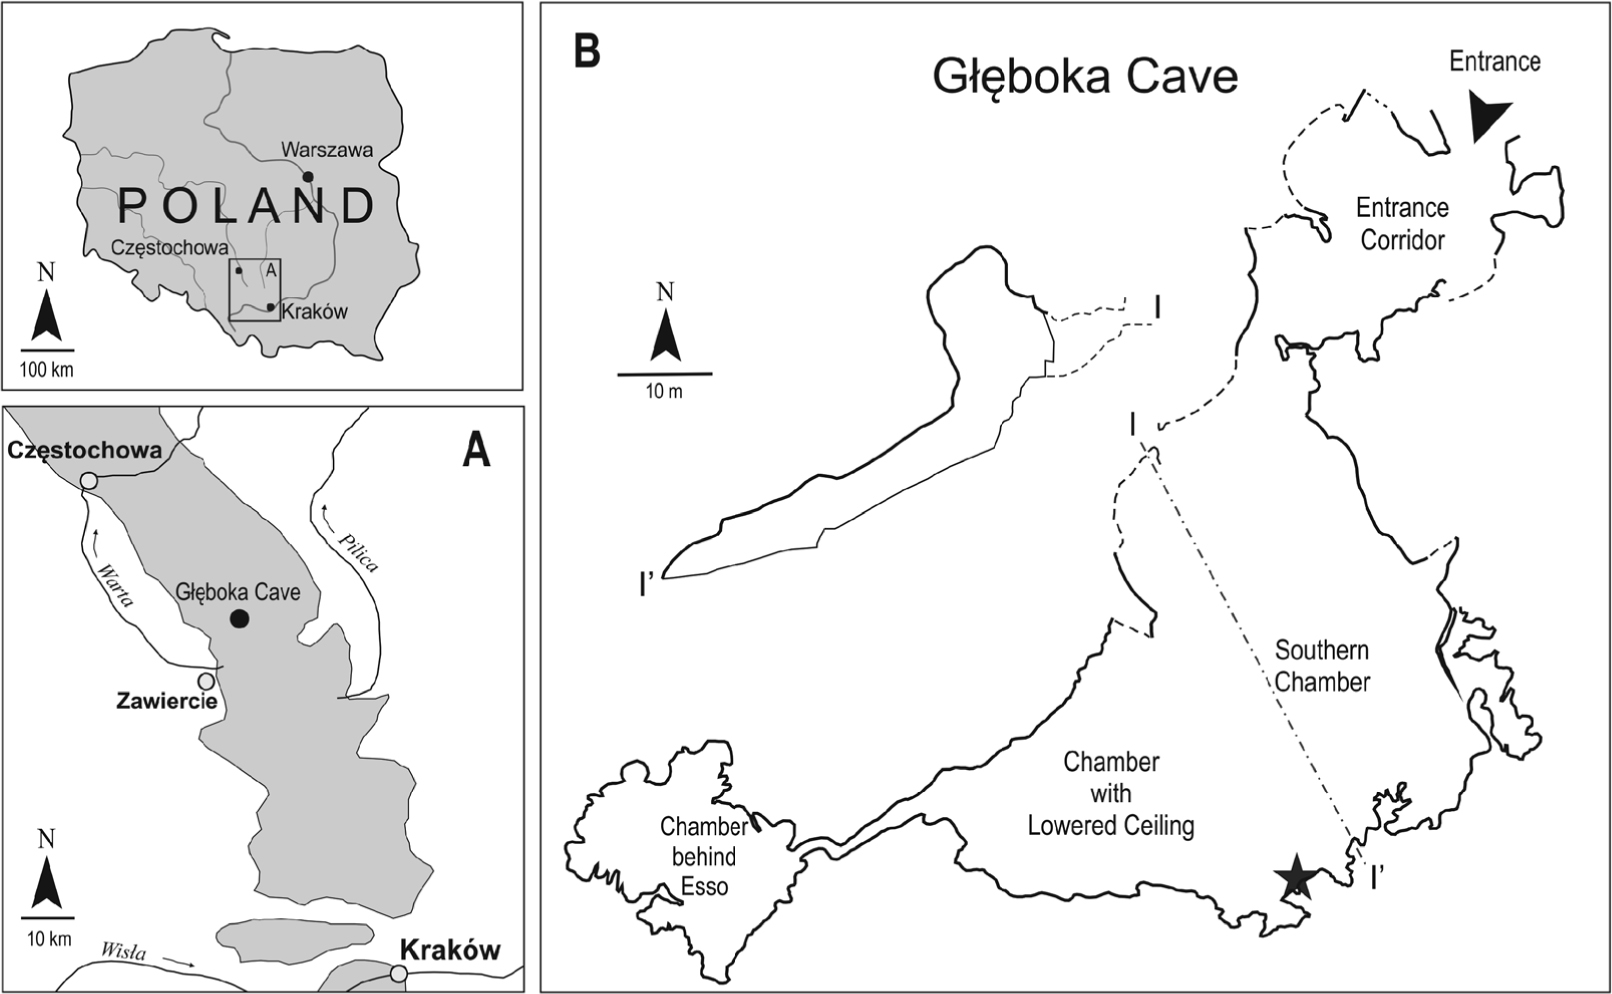
Fig. 1
Location of the study site. A – location of the Głęboka Cave (black circle) in the southwestern region of Poland (Krajewski and Matyszkiewicz (2009), modified); B – plan view of the Głęboka Cave, which shows the location (asterisk) where the flowstones were collected, cave map and profile (B) after Sznober and Tyc (2010), simplified.
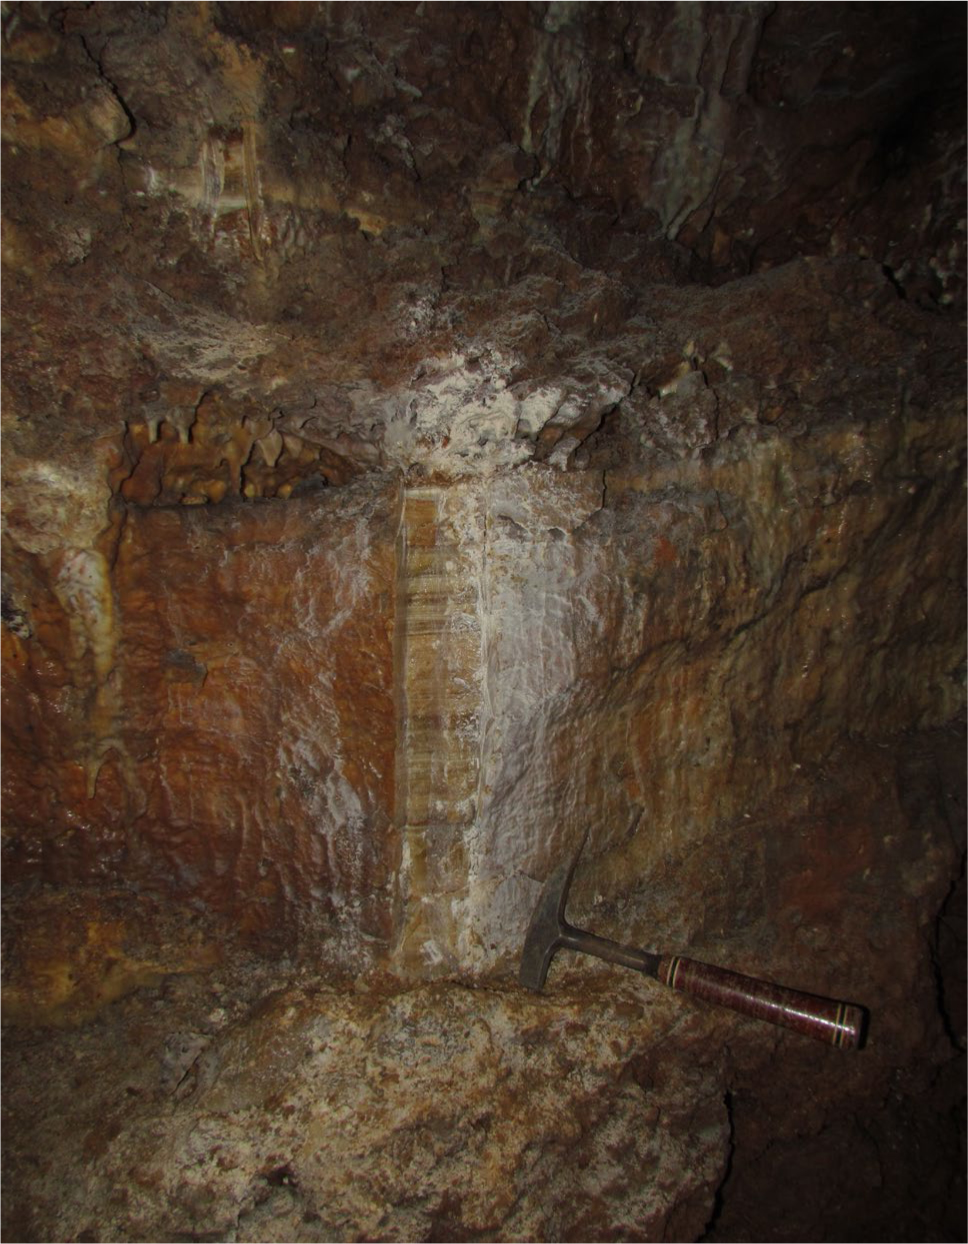
Fig. 2
The sampled flowstone and its setting.
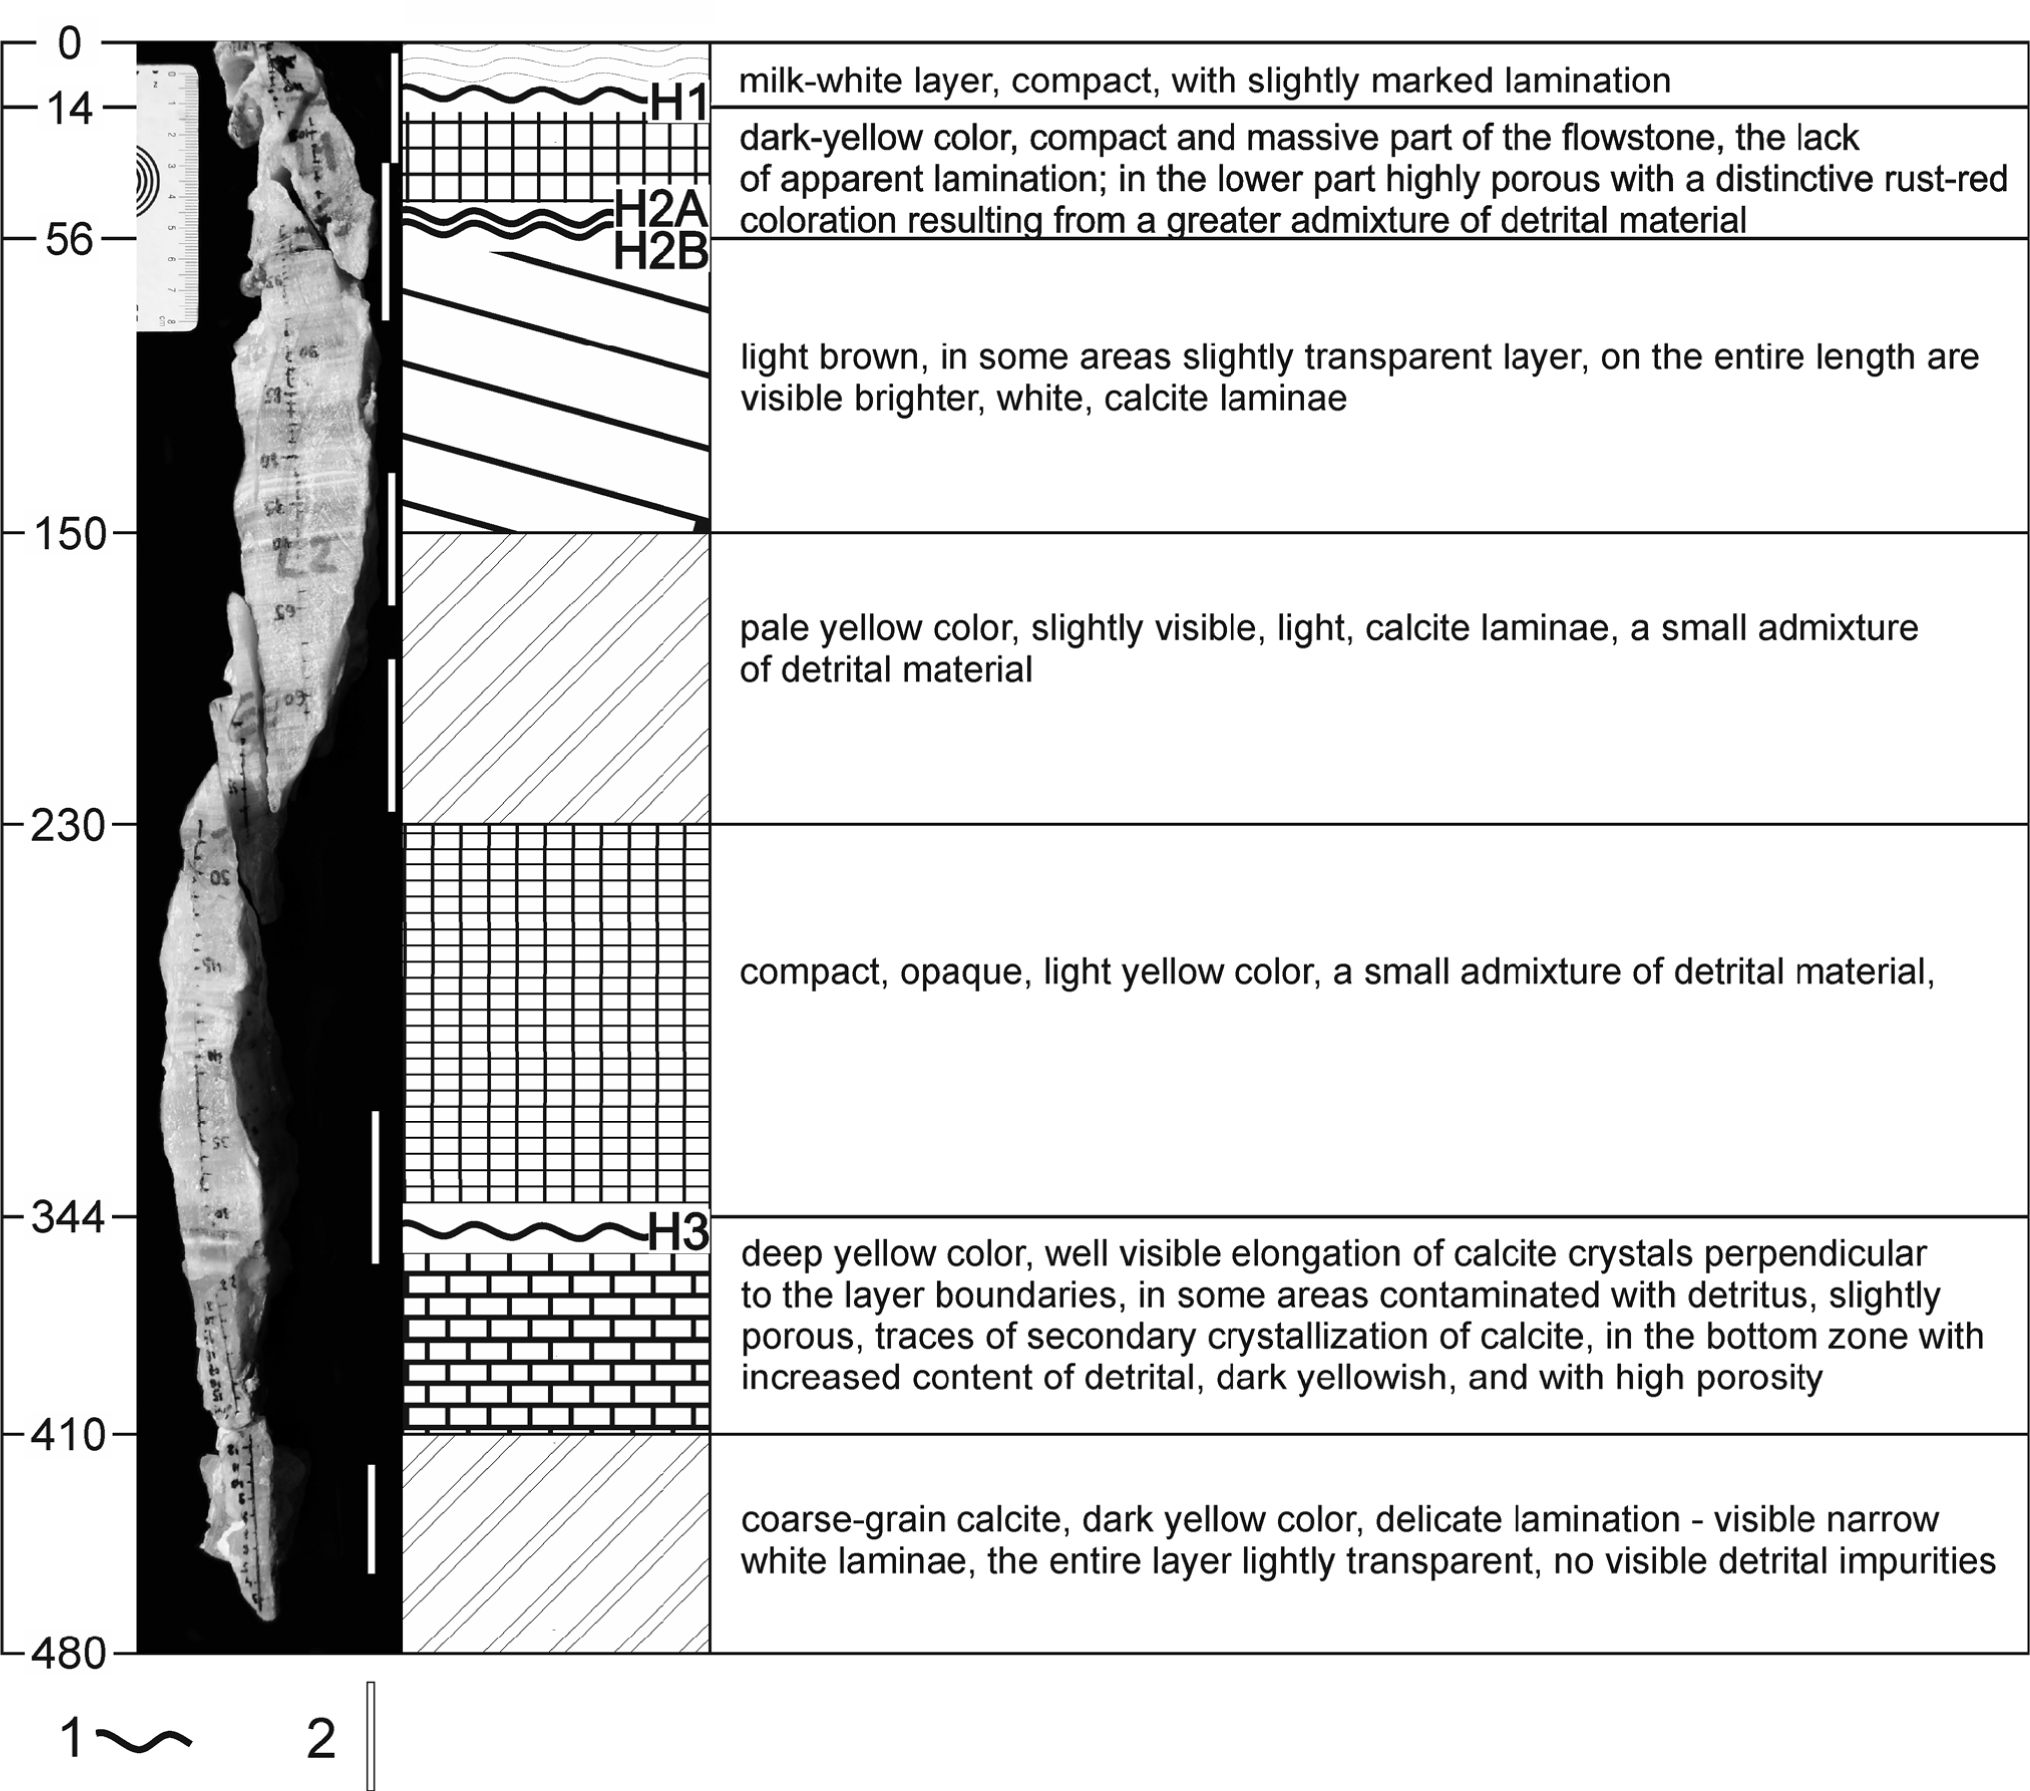
Fig. 3
Microscopic description of the studied flowstone. 1 – Discontinuities in the surfaces; 2 – Layers selected for the detailed microscopic studies.
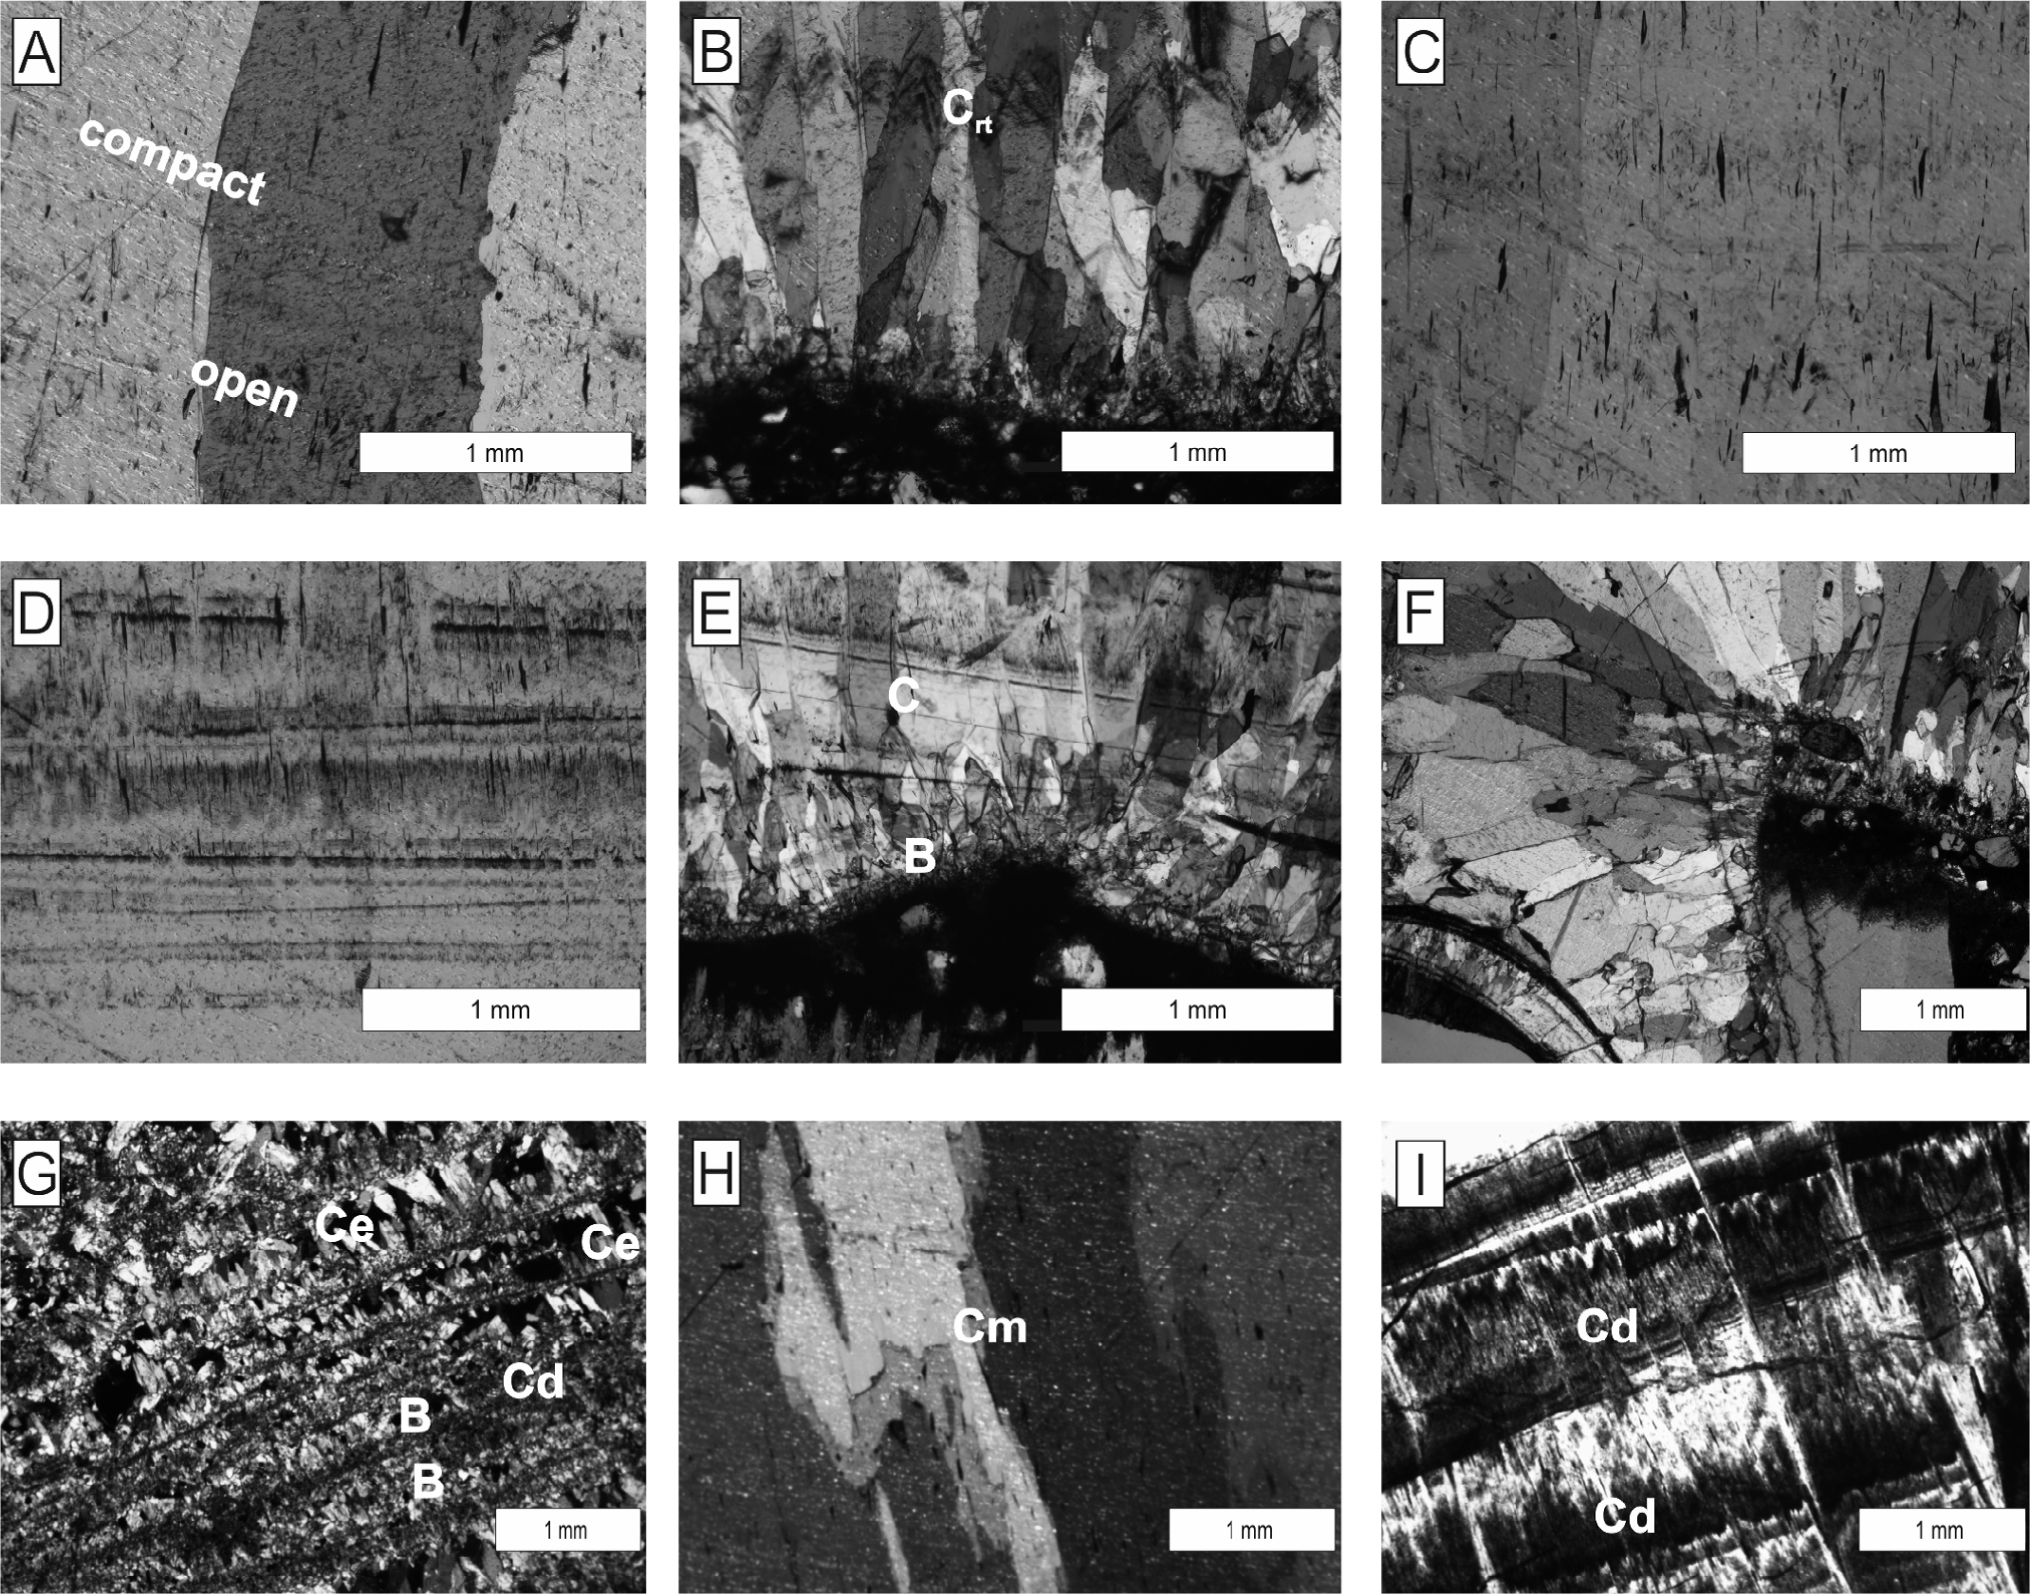
Fig. 4
Photomicrographs for different types of calcite fabrics observed in thin sections. A – Columnar fabric (compact and open); B – Columnar with hiatuses, columnar fabrics and protruding rhombohedral terminations (Crt) underlined with a higher content of detrital material; C – Columnar fabric with a faint lamination, which has a visible characteristic elongation of the inclusions parallel to the direction of the calcite crystal growth; D – Columnar compact fabric with faint and flat laminae; E – A large discontinuous surface with a blocky crystal fabric that gradually transforms into a columnar fabric; F – A degradation surface that is also visualized by the change in the direction of crystal growth; G – Initial crystalline stage, which precipitates after discontinuity surface with transitional basal crystals; H – Columnar fabric of the microcrystalline type; I – Dark layers (i.e., condensed dark laminae) with possible dissolutions and/or hiatuses.
Table 1
Results of microstratigraphic logging for calcite fabrics in flowstone from the Głęboka Cave.
| Code | Formation environment | Depths (mm) |
|---|---|---|
| 1 | Stable growth regime and warm climate with a persistent water film | 71–84.5, 129.5–138.5, 143.5–147.5, 155.5–165.5, 426–429, 433–439 |
| 2 | Correlated with enhanced degassing, which is typical of low water supply rates combined with intense cave ventilation | 138.5–143.5, 147.5–150.5, 165.5–173.5, 188.8–198.5, 429–433, 439–450 |
| 3 | Thicker film of fluid with faster water delivery rate and less efficient degassing than that in columnar compacts | 34.5–45.5, 57.5–71, 150.5–155.5, 185.5–188.5, 215.5–228.5, 328.5–332.5, 350.5–356.5, 450–454.5 |
| 4 | Constant water supply rate, higher precipitation rate, Mg/Ca ratio in water that is higher than those in previous fabrics | 0.5–3.5, 8.5–14.5, 15.5–21, 22–33.5, 198.5–215.5, 311.5–328.5, 332.5–346.5 |
| 5 | Seasonal contrast in temperature, vegetation activity, water supply and changes in cave ventilation and an increase in the flushing of colloidal particles | 45.5–51.5, 55.5–57.5 |
| 6 | Hiatuses, destructive fabric, relatively dry periods, or condensation-corrosion of a primary fabric; these conditions also enable initial crystalline stages of calcites that contain abundant impurities, which often form after discontinuity/periods of low growth rates or precipitation cessations | 3.5–8.5, 14.5–15.5, 21–22, 33.5–34.5, 51.5–55.5, 346.5–350.5 |
Table 2
Results of U-series dating from the Głęboka Cave flowstone. The reported errors are 2σ.
| Sample lab no. | Depth (mm) | U cont. (ppm) | 234U/238U | 230Th/234U | 230Th/232Th | Age (ka) | Remarks |
|---|---|---|---|---|---|---|---|
| 265 | 478 ± 2 | 0.0643 ± 0.0001 | 1.000 ± 0.004 | 1.05 ± 0.01 | 450 ± 5 | > 500 | |
| 267 | 377 ± 2 | 0.0715 ± 0.0001 | 1.007 ± 0.004 | 1.04 ± 0.01 | 588 ± 7 | > 500 | |
| 268 | 350 ± 2 | 0.0459 ± 0.0001 | 1.014 ± 0.005 | 1.08 ± 0.02 | 60 ± 1 | > 500 | |
| 333 | 107 ± 2 | 0.0396 ± 0.0001 | 1.019 ± 0.007 | 1.00 ± 0.03 | 487 ± 14 | ||
| 334 | 74 ± 2 | 0.0239 ± 0.0001 | 1.000 ± 0.007 | 0.97 ± 0.03 | 320 ± 10 | ||
| 277 | 50 ± 2 | 0.1839 ± 0.0004 | 1.212 ± 0.004 | 1.14 ± 0.01 | 12.5 ± 0.2 | *D.C. | |
| 278 | 26 ± 2 | 0.1046 ± 0.0002 | 1.316 ± 0.005 | 1.05 ± 0.01 | 12.1 ± 0.1 | *D.C. | |
| 279 | 14 ± 2 | 0.0466 ± 0.0001 | 1.172 ± 0.006 | 1.04 ± 0.02 | 290 ± 5 | > 500 | |
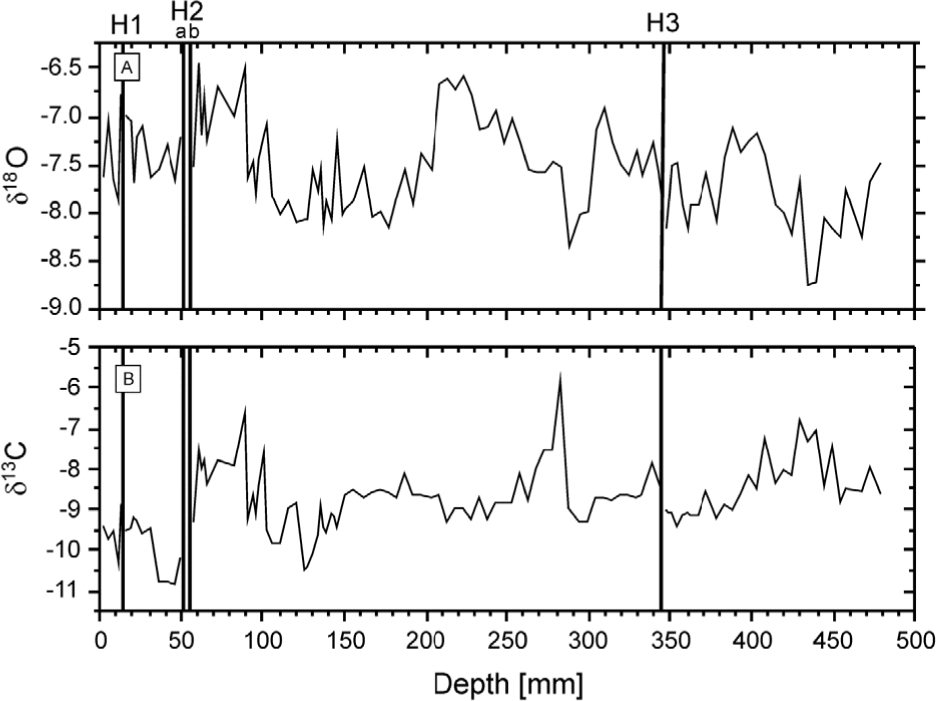
Fig. 5
Oxygen (A) and carbon (B) stable isotope compositions in the flowstone from the Głęboka Cave. The vertical lines indicate visible breaks in the flowstone deposition.
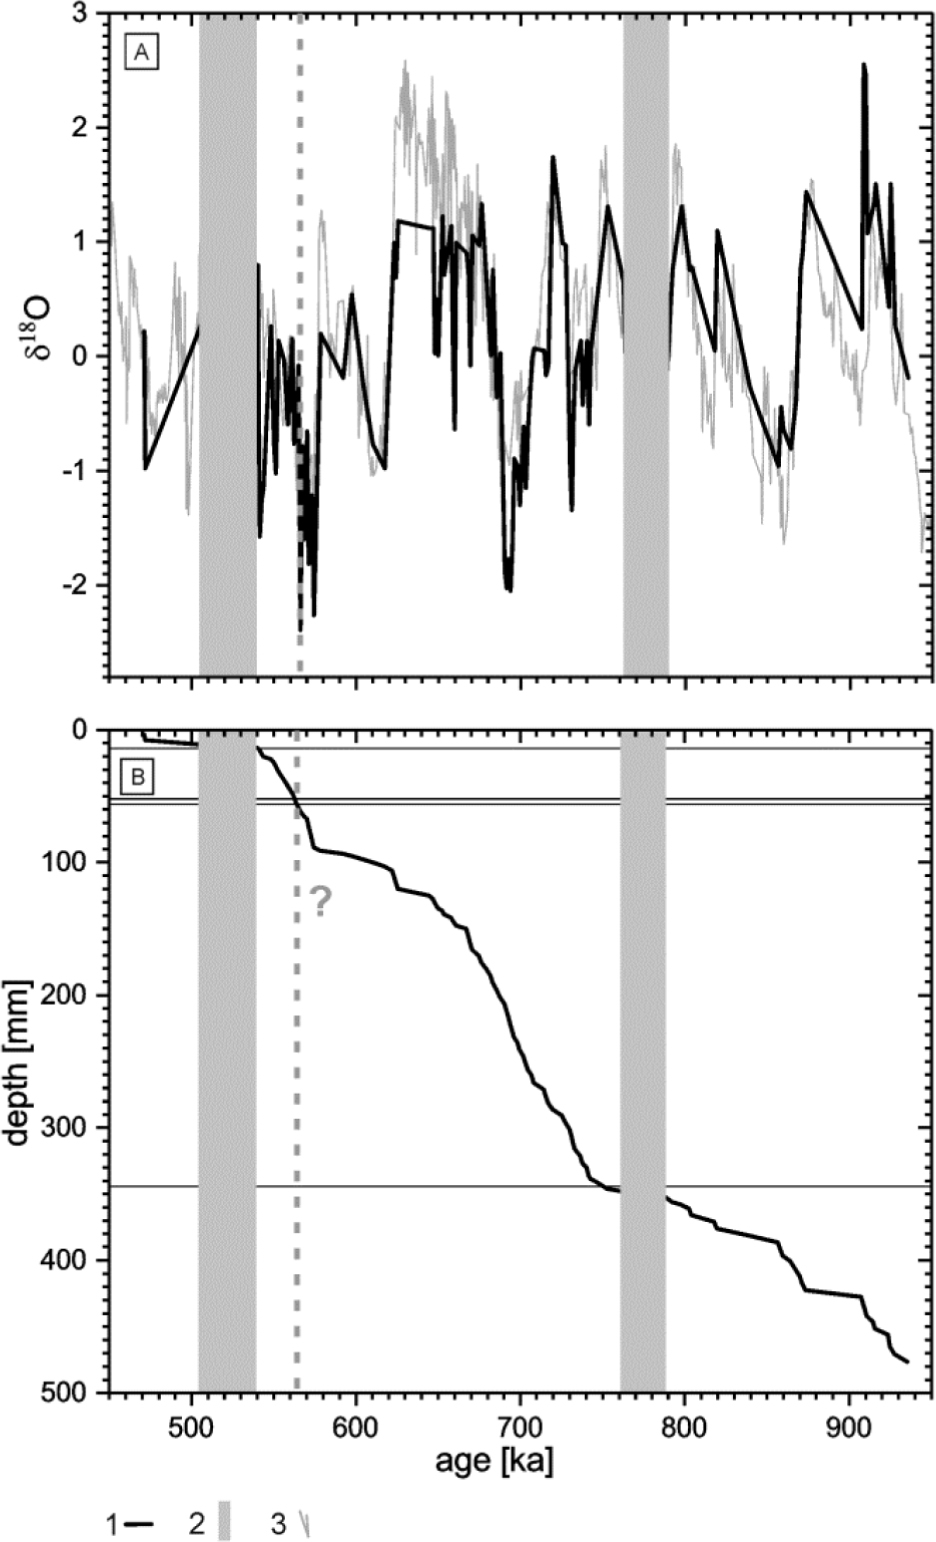
Fig. 6
Oxygen stratigraphy results for the analysed flowstone. (A) 1 – δ18O record from the Głęboka Cave flowstone; 2 – discontinuity surfaces; 3 – the foraminifera δ18O record from the LR04 profile (Lisiecki and Raymo, 2005); (B) Age-depth model.
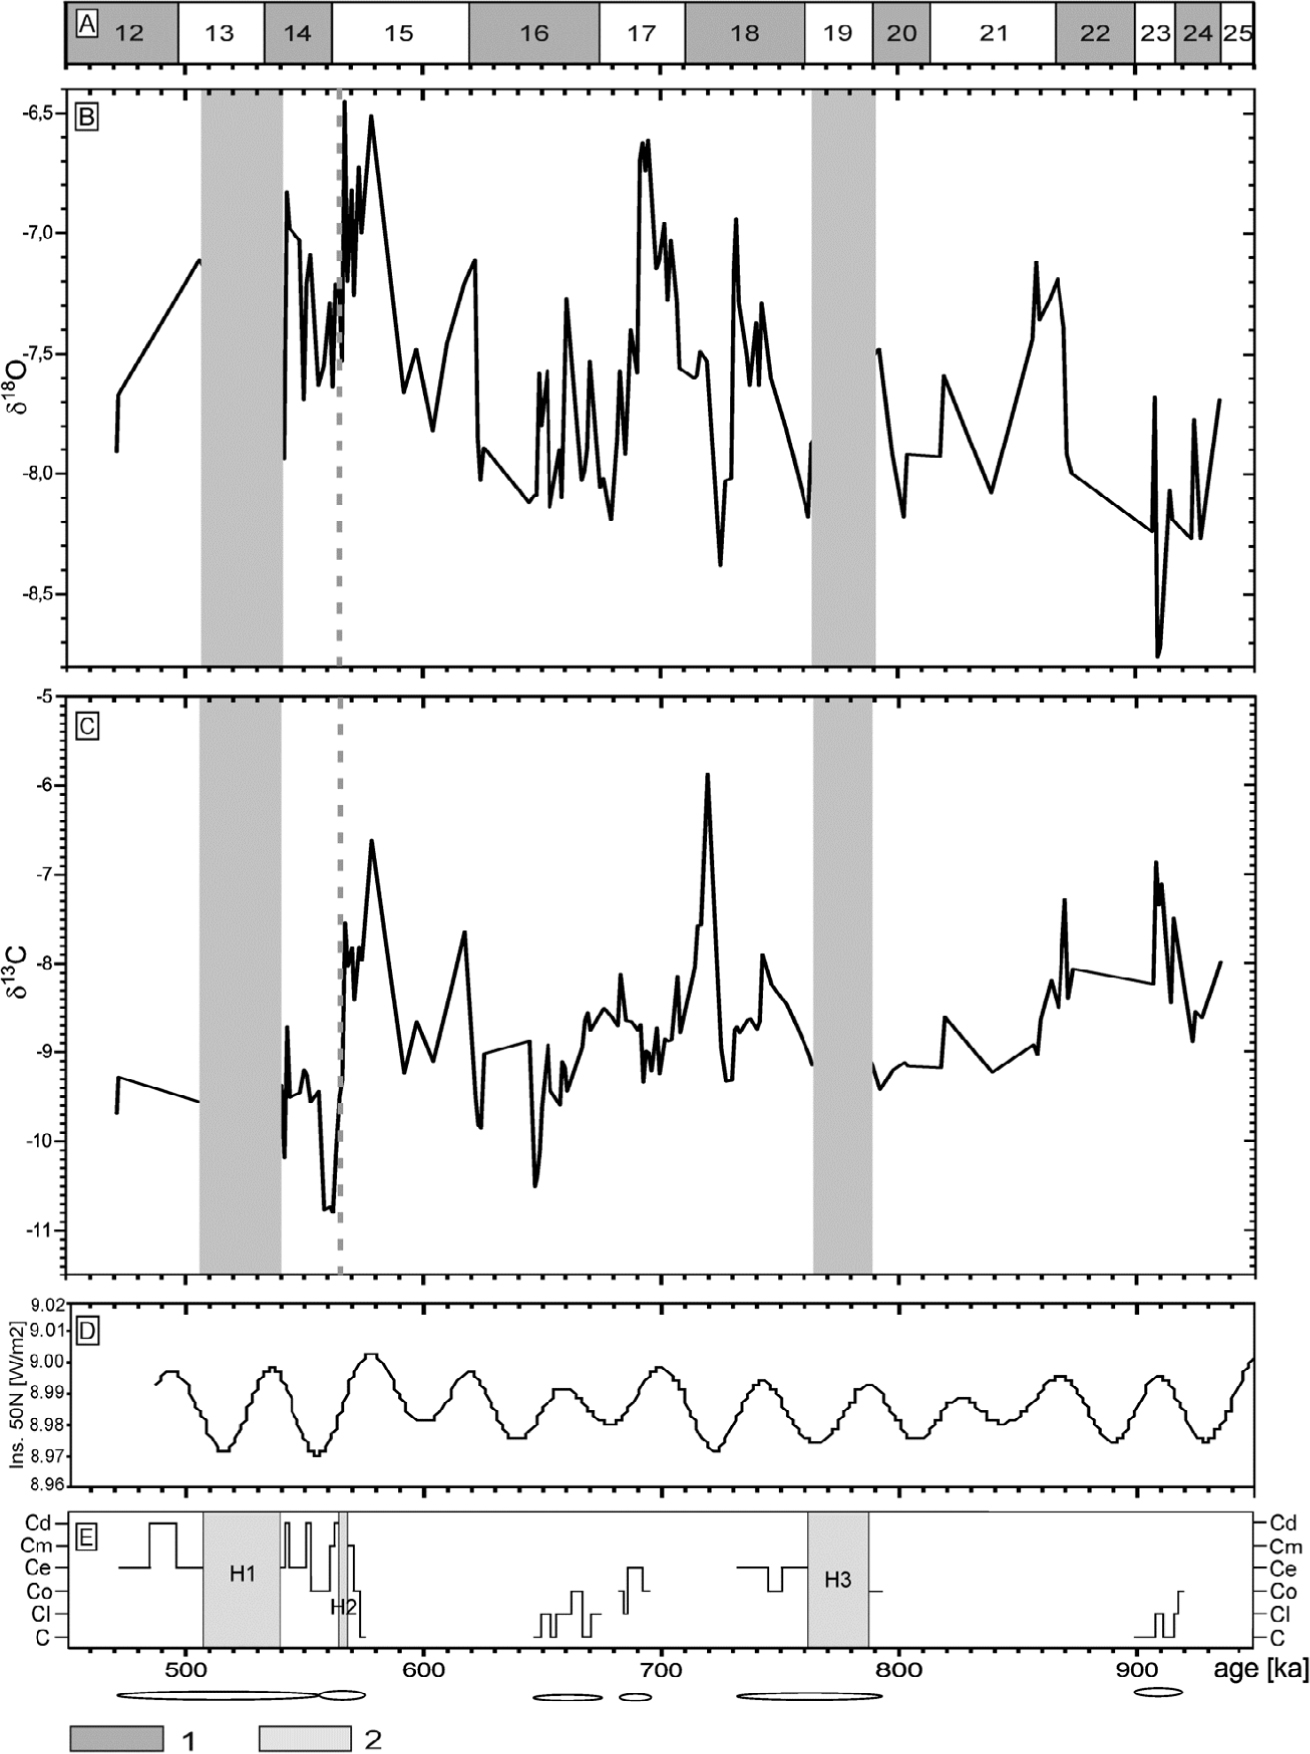
Fig. 7
The variability of δ18O (B) and δ13C (C) isotopes, with marked discontinuities in the surfaces, along with oxygen isotope stages (A), insolation at 50°N (D) and a fabric log (E) with marked as ellipsoids locations of thin sections on the timescale.. 1 – discontinuities in the surfaces; 2 – boundaries of oxygen-isotope stages (Lisiecki and Raymo, 2005).