
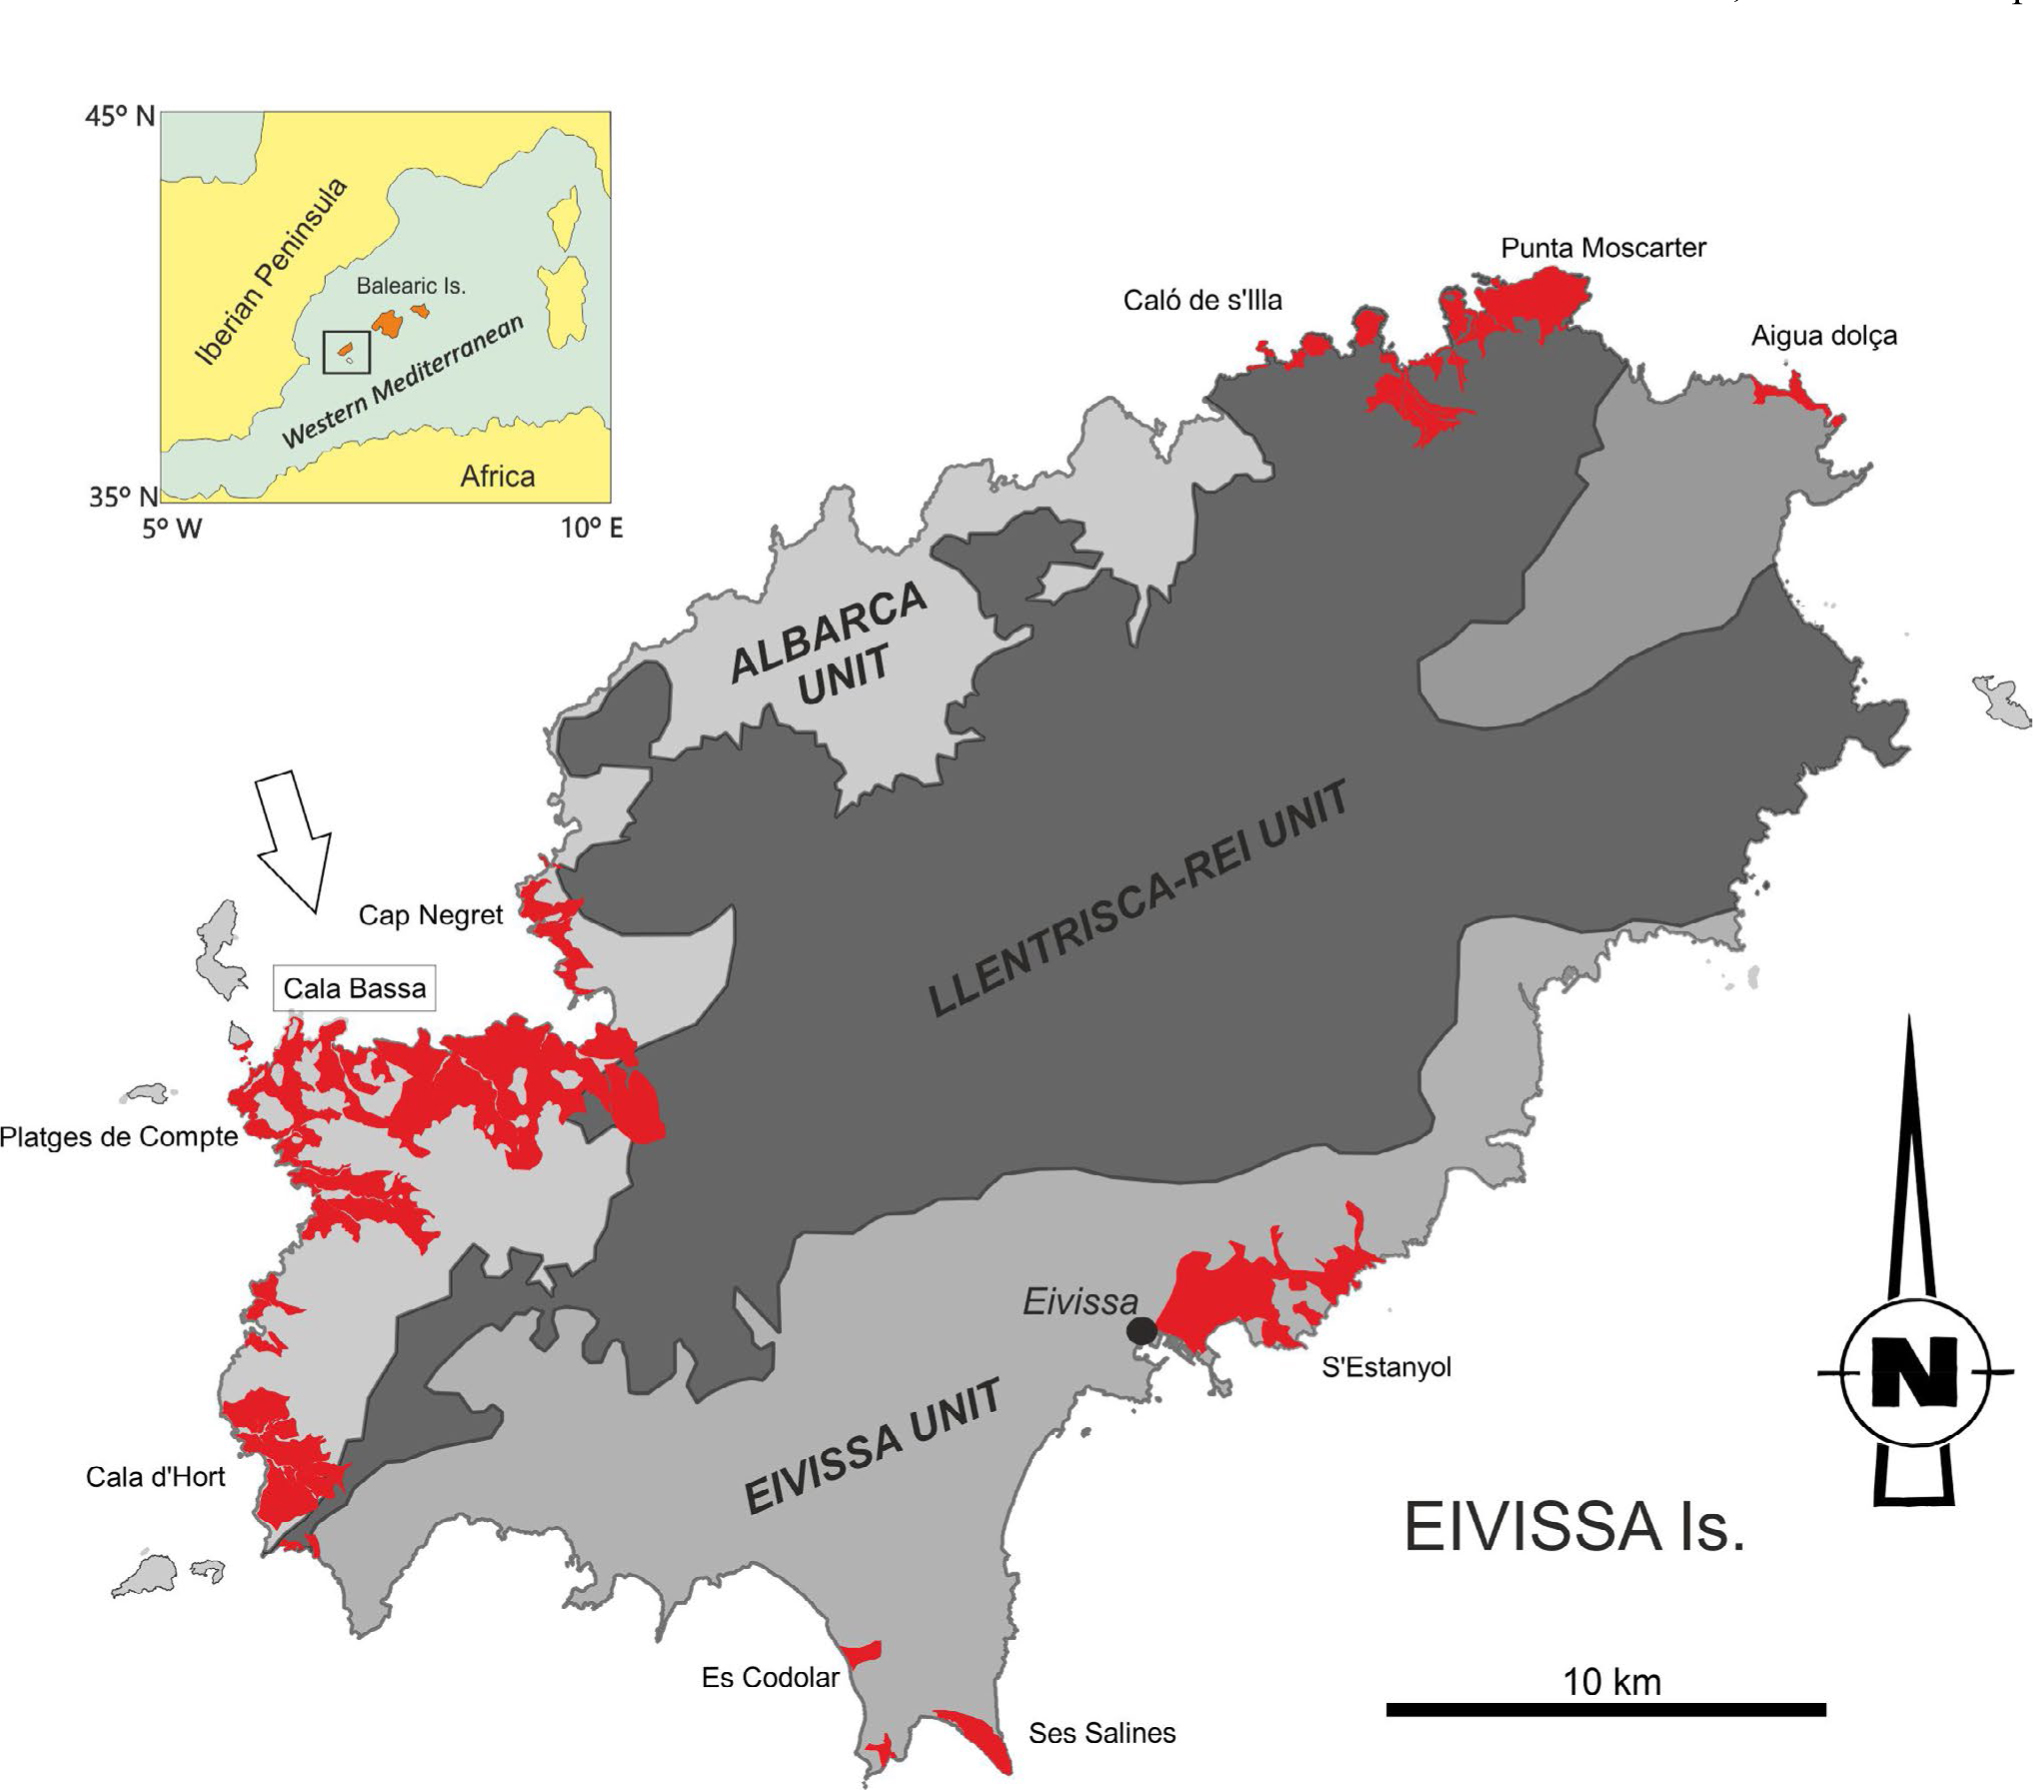
Fig. 1
Location of aeolianites (shown in red) that outcrop on the coast of Eivissa, Balearic Islands, Western Mediterranean (inset).
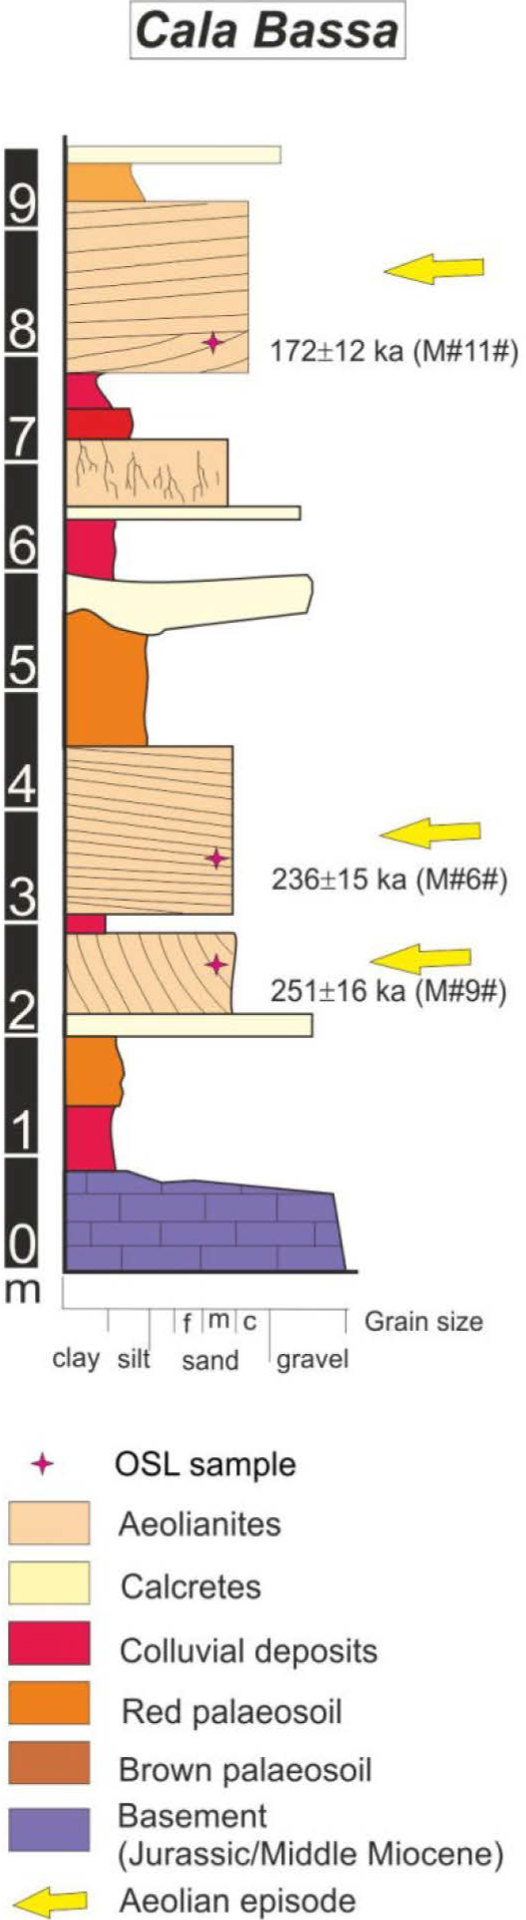
Fig. 2
Simplified stratigraphic log from Cala Bassa showing structural units and location of samples (stars) for OSL measurements. Each OSL age is the weighted average obtained for the fine and coarse quartz fractions.
Table 1
Equivalent doses (De), dosimetry measurements and OSL ages. The luminescence and dosimetry data are indicated along with the random uncertainties; the uncertainties mentioned with the OSL ages are the overall uncertainties. All the errors correspond to 1σ.
| Sample code | Grain size (μm) | Water content (%) | De (Gy) | U-Ra (Bq/kg) | Th (Bq/kg) | K (Bq/kg) | Total random error (%) | Total systematic error (%) | Total dose rate (Gy/ka) | Age (ka) | Weighted average age (ka) |
|---|---|---|---|---|---|---|---|---|---|---|---|
| M#11# | 4–11 | 4 | 133 ± 2 n=8 | 16.2 ± 0.7 | 2.0 ± 0.6 | 19.3 ± 3.5 | 3.4 | 9.8 | 0.73 ± 0.02 | 183 ± 19 | 172 ± 12 |
| 63–90 | 107 ± 4 n=8 | 4.8 | 6.1 | 0.61 ± 0.02 | 177 ± 14 | ||||||
| 90–125 | 103 ± 5 n=11 | 5.7 | 6.2 | 0.60 ± 0.02 | 173 ± 15 | ||||||
| 125–180 | 107 ± 6 n=10 | 6.4 | 6.2 | 0.60 ± 0.02 | 180 ± 16 | ||||||
| 180–250 | 91 ± 5 n=11 | 6.3 | 6.2 | 0.59 ± 0.02 | 155 ± 14 | ||||||
| M#6# | 4–11 | 4 | 175 ± 2 n=8 | 16.0 ± 0.6 | 2.0 ± 0.5 | 54.9 ± 3.0 | 2.6 | 8.9 | 0.80 ± 0.02 | 220 ± 20 | 236 ± 15 |
| 63–90 | 16.5 ± 0.2 | 3.3 | 5.6 | 0.67 ± 0.01 | 247 ± 16 | ||||||
| 90–125 | 155 ± 9 n=9 | 6.2 | 5.6 | 0.66 ± 0.01 | 237 ± 20 | ||||||
| 125–180 | 175 ± 7 n=10 | 4.6 | 5.6 | 0.65 ± 0.01 | 270 ± 20 | ||||||
| 180–250 | 137 ± 6 n=8 | 4.9 | 5.6 | 0.65 ± 0.01 | 212 ± 16 | ||||||
| M#9# | 4–11 | 2 | 179 ± 2 n=8 | 16.5 ± 0.2 | 2.7 ± 0.5 | 24.2 ± 3.1 | 2.4 | 10.0 | 0.73 ± 0.02 | 244 ± 25 | 251 ± 16 |
| 63–90 | 139 ± 6 n=12 | 4.8 | 5.5 | 0.60 ± 0.01 | 233 ± 17 | ||||||
| 90–125 | 146 ± 5n=10 | 4.1 | 5.5 | 0.59 ± 0.01 | 249 ± 17 | ||||||
| 125–180 | 148 ± 5 n=10 | 4.0 | 5.6 | 0.58 ± 0.01 | 254 ± 17 | ||||||
| 180–250 | 161 ± 7 n=10 | 4.9 | 5.6 | 0.58 ± 0.01 | 278 ± 21 |
[i] n denotes the number of accepted aliquots.
Beta attenuation and etching factor for 63–90 μm, 90–125 μm, 125–180 μm, 180–250 μm assumed to be 0.94 ± 0.050, 0.90 ± 0.045, 0.88 ± 0.044, 0.87 ± 0.044, respectively; adopted alpha efficiency factor was 0.04 ± 0.02.
Water content estimation was based on the difference between the raw and the oven-dried weight of material from the interiors of the blocks.
The total dose rates include the contribution from the alpha, beta and gamma radiations, and the contribution from the cosmic rays; an internal contribution for the coarse fraction assumed to be 0.01 Gy/ka (Vandenberghe et al., 2008).
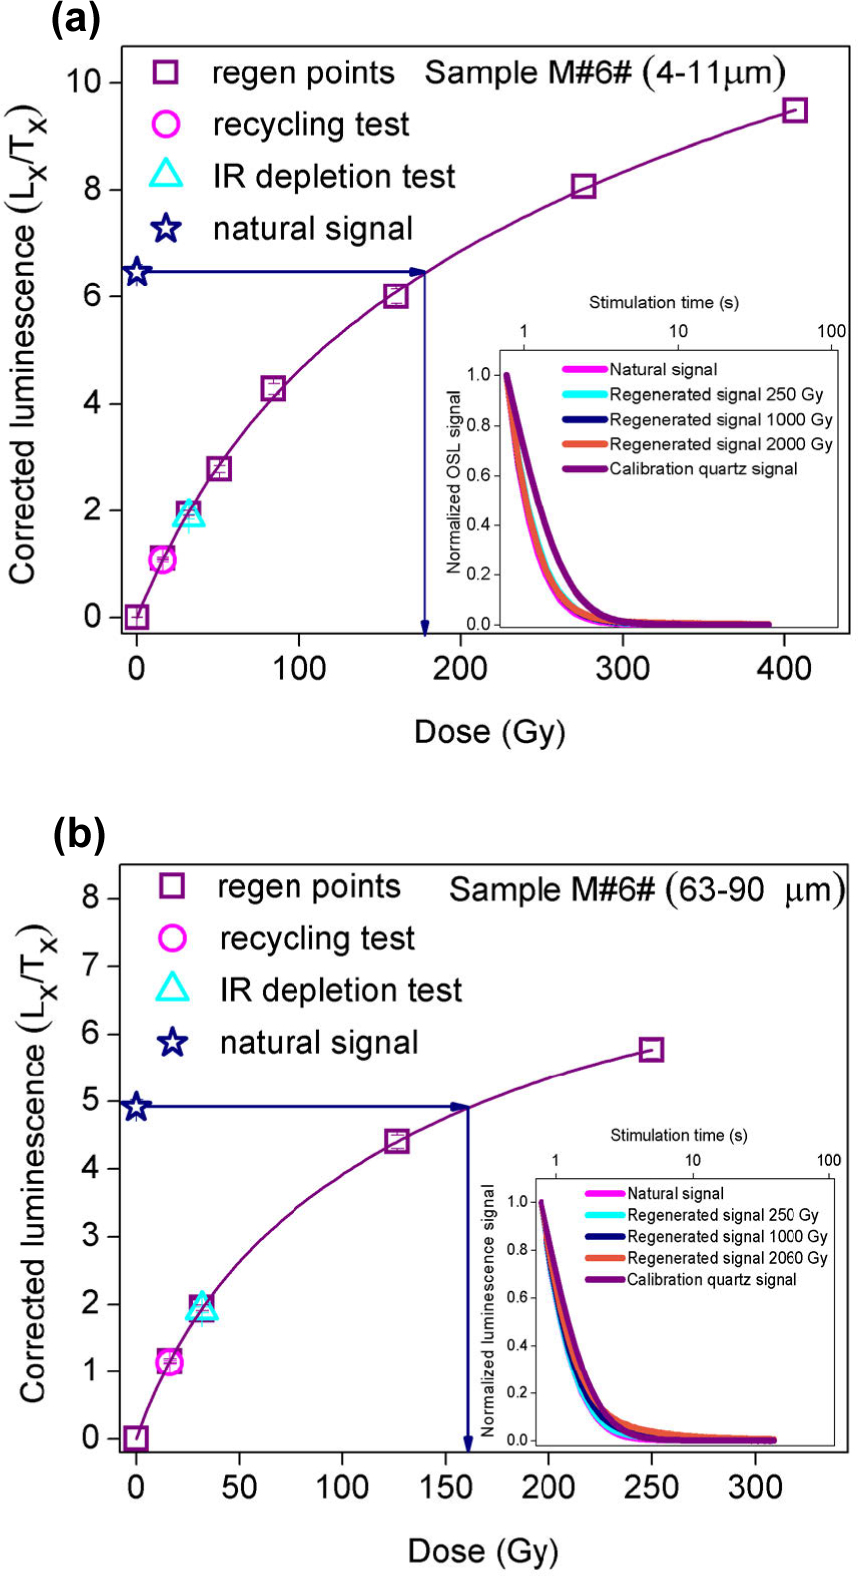
Fig. 3
Representative SAR dose response curves and decay curves for fine and coarse quartz. (a) SAR dose response curve for an aliquot of 4–11 μm quartz extracted from sample M#6# and test results. Inset shows a typical normalised natural OSL signal and response to 250, 1000 and 2000 Gy compared with that for calibration quartz in response to 4.81 Gy. (b) Same data for an aliquot of 63–90 μm quartz extracted from sample M#6#. The error bars often fall within the data point on the graph.
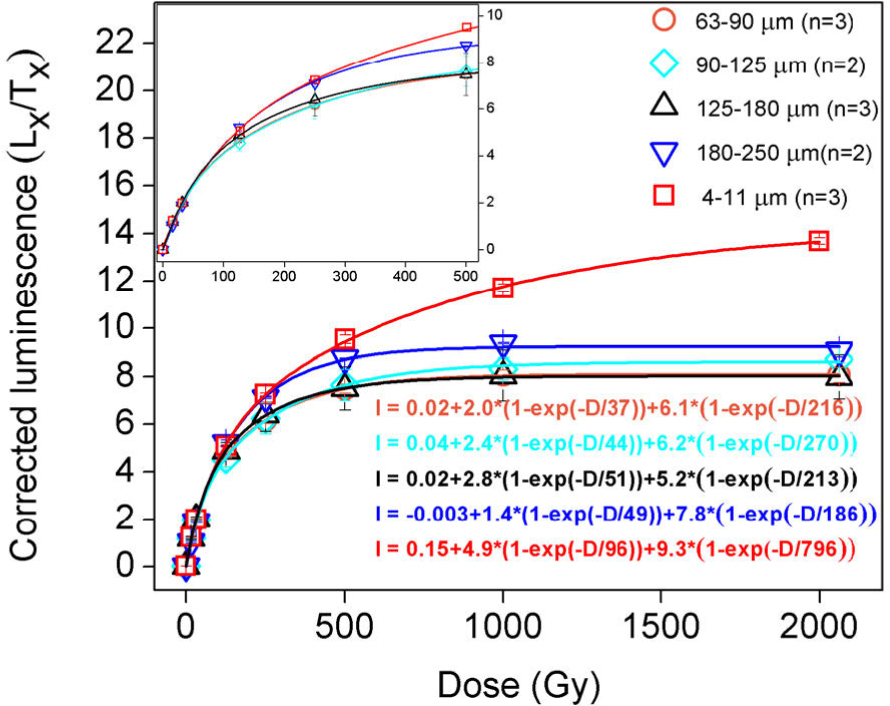
Fig. 4
SAR dose response curves for doses up to 2000 Gy for aliquots of 4–11, 63–90, 90–125, 125–180 and 180–250 μm quartz extracted from sample M#6#. The inset shows an enlargement for the dose region up to 500 Gy. The number of aliquots used for each fraction and the equations used to fit the curves are also indicated.
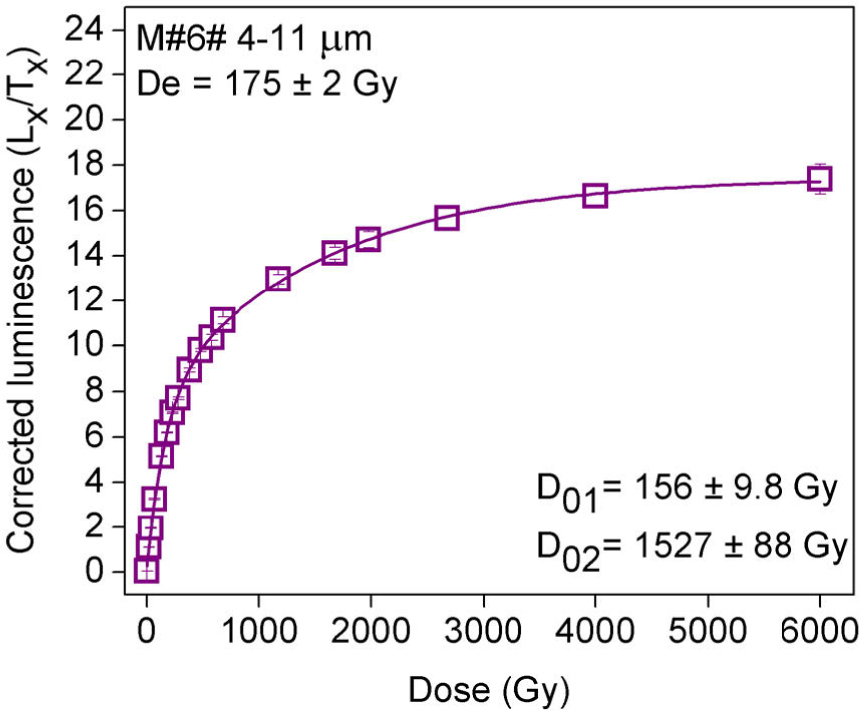
Fig. 5
Average SAR dose response curve for doses up to 6000 Gy for 3 aliquots of 4–11 μm from M#6#.
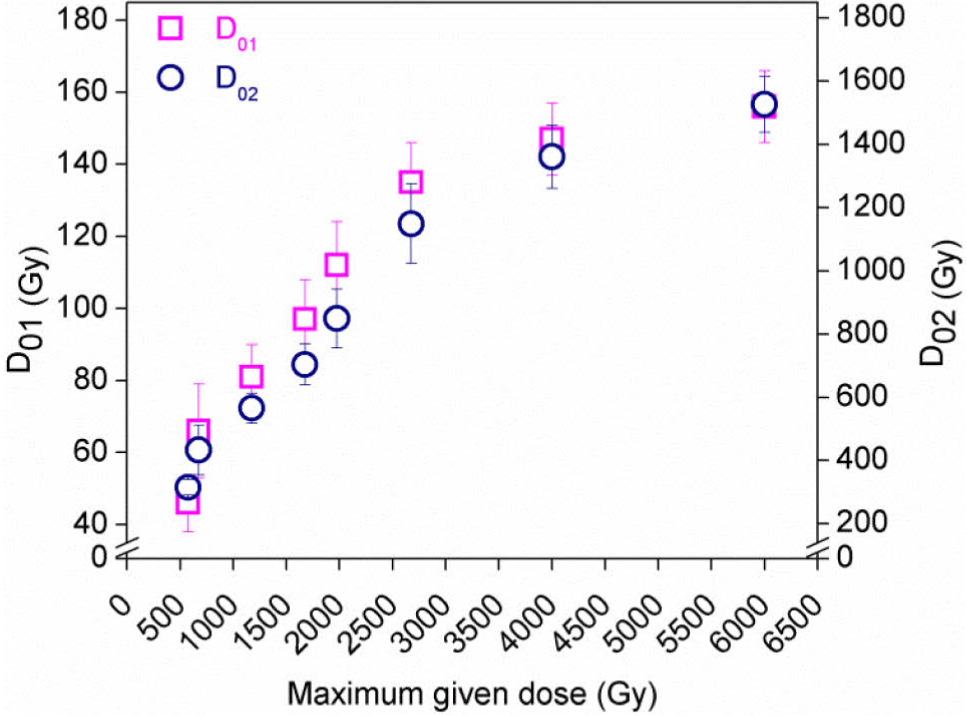
Fig. 6
Saturation characteristics (D01, D02) obtained from the data in Fig. 5, calculated when using increasingly high doses.
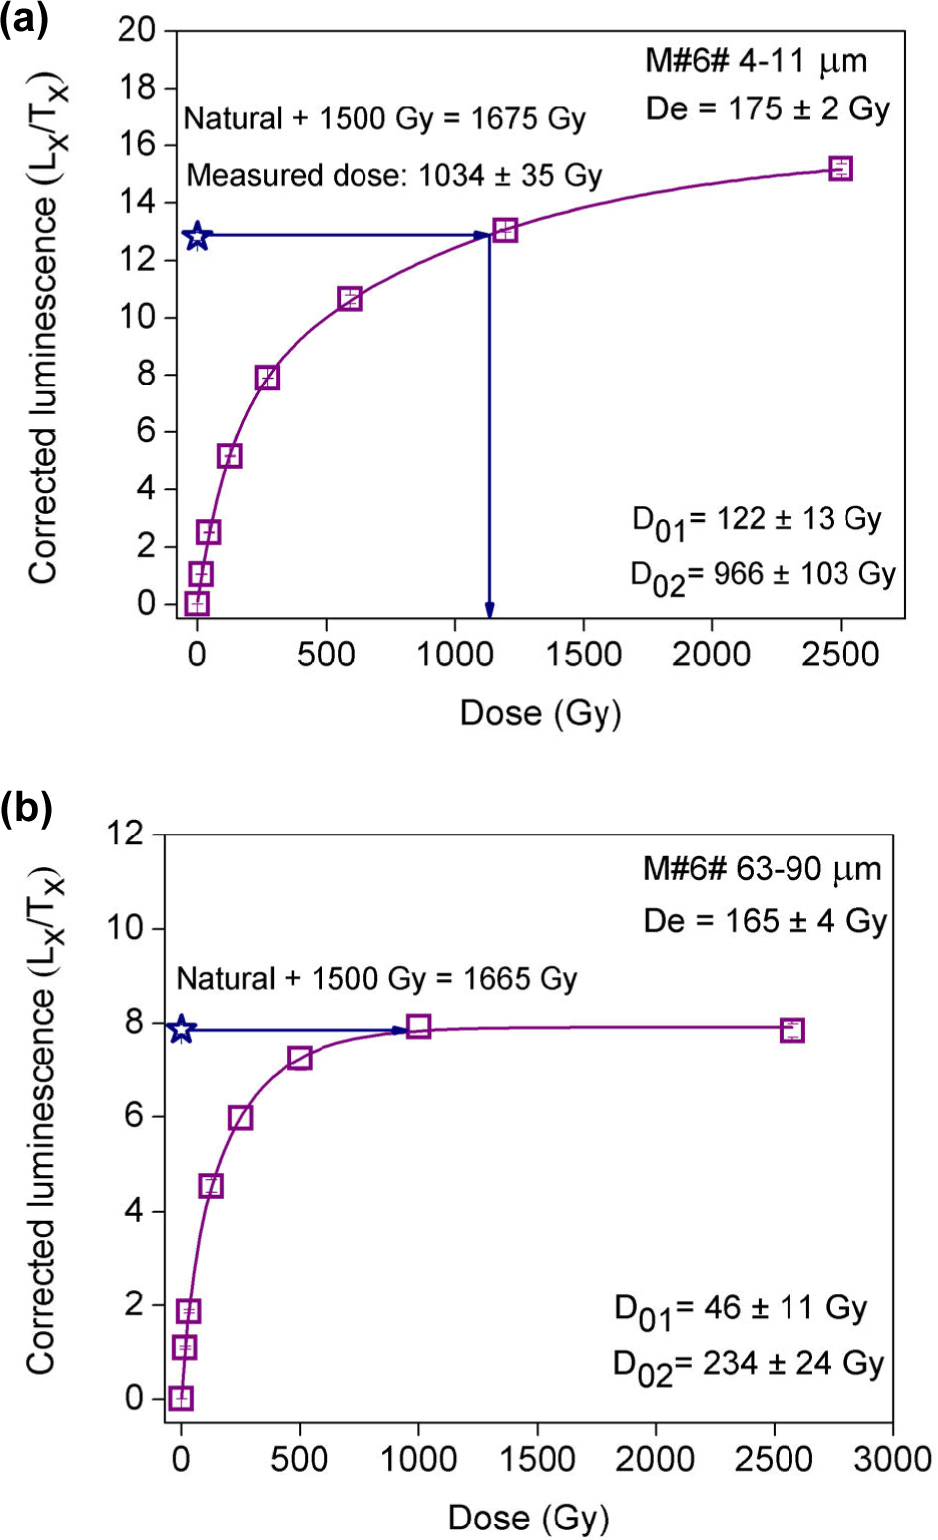
Fig. 7
Average (n=3) SAR dose-response curves constructed after giving 1500 Gy in addition to the natural dose. (a) Data for 4–11 μm grains from sample M#6#. (b) Same data for 63–90 μm grains from sample M#6#. The sensitivity corrected signal related to the natural plus 1500 Gy dose is shown as a horizontal line projected onto the dose response curve.
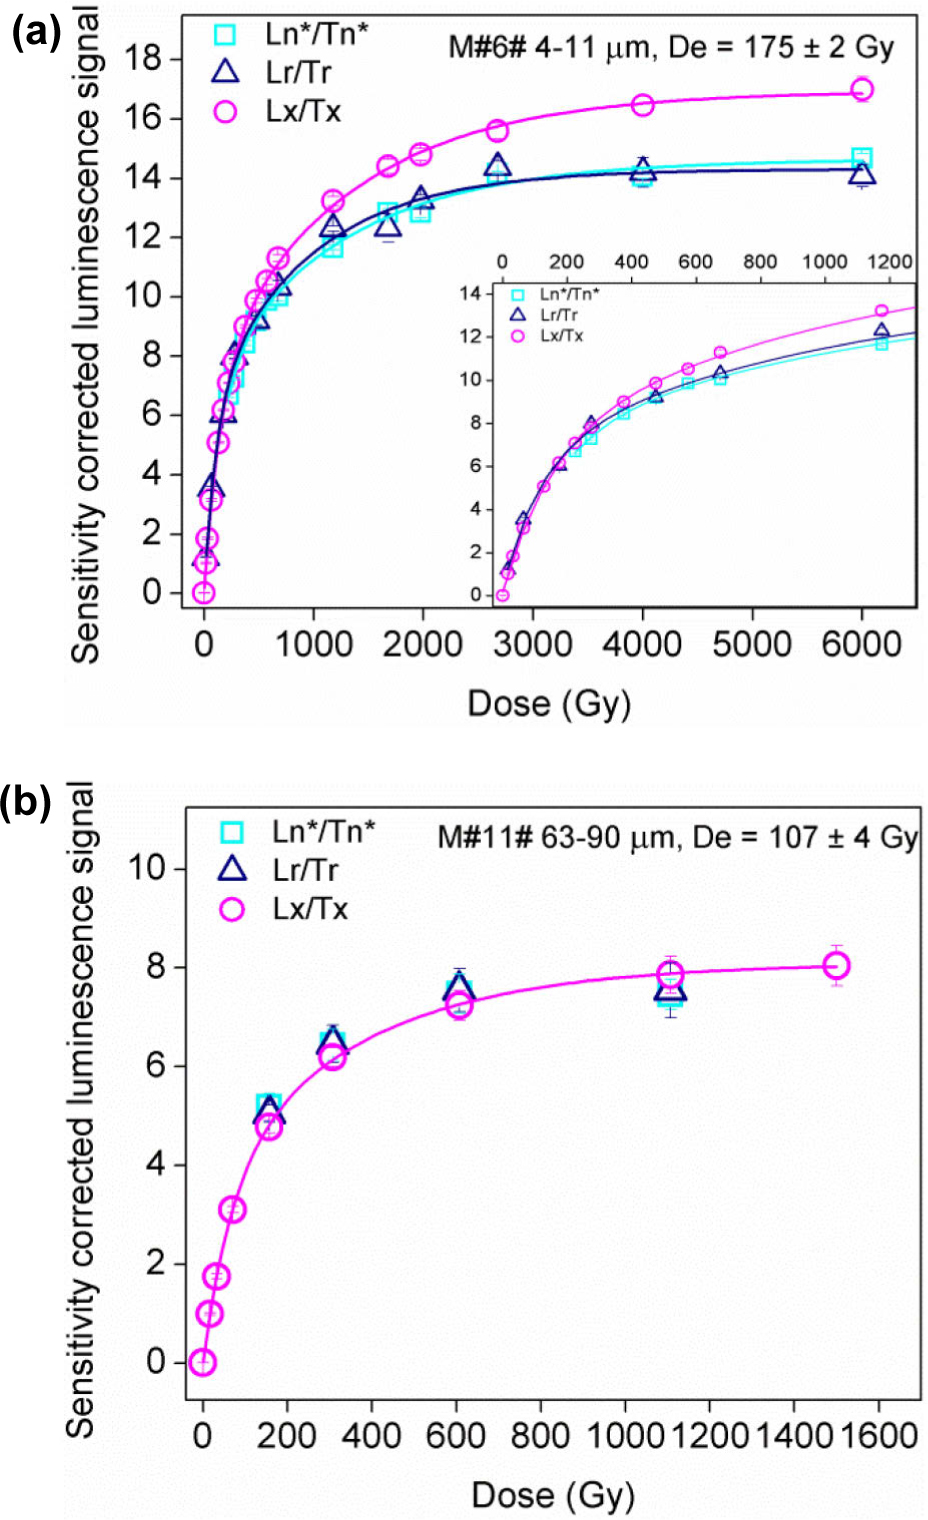
Fig. 8
Average Ln∗/Tn∗ plotted as a function of equivalent dose + laboratory dose, average Lr/Tr measured after one bleach as in dose recovery test and average Lx/Tx measured in a SAR sequence. (a) Data for 4–11 μm quartz from sample M#6#. (b) Same data for 63–90 μm quartz from sample M#11#. Each measurement on fine quartz is the average of three to thirteen aliquots, whereas for the coarse fraction between three and seven aliquots have been used for measurements. The dose response curves were fitted using the sum of two saturating exponential functions. Inset in Fig. 9a presents the same data but enlarged for the low dose region.
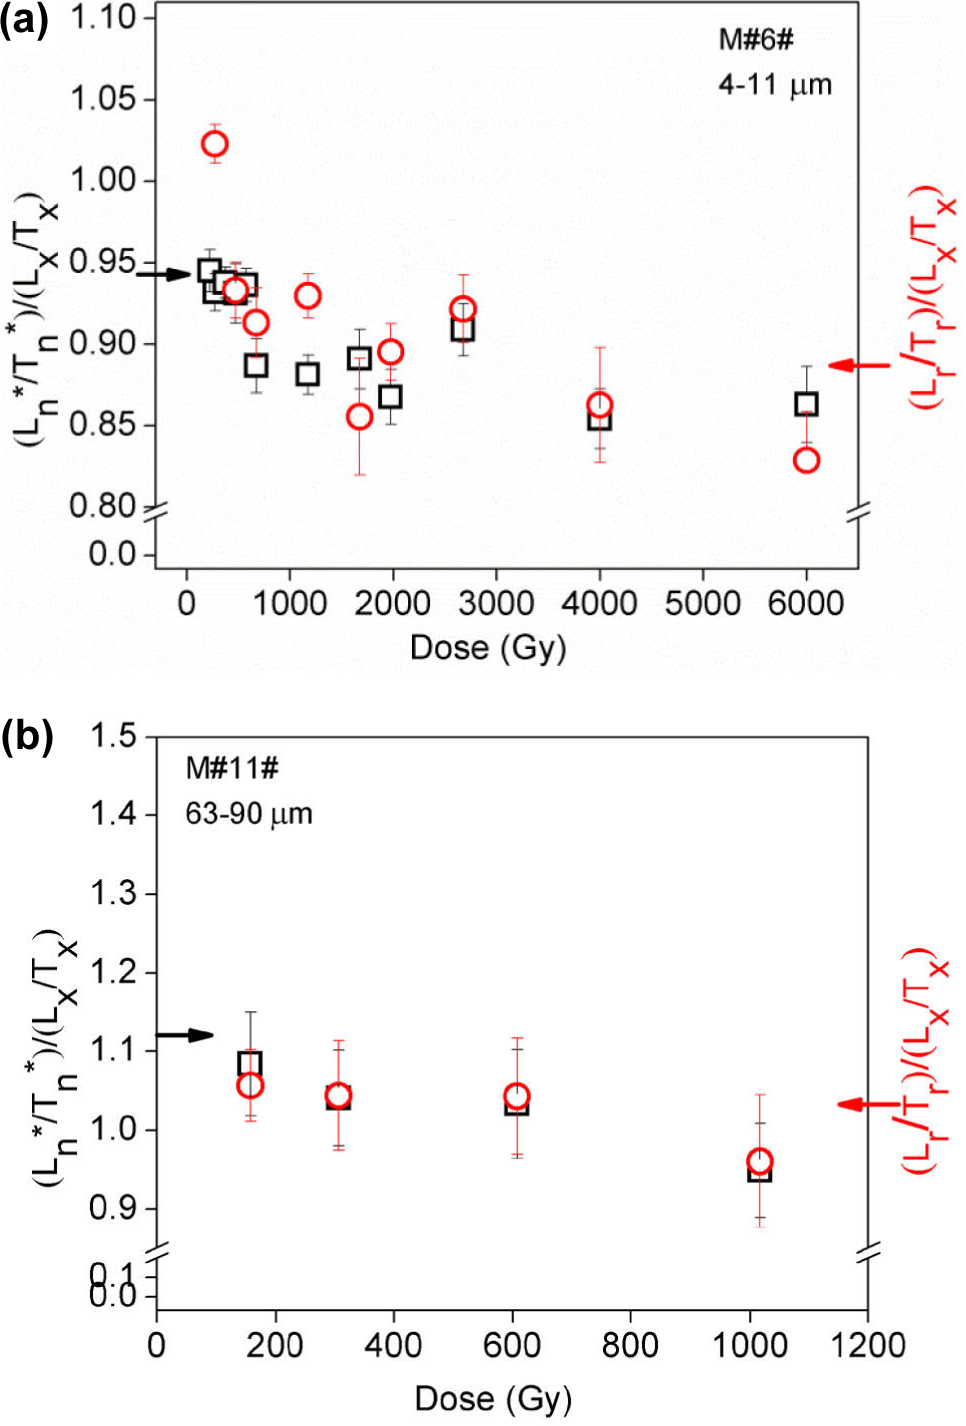
Fig. 9
The (Ln/Tn)/(Lx/Tx) and (Lr/Tr)/(Lx/Tx) ratios as a function of dose obtained using the data in Fig. 8 and Table S4. (a) Data for 4–11 μm quartz from sample M#6#. (b) Data for 63–90 μm quartz from sample M#11#.
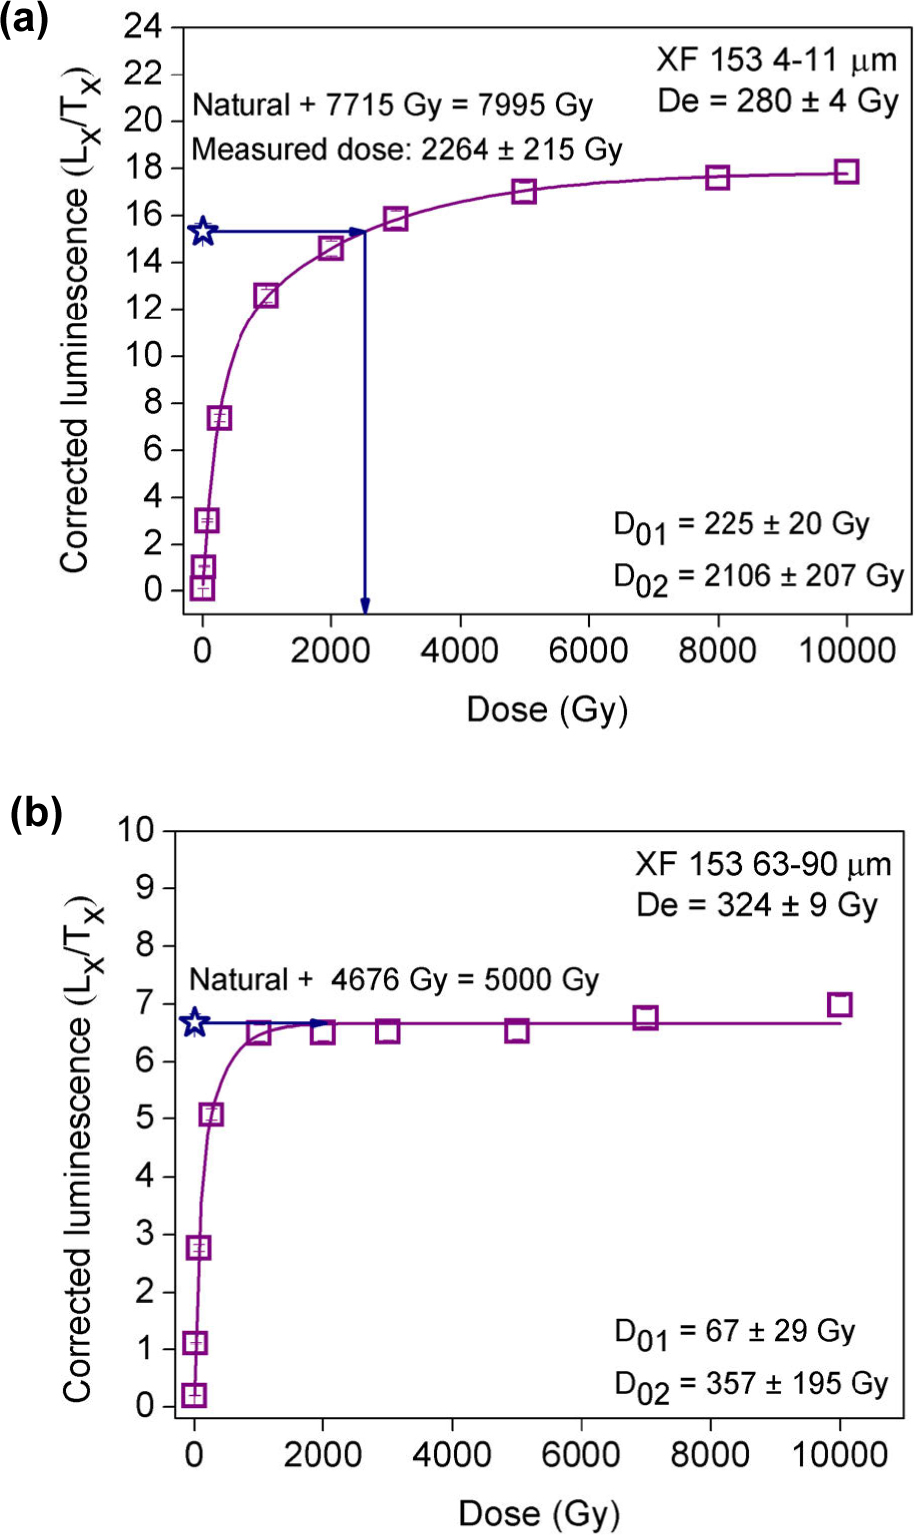
Fig. 10
SAR dose-response curves constructed for (a) fine and (b) coarse grains from sample XF 153 after adding 7715 Gy and 4676 Gy, respectively, in addition to the natural dose. These results were obtained using one aliquot for each quartz fraction. The sensitivity corrected signal corresponding to the sum of natural and added dose is interpolated on the constructed dose response curve.
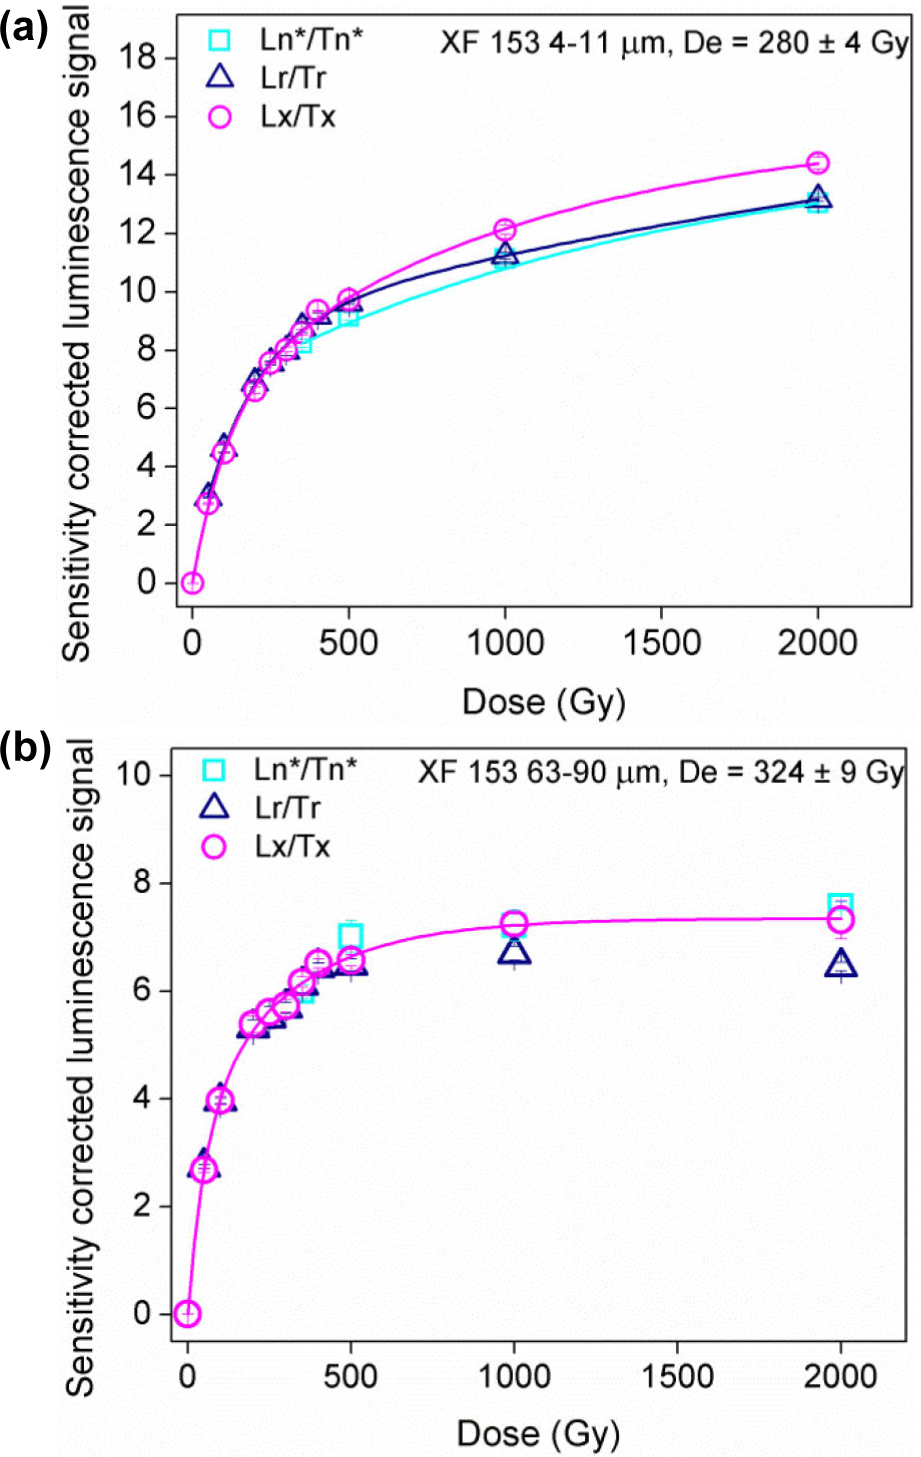
Fig. 11
Average Ln∗/Tn∗ values plotted as a function of equivalent dose + laboratory dose, average Lr/Tr measured after one bleach as in dose recovery and average Lx/Tx values measured in a SAR sequence. (a) Data for 4–11 μm quartz from sample XF 153. (b) Same data for 63–90 μm quartz from sample XF 153. For both fine and coarse quartz, between two and four aliquots were used for measurements. The dose response curves were fitted using the sum of two saturating exponential functions.
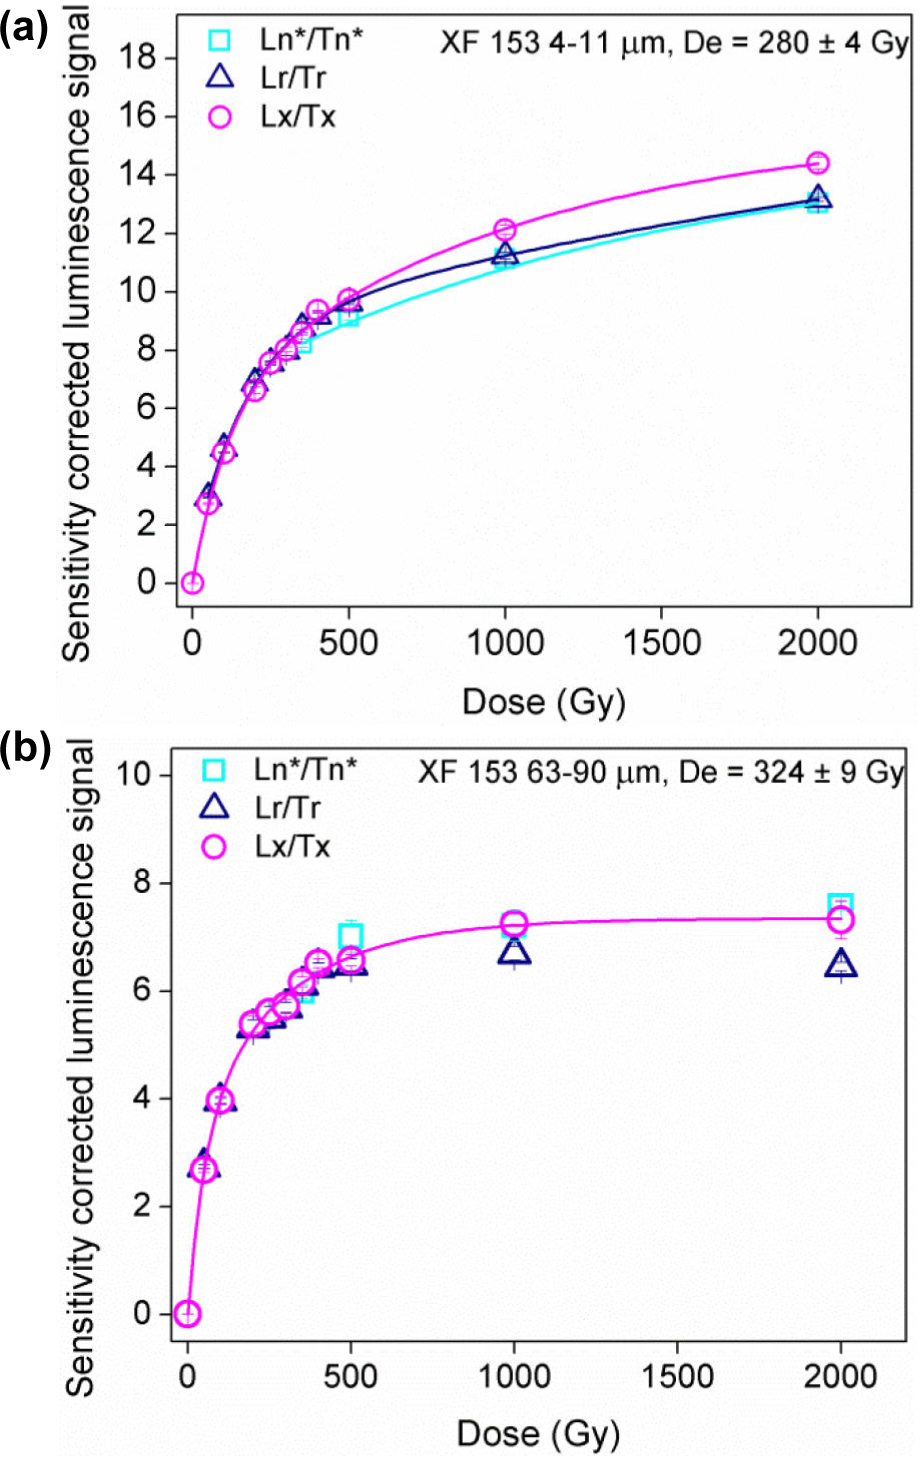
Fig. 12
The ratios (Ln/Tn)/(Lx/Tx) and (Lr/Tr)/(Lx/Tx) as a function of dose obtained using the data in Fig. 11 and Tables S6 and S7. (a) Data for 4–11 μm quartz from sample XF 153. (b) Same data for coarse grains from sample XF 153.